

This is a preprint.
Highly coordinated nationwide massive travel restrictions are central to effective mitigation and control of COVID-19 outbreaks in China
- PMID: 35018295
- PMCID: PMC8750704
Highly coordinated nationwide massive travel restrictions are central to effective mitigation and control of COVID-19 outbreaks in China
Update in
-
Highly coordinated nationwide massive travel restrictions are central to effective mitigation and control of COVID-19 outbreaks in China.Proc Math Phys Eng Sci. 2022 Apr;478(2260):20220040. doi: 10.1098/rspa.2022.0040. Epub 2022 Apr 13. Proc Math Phys Eng Sci. 2022. PMID: 35450022 Free PMC article.
Abstract
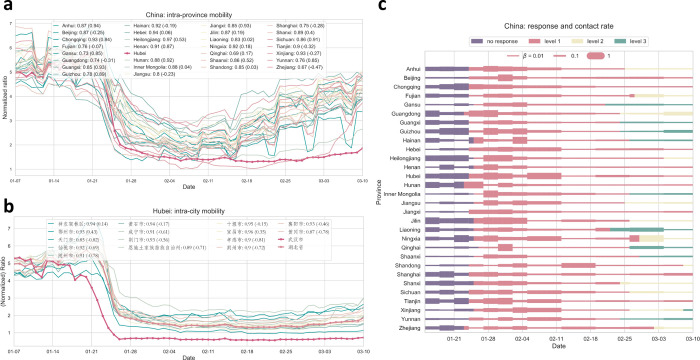
The COVID-19, the disease caused by the novel coronavirus 2019 (SARS-CoV-2), has caused graving woes across the globe since first reported in the epicenter Wuhan, Hubei, China, December 2019. The spread of COVID-19 in China has been successfully curtailed by massive travel restrictions that put more than 900 million people housebound for more than two months since the lockdown of Wuhan on 23 January 2020 when other provinces in China followed suit. Here, we assess the impact of China's massive lockdowns and travel restrictions reflected by the changes in mobility patterns before and during the lockdown period. We quantify the synchrony of mobility patterns across provinces and within provinces. Using these mobility data, we calibrate movement flow between provinces in combination with an epidemiological compartment model to quantify the effectiveness of lockdowns and reductions in disease transmission. Our analysis demonstrates that the onset and phase of local community transmission in other provinces depends on the cumulative population outflow received from the epicenter Hubei. As such, infections can propagate further into other interconnected places both near and far, thereby necessitating synchronous lockdowns. Moreover, our data-driven modeling analysis shows that lockdowns and consequently reduced mobility lag a certain time to elicit an actual impact on slowing down the spreading and ultimately putting the epidemic under check. In spite of the vastly heterogeneous demographics and epidemiological characteristics across China, mobility data shows that massive travel restrictions have been applied consistently via a top-down approach along with high levels of compliance from the bottom up.
Figures


Similar articles
-
Highly coordinated nationwide massive travel restrictions are central to effective mitigation and control of COVID-19 outbreaks in China.Proc Math Phys Eng Sci. 2022 Apr;478(2260):20220040. doi: 10.1098/rspa.2022.0040. Epub 2022 Apr 13. Proc Math Phys Eng Sci. 2022. PMID: 35450022 Free PMC article.
-
An analysis of the domestic resumption of social production and life under the COVID-19 epidemic.PLoS One. 2020 Jul 22;15(7):e0236387. doi: 10.1371/journal.pone.0236387. eCollection 2020. PLoS One. 2020. PMID: 32697812 Free PMC article.
-
The Coupled Impact of Emergency Responses and Population Flows on the COVID-19 Pandemic in China.Geohealth. 2020 Dec 14;4(12):e2020GH000332. doi: 10.1029/2020GH000332. eCollection 2020 Dec. Geohealth. 2020. PMID: 33344872 Free PMC article.
-
Sustainable COVID-19 Mitigation: Wuhan Lockdowns, Health Inequities, and Patient Evacuation.Int J Health Policy Manag. 2020 Oct 1;9(10):415-418. doi: 10.34172/ijhpm.2020.63. Int J Health Policy Manag. 2020. PMID: 32610729 Free PMC article.
-
[The outbreak of COVID-19 in China].Internist (Berl). 2020 Aug;61(8):776-781. doi: 10.1007/s00108-020-00833-w. Internist (Berl). 2020. PMID: 32548651 Free PMC article. Review. German.
References
-
- Lloyd-Smith JO. 2017. Predictions of virus spillover across species. Nature 546, 603–604. - PubMed
-
- Petersen LR, Jamieson DJ, Powers AM, Honein MA. 2016. Zika virus. New England Journal of Medicine 374, 1552–1563. - PubMed
-
- Leroy EM, Kumulungui B, Pourrut X, Rouquet P, Hassanin A, Yaba P, Délicat A, Paweska JT, Gonzalez JP, Swanepoel R. 2005. Fruit bats as reservoirs of Ebola virus. Nature 438, 575–576. - PubMed
Publication types
Grants and funding
LinkOut - more resources
Full Text Sources
Research Materials
Miscellaneous