. 2022 Feb 18;25(2):103743.
doi: 10.1016/j.isci.2022.103743. Epub 2022 Jan 7.

Immunity to SARS-CoV-2 up to 15 months after infection

Affiliations

Immunity to SARS-CoV-2 up to 15 months after infection

Harold Marcotte et al. iScience. .

Abstract

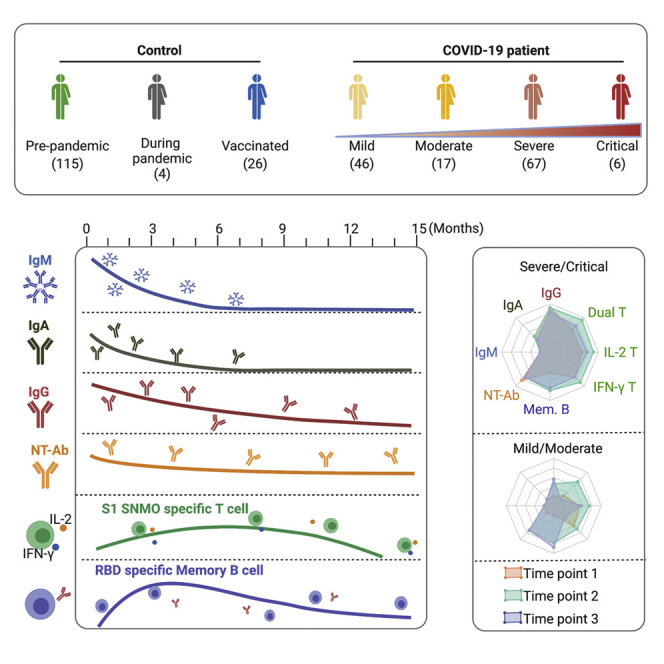
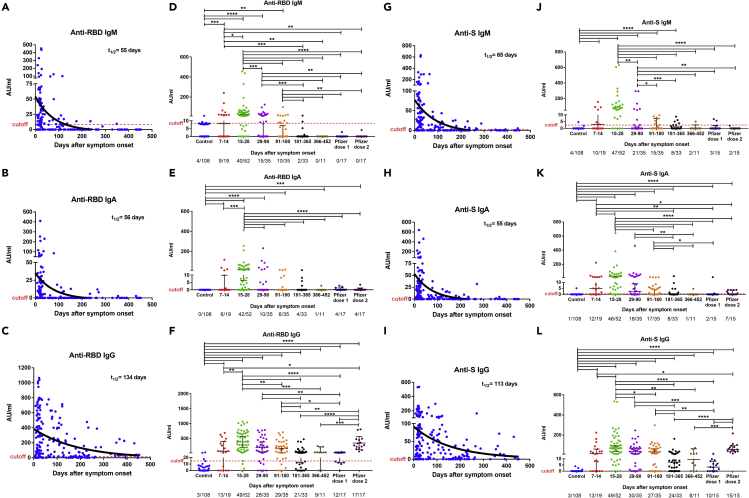
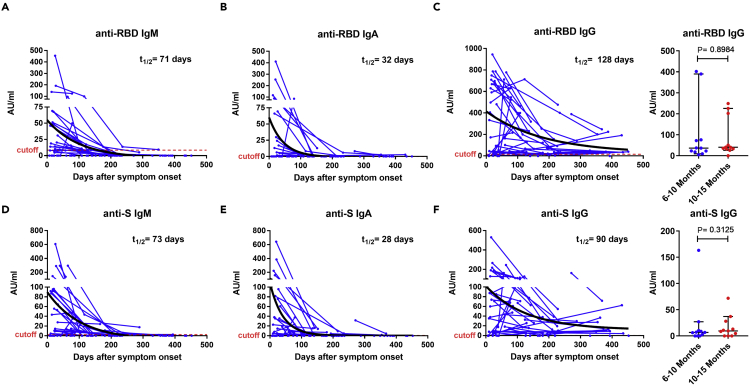
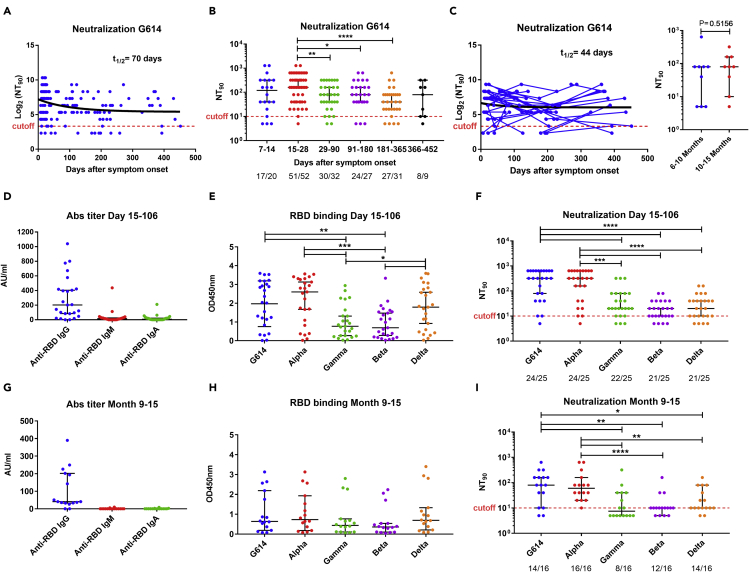
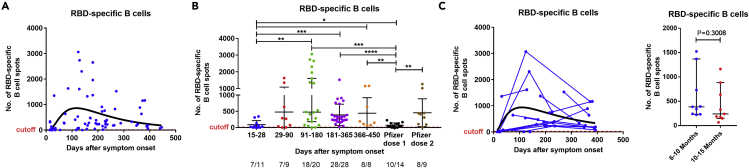
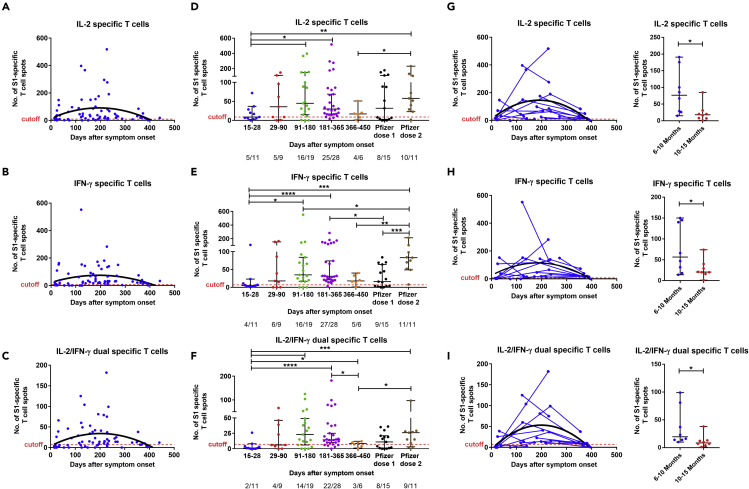
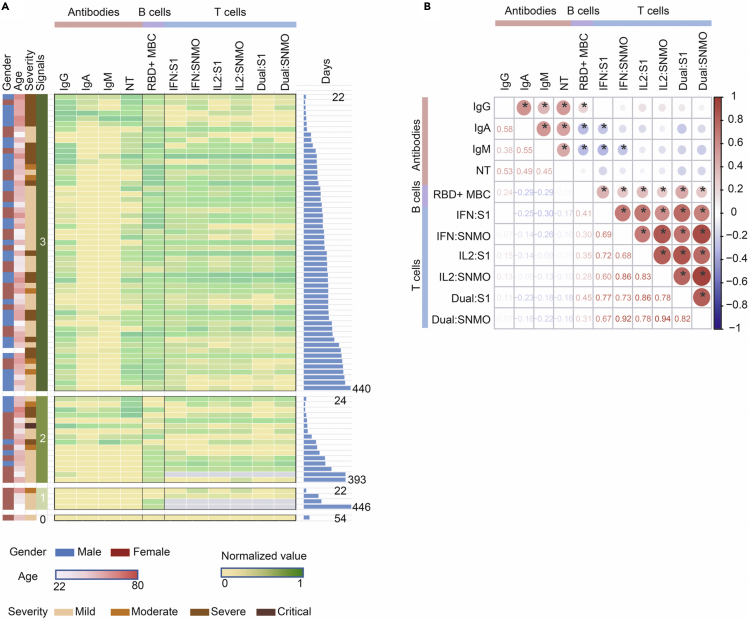
Information concerning the longevity of immunity to SARS-CoV-2 following natural infection may have considerable implications for durability of immunity induced by vaccines. Here, we monitored the SARS-CoV-2 specific immune response in COVID-19 patients followed up to 15 months after symptoms onset. Following a peak at day 15-28 postinfection, the IgG antibody response and plasma neutralizing titers gradually decreased over time but stabilized after 6 months. Compared to G614, plasma neutralizing titers were more than 8-fold lower against variants Beta, Gamma, and Delta. SARS-CoV-2-specific memory B and T cells persisted in the majority of patients up to 15 months although a significant decrease in specific T cells, but not B cells, was observed between 6 and 15 months. Antiviral specific immunity, especially memory B cells in COVID-19 convalescent patients, is long-lasting, but some variants of concern may at least partially escape the neutralizing activity of plasma antibodies.

Keywords: Immune response; Immunology; Virology.


Conflict of interest statement

The other authors declare no competing interests.

Figures

None
Graphical abstract
Figure 1
Figure 1
Flowchart illustrating the study design and analysis For ELISA, Neutralization and ELISpot/Fluorospot, the number of individuals (n = ), and the number of analyzed samples (in parentheses) are indicated. See also Tables S1, S2, S3 and S4
Figure 2
Figure 2
Cross-sectional analysis of plasma anti-SARS-CoV-2 antibody titers patients over time Levels of anti-RBD (A–F) and anti-S (G–L) IgM, IgA, and IgG antibodies in plasma of COVID-19 patients, historical controls, and vaccinated individuals. Antibodies were measured in 185 samples from 136 COVID-19 patients, 108 historical controls (before the SARS-CoV-2 pandemic), and 23 vaccinated individuals. The RBD (A–C) and S (G–I) specific IgM, IgG, IgA antibody decay curves (in black) and half-lives (t1/2) were estimated by a one-phase exponential decay model. Samples from patients were further divided in six study periods: 7–14 days (n = 19), 15–28 days (n = 52), 29–90 days (n = 35), 91–180 days (n = 35), 181–365 days (n = 33), and 366–452 (n = 11) after symptom onset (D–F and J–L) for comparison. Vaccinated individuals were sampled 14–35 days after the first dose and 14–36 days after the second dose. For each time interval, the proportion of positive samples is indicated below the X axis. Symbols represent individual subjects; horizontal black lines indicate the median and 95% CI. The dashed red line indicates the cutoff value for elevated anti-S and anti-RBD antibody titers (2.5 and 8.4 AU/mL for IgM, 0.5 and 0.08 AU/mL for IgA, and 0.03 and 14.81 AU/mL for IgG, respectively, giving a specificity of 96% for IgM, 99% for IgA, and 97% for IgG). The cutoff-value is not visible in some graphs because it is very close to the X axis. Mann-Whitney U test. ∗p ≤ 0.05, ∗∗p ≤ 0.01, ∗∗∗p ≤ 0.001, and ∗∗∗∗p < 0.0001. See also Figures S1 and S2.
Figure 3
Figure 3
Longitudinal analysis of plasma antibody titers Anti-RBD (A–C) and anti-S (D–F) IgM, IgA, and IgG antibodies in paired samples from 42 COVID-19 patients over 15 months. For anti-RBD (C) and anti-S (F) IgG antibodies, further comparisons were made between paired samples (n = 11) at two time points ranging from 6 to 15 months (TP1: 181–300 and TP2: 301–452 days after symptoms onset; right panel). Symbols represent individual subjects; horizontal black lines indicate the median and 95% CI. The antibody decay curves (in black) and half-lives (t1/2) were estimated by a one-phase exponential decay model. The dashed red line indicates the cutoff value for elevated anti-S and anti-RBD antibody titers (2.5 and 8.4 AU/mL for IgM, 0.5 and 0.08 AU/mL for IgA, and 0.03 and 14.81 AU/mL for IgG, respectively, giving a specificity of 96% for IgM, 99% for IgA, and 97% for IgG). The cutoff-value is not visible in some graphs because it is very close to the X axis. Wilcoxon signed-rank test. See also Figure S1.
Figure 4
Figure 4
Cross-sectional and longitudinal analysis of plasma neutralization activity against SARS-CoV-2 and variants of concern (A) Dynamics of plasma neutralizing activity against G614 variant in COVID-19 patient samples over time. (B) Samples from patients were taken at seven study periods: 7–14 days (n = 20), 15–28 days (n = 52), 29–90 days (n = 32), 91–180 days (n = 27), 181–365 days (n = 31), and 366–452 (n = 9) after symptom onset. For each time interval, the proportion of positive samples is indicated below the X axis. (C) For longitudinal analysis, samples were taken at two (n = 31) or more (n = 7) time points and further comparisons were made between paired samples (n = 9) at two time points ranging from 6 to 15 months (TP1: 181–300 and TP2: 301–452 days after symptoms onset; right panel). The NT90 decay curves (in black) and corresponding half-lives (t1/2) were estimated by a one-phase decay model (A, C). To test cross-neutralization, the level of anti-RBD IgM, IgA, and IgG titers (D, G), binding activity of IgG antibody to RBD from SARS-CoV-2 variants (E, H), and plasma neutralizing activity against variants (F, I) were tested in plasma collected from COVID-19 patients at 15–106 days (median day of 24) and 9–15 months (241–452 days, median day of 370). The data in D and G represent a subset of data presented in Figure 2. The dashed red line indicates the titer cutoff value (≥1:10). The cutoff-value is not visible in some graphs because it is very close to the X axis. Symbols represent individual subjects; horizontal black lines indicate the median and 95% CI. Mann-Whitney U test. ∗p≤ 0.05, ∗∗p ≤ 0.01, ∗∗∗p ≤ 0.001, and ∗∗∗∗p < 0.0001. See also Figures S1 and S2.
Figure 5
Figure 5
Cross-sectional and longitudinal analysis of SARS-CoV-2-specific memory B cell responses in COVID-19 patients (A) Dynamics of RBD-specific memory B cells levels in COVID-19 patient samples over time with the corresponding log-normal fitting curve (in black). (B) B cells were measured in control (n = 11), COVID-19 samples at five study periods: 14–30 days (n = 11), 31–90 days (n = 9), 91–180 (n = 20), 181–365 (n = 28), and 366–452 (n = 8) days after symptom onset, as well as vaccine samples after first (n = 14) and second (n = 9) dose. For each time interval, the proportion of positive samples is indicated below the X axis. (C) For longitudinal analysis (C), samples were taken at two (n = 12) or more (n = 5) time points, and further comparisons were made between paired samples (n = 9) at two time points ranging from 6 to 15 months (TP1: 181–300 and TP2: 301–452 days after symptoms onset) (right panel). The results were expressed as the number of spots per 300,000 seeded cells after subtracting the background spots of the negative control. The horizontal black lines indicate the median value and 95% CI of the group. The cutoff value (dashed red line) was set at the highest number of specific B cell spots for the negative controls (>12 spots/300,000 cells). The cutoff-value is not visible in some graphs because it is very close to the X axis. Mann-Whitney U test. ∗∗p ≤ 0.01, ∗∗∗p ≤ 0.001, and ∗∗∗∗p ≤ 0.0001. See also Figures S3 and S6.
Figure 6
Figure 6
Cross-sectional and longitudinal analysis of S1-specific memory T cell responses in COVID-19 patients (A–C) Dynamics of S1-specific memory IL-2, IFN-γ, and IL-2/IFN-γ-producing T cells with the corresponding second order polynomial fitting curve (in black). (D–F) T cells were measured in control (n = 11), COVID-19 samples at five study periods: 14–30 days (n = 11), 31–90 (n = 9), 91–180 days (n = 19), 181–365 (n = 28), and 366–452 (n = 6) days after symptom onset, as well as vaccine samples after first (n = 15) and second (n = 11) dose. For each time interval, the proportion of positive samples is indicated below the X axis. (G–I) For longitudinal analysis, samples were taken at two (n = 10) or more (n = 5) time points and further comparisons were made between paired samples (n = 8) at two time points ranging from 6 to 15 months (TP1: 181–300 and TP2: 301–452 days after symptoms onset; right panel). The results were expressed as the number of spots per 300,000 seeded cells after subtracting the background spots of the negative control. The horizontal black lines indicate the median value and 95% CI of the group. The cutoff value (dashed red line) was set at the highest number of specific T cell spots for the negative controls (>7 to nine spots/300,000 seeded cells depending on the T cell population). The cutoff-value is not visible in some graphs because it is very close to the X axis. Mann-Whitney U test. ∗∗p ≤ 0.01, ∗∗∗p ≤ 0.001, and ∗∗∗∗p ≤ 0.0001. See also Figures S4, S5 and S6.
Figure 7
Figure 7
Correlations between SARS-CoV-2-specific immune responses and assessment of covariates (A) Heatmap representation of the SARS-CoV-2 specific adaptive immune responses For subjects with available data on all three “arms” of adaptive immunity (serum anti-RBD IgM, IgA, IgG, and neutralization titers (NT90), the number of RBD-specific memory B cells, and the number of T cells specific for the virus protein-derived peptides pools producing IFN-γ, IL-2, or IFN-γ and IL-2 (Dual), are indicated. For each arm of immunity, the relative intensity of signals varies from no (gray), low (yellow) to high (dark green) signals. The gender, age (from 22 to 86) years), severity (from mild to critical), number of signals (1, 2, or 3), and the number of days after symptoms onset (from 22 to 446 days) are shown. (B) Heatmap showing Spearman correlations between immune parameters at each sample point with significance levels: ∗p < 0.05. The circle size and color intensity correspond to the absolute value of the Spearman rank correlation coefficient, with red or blue indicating a positive or negative correlation, respectively. NT: neutralization titers. MBC: IgG + memory B cell.

References

    1. Addetia A., Crawford K.H.D., Dingens A., Zhu H., Roychoudhury P., Huang M.L., Jerome K.R., Bloom J.D., Greninger A.L. Neutralizing antibodies correlate with protection from SARS-CoV-2 in humans during a fishery vessel outbreak with a high attack rate. J. Clin. Microbiol. 2020;58:e02107–e02120. doi: 10.1128/JCM.02107-20. - DOI - PMC - PubMed
    1. Ahmed S.F., Quadeer A.A., McKay M.R. Preliminary identification of potential vaccine targets for the COVID-19 coronavirus (SARS-CoV-2) based on SARS-CoV immunological studies. Viruses. 2020;12:254. doi: 10.3390/v12030254. - DOI - PMC - PubMed
    1. Amanat F., Stadlbauer D., Strohmeier S., Nguyen T.H.O., Chromikova V., McMahon M., Jiang K., Arunkumar G.A., Jurczyszak D., Polanco J., et al. A serological assay to detect SARS-CoV-2 seroconversion in humans. Nat. Med. 2020;26:1033–1036. doi: 10.1038/s41591-020-0913-5. - DOI - PMC - PubMed
    1. Anand S.P., Prevost J., Nayrac M., Beaudoin-Bussieres G., Benlarbi M., Gasser R., Brassard N., Laumaea A., Gong S.Y., Bourassa C., et al. Longitudinal analysis of humoral immunity against SARS-CoV-2 spike in convalescent individuals up to 8 months post-symptom onset. Cell Rep. Med. 2021;2:100290. doi: 10.1016/j.xcrm.2021.100290. - DOI - PMC - PubMed
    1. Bergwerk M., Gonen T., Lustig Y., Amit S., Lipsitch M., Cohen C., Mandelboim M., Levin E.G., Rubin C., Indenbaum V., et al. Covid-19 breakthrough infections in vaccinated health care workers. N. Engl. J. Med. 2021;385:1474–1484. doi: 10.1056/NEJMoa2109072. - DOI - PMC - PubMed