

Evolving mortality and clinical outcomes of hospitalized subjects during successive COVID-19 waves in Catalonia, Spain
- PMID: 35018339
- PMCID: PMC8739818
- DOI: 10.1016/j.gloepi.2022.100071
Evolving mortality and clinical outcomes of hospitalized subjects during successive COVID-19 waves in Catalonia, Spain
Abstract
Background: The changes in shield strategies, treatments, emergence variants, and healthcare pathways might shift the profile and outcome of patients hospitalized with COVID-19 in successive waves of the outbreak.
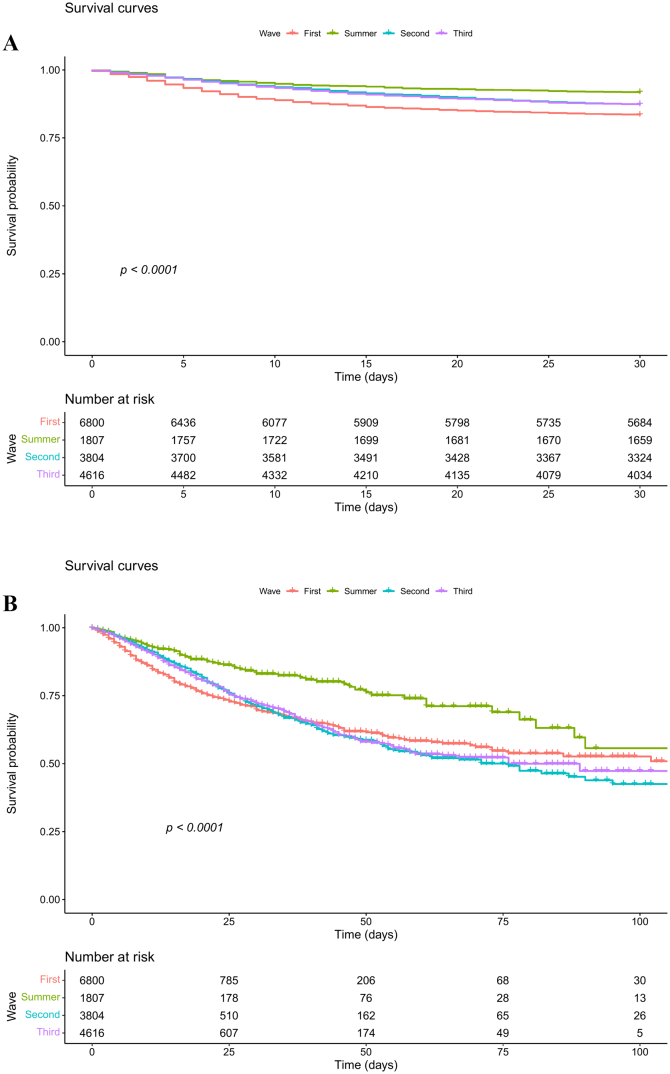
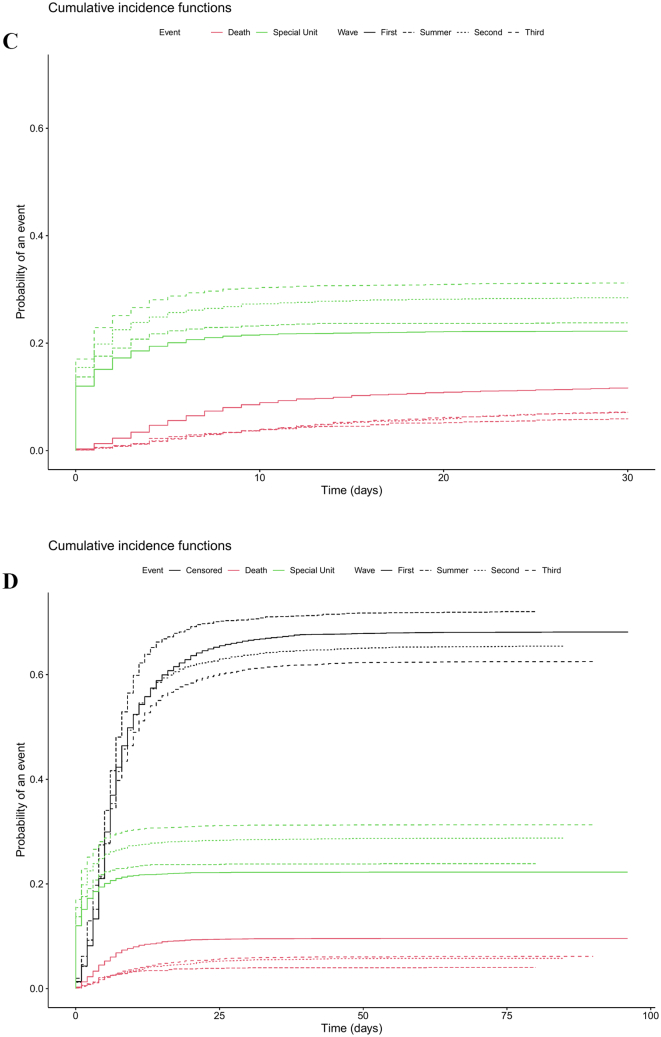
Methods: We retrospectively analysed the characteristics and in-hospital outcomes of all patients admitted with COVID-19 in eight university hospitals of Catalonia (North-East Spain) between Feb 28, 2020 and Feb 28, 2021. Using a 7-joinpoint regression analysis, we split admissions into four waves. The main hospital outcomes included 30-day mortality and admission to intensive care unit (ICU).
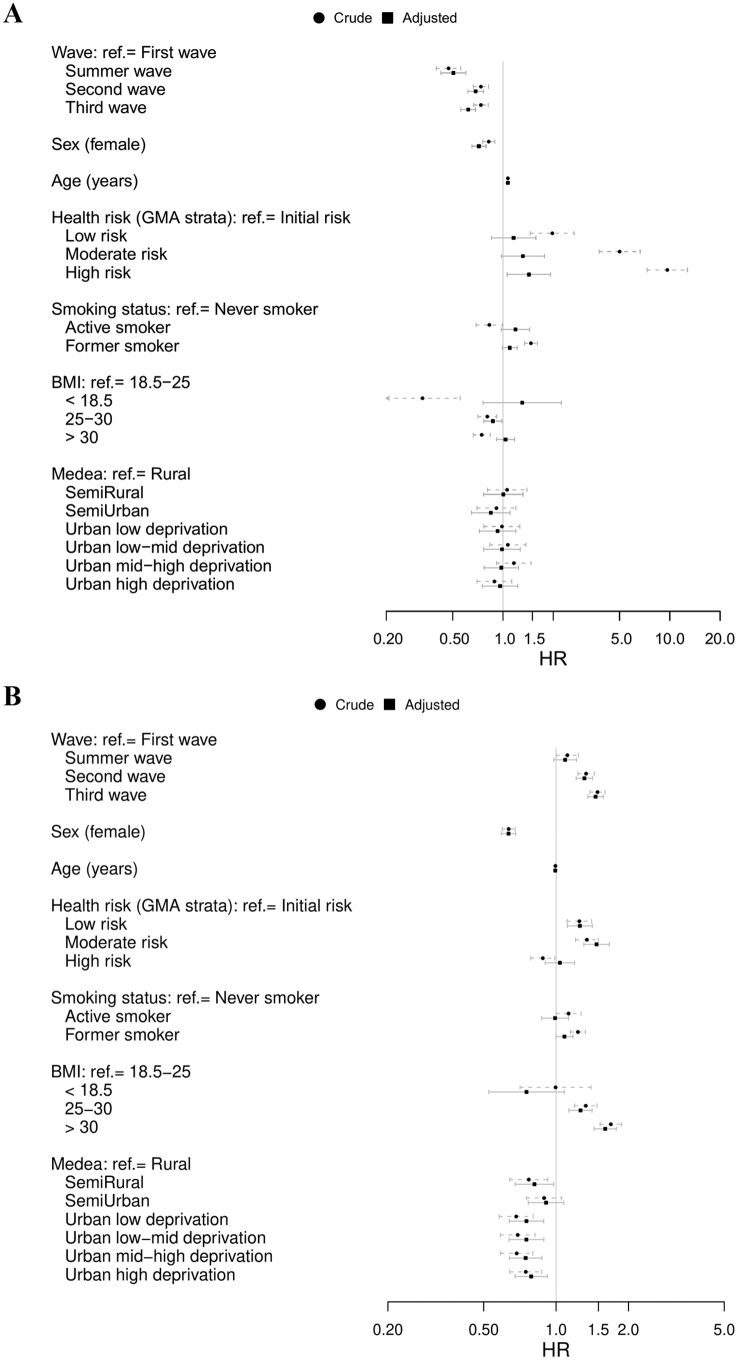
Findings: The analysis included 17,027 subjects admitted during the first wave (6800; 39.9%), summer wave (1807; 10.6%), second wave (3804; 22.3%), and third wave (4616; 27.1%). The highest 30-day mortality rate was reported during the first wave (17%) and decreased afterwards, remaining stable at 13% in the second and third waves (overall 30% reduction); the lowest mortality was reported during the summer wave (8%, 50% reduction). ICU admission became progressively more frequent during successive waves. In Cox regression analysis, the main factors contributing to differences in 30-day mortality were the epidemic wave, followed by gender, age, diabetes, chronic kidney disease, and neoplasms.
Interpretation: Although in-hospital COVID-19 mortality remains high, it decreased substantially after the first wave and is highly dependent of patient's characteristics and ICU availability. Highest mortality reductions occurred during a wave characterized by younger individuals, an increasingly frequent scenario as vaccination campaigns progress.
Funding: This work did not receive specific funding.
Keywords: Clinical characteristics; Coronavirus disease 2019 (Covid-19); Hospital mortality; Risk factors; Socioeconomic characteristics.
© 2022 Published by Elsevier Inc.
Conflict of interest statement
KK is a member of the UK Scientific Advisory Group for Emergencies. The rest of the authors have no conflicts of interest to declare.
Figures

References
-
- European Centre for Disease Prevention and Control (ECDC) Covid-19 Situation Dashboard. https://qap.ecdc.europa.eu/public/extensions/COVID-19/COVID-19.html [Internet] [cited 2020 Aug 12]. Available from:
-
- Flaxman S. Estimating the effects of non-pharmaceutical interventions on COVID-19 in Europe. Nature [Internet] 2020;584:257–261. doi: 10.1038/s41586-020-2405-7. https://pubmed.ncbi.nlm.nih.gov/32512579/ [cited 2020 Aug 12]; Available from: - DOI - PubMed
-
- Nafilyan V. Ethnic differences in COVID-19 mortality during the first two waves of the coronavirus pandemic: a nationwide cohort study of 29 million adults in England. medRxiv [Internet] 2021 Feb 5 doi: 10.1101/2021.02.03.21251004. [cited 2021 Apr 16];2021.02.03.21251004. Available from. - DOI - PMC - PubMed
-
- World Health Organization WHO Coronavirus (COVID-19) Dashboard. https://covid19.who.int/ [Internet]. [cited 2021 Apr 16]. Available from:
-
- Bachmann M.F. SARS-CoV-2 structural features may explain limited neutralizing-antibody responses. npj Vaccines. 2021 Dec 1;6(1):1–4. https://pubmed.ncbi.nlm.nih.gov/33398006/ [Internet]. [cited 2021 Feb 5]. Available from: - PMC - PubMed
LinkOut - more resources
Full Text Sources
