. 2022 Jan 25;50(2):1092-1110.
doi: 10.1093/nar/gkab1261.

Determinants of the temperature adaptation of mRNA degradation

Affiliations

Determinants of the temperature adaptation of mRNA degradation

Vincent Jaquet et al. Nucleic Acids Res. .

Abstract

The rate of chemical reactions increases proportionally with temperature, but the interplay of biochemical reactions permits deviations from this relation and adaptation. The degradation of individual mRNAs in yeast increased to varying degrees with temperature. We examined how these variations are influenced by the translation and codon composition of mRNAs. We developed a method that revealed the existence of a neutral half-life above which mRNAs are stabilized by translation but below which they are destabilized. The proportion of these two mRNA subpopulations remained relatively constant under different conditions, even with slow cell growth due to nutrient limitation, but heat shock reduced the proportion of translationally stabilized mRNAs. At the same time, the degradation of these mRNAs was partially temperature-compensated through Upf1, the mediator of nonsense-mediated decay. Compensation was also promoted by some asparagine and serine codons, whereas tyrosine codons promote temperature sensitization. These codons play an important role in the degradation of mRNAs encoding key cell membrane and cell wall proteins, which promote cell integrity.


Figures

Figure 1.
Figure 1.
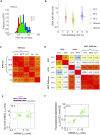
Dependence of mRNA half-lives on temperature, carbon source and translation. (A and B) The cells were grown in 2% raffinose at 20°C (N= 75), 30°C (N = 78) or 42°C (N = 75), or in 2% glucose (N = 67), and 3% glycerol (n = 69) at 30°C. The representative set of mRNAs are encoded by genes in the II (YBR) and XIII (YML) chromosomes (Materials and Methods). The distribution of half-lives (A). The half-lives plotted against cell doubling time (mean and standard error from three replicate measurements of the BY4743 strain); the time series of culture density measured over 6 h was used to fit the doubling time by linear regression (B). (C) The Spearman’s rank correlation (rS) between the half-lives of the mRNAs in different culturing conditions (data as in A). (D) The rS between the half-lives of mRNAs present in all datasets (N = 82). The median half-lives (N = 82) are 23.1 min (GRO, 25°C), 27.7 min (GRO, 37°C), 13.3 min (cDTA, 30°C) and 20.6 min (37°C). The GRO 37°C half-lives were calculated from the mRNA amounts and transcription rates measured 40 min after the heat shock. (E) The no-ATG genes were constructed by converting all ATG triplets into TAG within the ORF and UTRs (diagram). The half-lives of the set of stable and unstable mRNAs and their no-AUG counterparts in cells grown at 20°C. The dashed lines indicate the position of the lowest and highest deciles (1.5 and 17.1 min for the set of stable and unstable mRNAs and 3.5 and 8.2 min for the no-AUG counterparts). (F) The translational stabilization is the ratio of the half-lives of normal (AUG) to that of no-AUG mRNAs. The domains of stabilization (ratio > 1) and destabilization (ratio < 1) are separated by a thick gray line (ratio = 1, no effect of translation). Data identical to those shown in (E).
Figure 2.
Figure 2.
Cellular distribution and the decapping of AUG and no-AUG RNAs. (A) smFISH images showing the cellular distribution of the TSL1 mRNA with and without AUG in cells grown at 30°C; scale bar, 5 μm. (B) Cells grown at 42°C; in addition to the RNA molecules (red) and DAPI stained nuclear and mitochondrial DNA (blue), the background fluorescence is shown (green). The intense background fluorescence (green) indicates dead cells. (C) Number of RNA molecules in the cytoplasm and nucleus at 30°C, 42 °C after 30 min or overnight (ON) incubation. The data for each condition are combined from two or three biological replicates. The boxes and whiskers denote the 25th to 75th and the 10th to 90th percentiles, respectively. The Δtsl1 cells hybridized to the TSL1 (AUG) and no-AUG TSL1 probes serve as negative controls. The distribution of number of RNA molecules was obtained from N cells: N(Δtsl1, AUG probe) = 87, N(Δtsl1, noAUG probe) = 254, N(AUG, 30°C) = 558, N(AUG, 42°C 30 min) = 472, N(AUG, 42°C ON) = 343, N(noAUG, 30°C) = 239, N(noAUG, 42°C, 30 min) = 777, N(noAUG, 42°C ON) = 270. (D) The signal-to-noise ratio of the SL-qPCR assay (see Materials and Methods for the definition). Endo: endogenous genes, Δxrn1: endogenous mRNAs in Δxrn1 cells, WT(MGC): 4 silent mutations in ORF, same construct as the one used to determine decay rate. (E) Percentage of decapped mRNA measured with the SL-qPCR assay. Error bars: standard error (n = 3).
Figure 3.
Figure 3.
Global effect of temperature on the turnover of translated mRNAs. (A) The half-life of the mRNA with and without AUG codons in cells grown in raffinose at 30°C or 42°C. The neutral point denotes the mean no-AUG half-life (horizontal line in the left panel). The right panels indicate the probability density functions fitted to the half-lives of the representative mRNA set. (B) The percentage of stabilized mRNAs and the location of the neutral point in different growth conditions (5.5, 3.3 and 4.0 min for raffinose at 20°, 30°C and 42°C; 3.9 and 4.2 min for glucose and glycerol, respectively). The error bars represent the standard error obtained by bootstrapping.
Figure 4.
Figure 4.
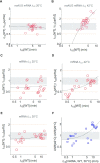
The half-lives of mRNAs and their no-AUG counterparts in upf1Δ cells. The half-life (t1/2) of the set of stable and unstable mRNAs and their no-AUG counterparts was measured in WT and upf1Δ cells. The Upf1 stabilization ratio (USR = t1/2[WT]/ t1/2[upf1Δ]) reflects how the deletion of UPF1 affects the half-life. A USR larger and less than one indicates stabilization and destabilization by UPF1, respectively. The gray band denotes a neutral ratio, USR= 1 and the thin solid lines denote twofold stabilization and destabilization by UPF1. The black dashed line is obtained with linear regression, which appears curved in the logarithmic plots. GM(USR) is the geometric mean of the USRs. The rS and the associated P-value (P) are calculated for the two displayed variables. (A) no-AUG mRNAs at 20°C. GM(USR) = 0.92 (N = 25); rS = −0.09, (P = 0.67). (B) no-AUG mRNAs at 42°C. GM(USR) = 1.48 (N = 24); rS = 0.82 (P = 4.6·10–7). (C) mRNAs at 20°C. GM(USR) = 0.66 (N = 23); rS = 0.09 (P = 0.69). (D) mRNAs at 42°C. GM(USR) = 0.74 (N = 23); rS = 0.73 (P = 7.9·10–5). The interdecile ratio is reduced from 12 in WT cells to 4.9 in upf1Δ cells. (E) mRNAs at 30°C. GM(USR) = 0.90 (N = 23); rS = 0.50 (P = 0.014). (F) The USR(42°C) : USR(20°C) ratio calculated for mRNAs. rS = 0.77 (P = 3.8·10–5).
Figure 5.
Figure 5.
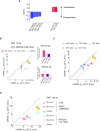
Codon-dependence of temperature adaptation in RNA degradation. (A) The dtCSC values calculated based on the representative and stable-unstable mRNA sets (N= 95). P-values are given for the corresponding Spearman rank correlation due to the deviation from normality: Asn(AAC) 0.0003; Tyr(TAT) 0.006; Leu(CTT) 0.010; Ser(TCC) 0.014, Ser(TCT) 0.016 and Ser(TCA) 0.038. Associations having P-values <0.01 are indicated by thick edges. (B) The half-lives of the mRNAs expressed from synthetic genes comprise 15 amino acids between the start and stop codons. The bar plots show the composition of the two Ser/Asn-rich genes, consisting of three (C3) and four (C4) different codons. The control gene (star) contains three copies of each of the following codons, with the dtCSC given in parenthesis: GAA (Glu, 0.03), GCA (Ala, 0.19); GGA, GGC and GGT (Gly; 0.15, 0.1 and 0.07). The error bars indicate standard errors (n = 3 independent experiments). The regression lines (dashed lines flanking the double-headed arrow) are calculated for the constructs with the largest difference in the half-lives. The temperature compensation of the SN-rich C3 mRNAs relative to the control (the ratio of the slopes of the dashed lines) is 1.87. (C) The half-lives of the mRNAs expressed from synthetic genes encode 14 identical amino acids and a methionine (start codon). The error bars indicate standard errors (n = 3 independent experiments). (D) The half-lives of mRNAs expressed from synthetic genes encoding 100 amino acids long proteins were inserted between the NRG2 or RPS22A UTRs. The error bars indicate standard errors (n = 3).
Figure 6.
Figure 6.
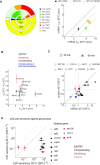
Functional relevance of enrichment of mRNAs in Asn and Ser codons. (A) The role of Asn, Ser and Tyr codons in the temperature compensation of the MTL1 mRNA degradation. The codon composition of the Asn/Ser-rich (NS), WT and Tyr-rich (Y) sequences are shown in the pie charts. The NoSP denotes the construct with no signal peptide sequence. The error bars denote standard errors calculated from three biological replicates. The P-values were calculated for the log ratios of the half-life measured at 20 to that at 42°C for the t-test: P = 0.028 for MTL1(NS) versus (Y) and P = 0.013 for MTL1(NS) vs (Y, No SP). Using Mann–Whitney yields P = 0.029 for both pairs. (B) The ratio of half-lives measured at 20 and 42°C (standard error, n = 3) for the mRNAs enriched in temperature-compensating or temperature-sensitizing codons. The mRNAs are marked with multiple stop codons. The temperature-compensating mRNAs encoding genes responsible for the resistance against zymolyase are shown in dark blue. (C) Fold change of protein and mRNA levels measured at 20 versus 42°C (n = 3 replicates). Proteins were measured 3 h after shifting the temperature to 42°C, whereas the corresponding mRNAs were measured at 30 (empty symbols) and 90 (full symbols) min after the shift. Each gene is denoted by an empty and full symbol, which refer to the same protein measurement. This timing allows the typically slowly degrading proteins to integrate rapid changes in the amount of mRNA over the previous period. The thick gray line denotes equal change of protein and mRNA levels, which indicates that translation remains constant provided the protein half-life and transcription do not change. (D) The cell wall (CW) sensitivity against glycosidases (zymolyase rate index, ZRI) for cells in which the indicated genes are deleted. The full gray line indicates the same sensitivity at 30 and 42°C. The upper and lower gray dashed lines denote 10 times higher and lower sensitivity at 42°C, respectively. The Δgal2 and Δgal3 cells were used as control deletions (gray). The error bars denote the standard error from n = 3 biological replicates for cells grown at 30°C, and n = 5 at 42°C. Significant differences (Mann–Whitney) relative to the control cells (Δgal2, Δgal3) were found for Δecm33 (P = 0.006, 0.012), Δost4 (P = 0.006) and Δqcr6 (P = 0.012) cells at 42°C. For Δgat1 P = 0.006 (vs Δgal2) and 0.094 (vs Δgal3).
Figure 7.
Figure 7.
Scheme of the extrinsic and intrinsic determinants of the temperature adaptation of mRNA degradation. (A) Extrinsic determinants. Translation stabilizes mRNAs with a half-life greater than the neural half-life but below that destabilizes them. The gradient arrows indicate processes associated with a shift from low to high temperature. Heat shock reduces the proportion of translationally stabilized mRNAs indirectly because Upf1 increases the neutral half-life. At the same time, the increase in temperature buffers the destabilizing activity of Upf1 against some of the translationally stabilized mRNAs (cross). Consequently, the degradation of mRNAs is partially temperature compensated. (B) Codons are the intrinsic determinants of mRNAs temperature adaptation. Most codons do not change their stabilizing effect significantly upon temperature shift (gray arrows). However, specific Asn and Ser codons buffer the increase in the mRNA degradation rate as the temperature rises (compensation, bent horizontal arrow). On the other hand, a Tyr codon amplifies the temperature-induced change in mRNA stability (sensitization, bent vertical arrow).

References

    1. Alster C.J., Fischer J.C., Allison S.D., Treseder K.K.. Embracing a new paradigm for temperature sensitivity of soil microbes. Glob. Chang. Biol. 2020; 26:3221–3229. - PubMed
    1. Kortmann J., Narberhaus F.. Bacterial RNA thermometers: molecular zippers and switches. Nat. Rev. Microbiol. 2012; 10:255–265. - PubMed
    1. Tomita J., Nakajima M., Kondo T., Iwasaki H.. No transcription-translation feedback in circadian rhythm of KaiC phosphorylation. Science. 2005; 307:251–254. - PubMed
    1. Robertson R.M., Money T.G.. Temperature and neuronal circuit function: compensation, tuning and tolerance. Curr. Opin. Neurobiol. 2012; 22:724–734. - PubMed
    1. Irvine S.Q. Embryonic canalization and its limits-A view from temperature. J. Exp. Zool. B Mol. Dev. Evol. 2020; 334:128–144. - PubMed

Publication types

MeSH terms