

DWI-related texture analysis for prostate cancer: differences in correlation with histological aggressiveness and data repeatability between peripheral and transition zones
- PMID: 35018507
- PMCID: PMC8752657
- DOI: 10.1186/s41747-021-00252-y
DWI-related texture analysis for prostate cancer: differences in correlation with histological aggressiveness and data repeatability between peripheral and transition zones
Erratum in
-
Correction: DWI-related texture analysis for prostate cancer: differences in correlation with histological aggressiveness and data repeatability between peripheral and transition zones.Eur Radiol Exp. 2022 Mar 23;6(1):16. doi: 10.1186/s41747-022-00268-y. Eur Radiol Exp. 2022. PMID: 35318550 Free PMC article. No abstract available.
Abstract
Background: We investigated the correlation between texture features extracted from apparent diffusion coefficient (ADC) maps or diffusion-weighted images (DWIs), and grade group (GG) in the prostate peripheral zone (PZ) and transition zone (TZ), and assessed reliability in repeated examinations.
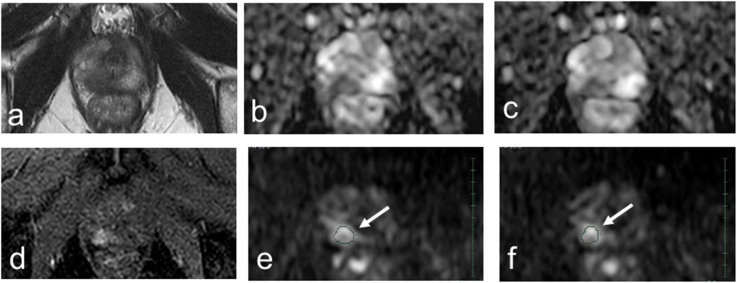
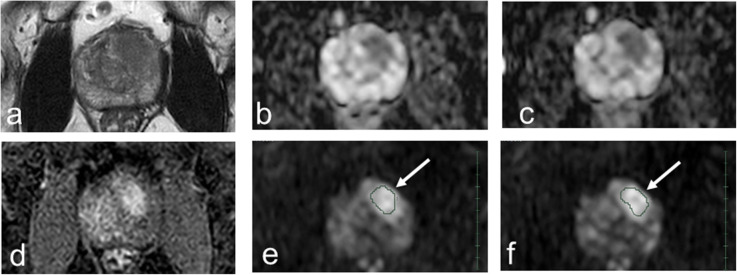
Methods: Patients underwent 3-T pelvic magnetic resonance imaging (MRI) before radical prostatectomy with repeated DWI using b-values of 0, 100, 1,000, and 1,500 s/mm2. Region of interest (ROI) for cancer was assigned to the first and second DWI acquisition separately. Texture features of ROIs were extracted from comma-separated values (CSV) data of ADC maps generated from several sets of two b-value combinations and DWIs, and correlation with GG, discrimination ability between GG of 1-2 versus 3-5, and data repeatability were evaluated in PZ and TZ.
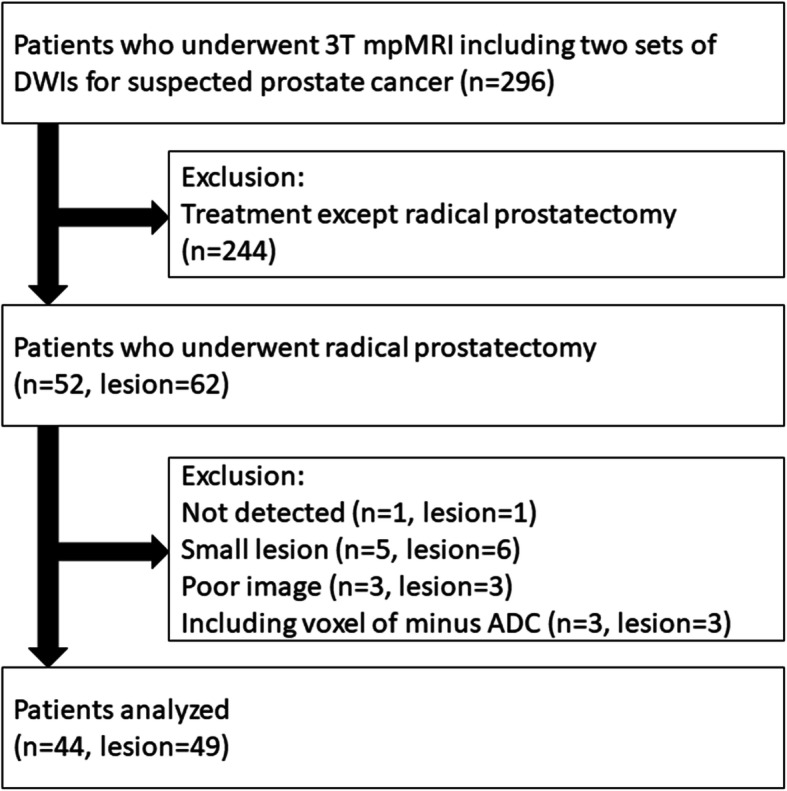
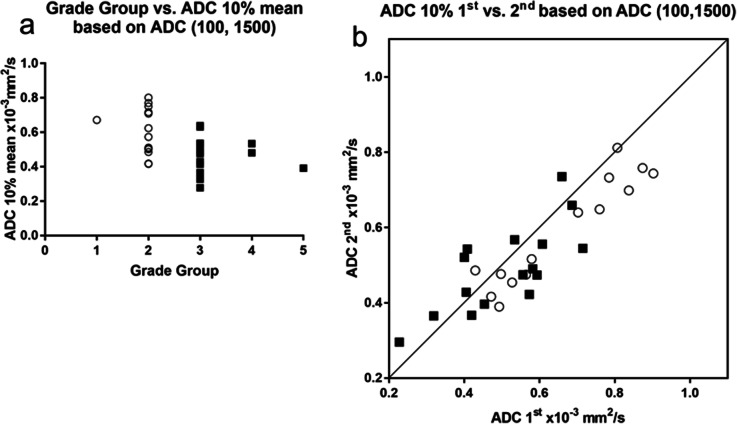
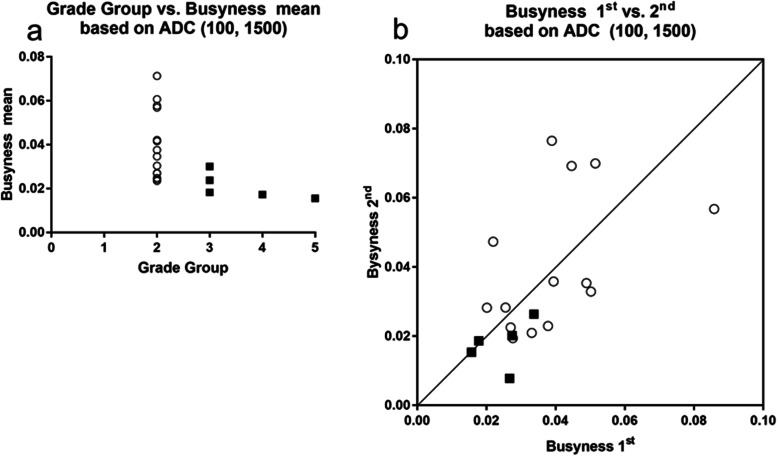
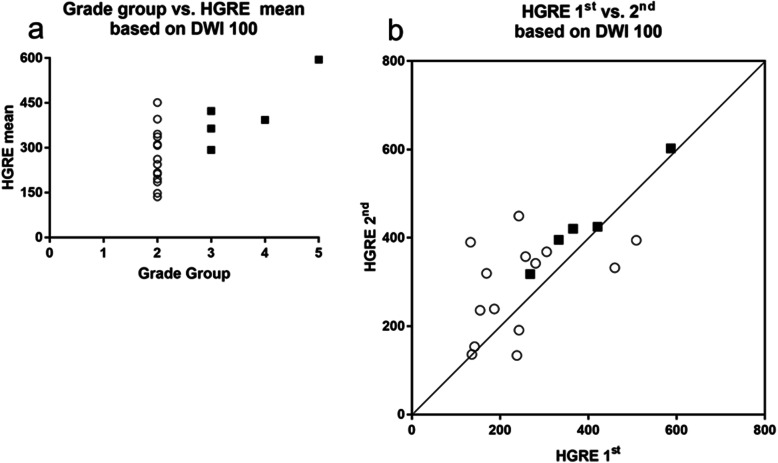
Results: Forty-four patients with 49 prostate cancers met the eligibility criteria. In PZ, ADC 10% and 25% based on ADC map of two b-value combinations of 100 and 1,500 s/mm2 and 10% based on ADC map with b-value of 0 and 1,500 s/mm2 showed significant correlation with GG, acceptable discrimination ability, and good repeatability. In TZ, higher-order texture feature of busyness extracted from ADC map of 100 and 1,500 s/mm2, and high gray-level run emphasis, short-run high gray-level emphasis, and high gray-level zone emphasis from DWI with b-value of 100 s/mm2 demonstrated significant correlation, excellent discrimination ability, but moderate repeatability.
Conclusions: Some DWI-related features showed significant correlation with GG, acceptable to excellent discrimination ability, and moderate to good data repeatability in prostate cancer, and differed between PZ and TZ.
Keywords: Diffusion magnetic resonance imaging; Image interpretation (computer-assisted); Neoplasm grading; Prostate neoplasms; Reproducibility of results.
© 2022. The Author(s) under exclusive licence to European Society of Radiology.
Conflict of interest statement
The authors declare that they have no competing interests.
Figures
Similar articles
-
Evaluation of Weighted Diffusion Subtraction for Detection of Clinically Significant Prostate Cancer.J Magn Reson Imaging. 2021 Dec;54(6):1979-1988. doi: 10.1002/jmri.27771. Epub 2021 Jun 4. J Magn Reson Imaging. 2021. PMID: 34085328
-
Test-retest repeatability of ADC in prostate using the multi b-Value VERDICT acquisition.Eur J Radiol. 2023 May;162:110782. doi: 10.1016/j.ejrad.2023.110782. Epub 2023 Mar 16. Eur J Radiol. 2023. PMID: 37004362 Free PMC article.
-
Quantified analysis of histological components and architectural patterns of gleason grades in apparent diffusion coefficient restricted areas upon diffusion weighted MRI for peripheral or transition zone cancer locations.J Magn Reson Imaging. 2017 Dec;46(6):1786-1796. doi: 10.1002/jmri.25716. Epub 2017 Apr 6. J Magn Reson Imaging. 2017. PMID: 28383776
-
Haralick texture analysis of prostate MRI: utility for differentiating non-cancerous prostate from prostate cancer and differentiating prostate cancers with different Gleason scores.Eur Radiol. 2015 Oct;25(10):2840-50. doi: 10.1007/s00330-015-3701-8. Epub 2015 May 21. Eur Radiol. 2015. PMID: 25991476 Free PMC article.
-
Evaluation of Diffusion Kurtosis Imaging Versus Standard Diffusion Imaging for Detection and Grading of Peripheral Zone Prostate Cancer.Invest Radiol. 2015 Aug;50(8):483-9. doi: 10.1097/RLI.0000000000000155. Invest Radiol. 2015. PMID: 25867657
Cited by
-
Association between mpMRI detected tumor apparent diffusion coefficient and 5-year biochemical recurrence risk after radical prostatectomy.Radiol Med. 2024 Sep;129(9):1394-1404. doi: 10.1007/s11547-024-01857-0. Epub 2024 Jul 16. Radiol Med. 2024. PMID: 39014292
-
Multiparametric Magnetic Resonance Imaging Grades the Aggressiveness of Prostate Cancer.Cancers (Basel). 2022 Apr 5;14(7):1828. doi: 10.3390/cancers14071828. Cancers (Basel). 2022. PMID: 35406600 Free PMC article.
-
Deep Learning Framework with Multi-Head Dilated Encoders for Enhanced Segmentation of Cervical Cancer on Multiparametric Magnetic Resonance Imaging.Diagnostics (Basel). 2023 Nov 3;13(21):3381. doi: 10.3390/diagnostics13213381. Diagnostics (Basel). 2023. PMID: 37958277 Free PMC article.
-
Delta-radiomics features of ADC maps as early predictors of treatment response in lung cancer.Insights Imaging. 2024 Aug 26;15(1):218. doi: 10.1186/s13244-024-01787-5. Insights Imaging. 2024. PMID: 39186132 Free PMC article.
References
-
- Lubner MG, Smith AD, Sandrasegaran K, Sahani DV, Pickhardt PJ (2017) CT texture analysis: definitions, applications, biologic correlates, and challenges. Radiographics 37:1483–1503 https://pubs.rsna.org/doi/10.1148/rg.2017170056 - DOI - PubMed
-
- Schieda N, Lim CS, Zabihollahy F, et al (2021) Quantitative prostate MRI. J Magn Reson Imaging 53:1632─1645. 10.1002/jmri.27191 - PubMed
-
- Lovinfosse P, Polus M, Van Daele D, et al (2018) FDG PET/CT radiomics for predicting the outcome of locally advanced rectal cancer. Eur J Nucl Med Mol Imaging 45:365─375. 10.1007/s00259-017-3855-5 - PubMed
-
- Varghese BA, Cen SY, Hwang DH, Duddalwar VA (2019) Texture Analysis of Imaging: What Radiologists Need to Know. AJR Am J Roentgenol 212:520─528. https://www.ajronline.org/doi/10.2214/AJR.18.20624 - DOI - PubMed
MeSH terms
LinkOut - more resources
Full Text Sources
Medical
Miscellaneous