Valuation and Returns of Drug Development Companies: Lessons for Bioentrepreneurs and Investors
- PMID: 35018622
- PMCID: PMC8854317
- DOI: 10.1007/s43441-021-00364-y
Valuation and Returns of Drug Development Companies: Lessons for Bioentrepreneurs and Investors
Abstract
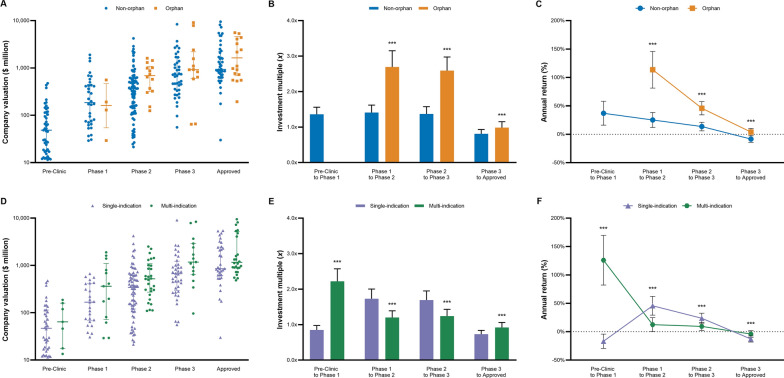
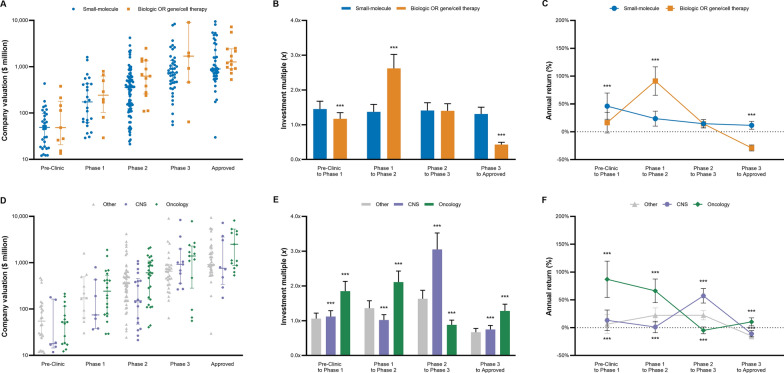
Objectives: This study evaluates the association of Biopharma company valuation with the lead drug's development stage, orphan status, number of indications, and disease area. We also estimated annual returns Bioentrepreneurs and investors can expect from founding and investing in drug development ventures.
Methods: SDC Thomson Reuter and S&P Capital IQ were screened for majority acquisitions of US and EU Biopharma companies developing new molecular entities for prescription use (SIC code: 2834). Acquisition data were complemented with drug characteristics extracted from clinicaltrials.gov, the US Food and Drug Administration (FDA), and deal announcements. Thereafter, company valuations were combined with previously published clinical development periods alongside orphan-, indication-, and disease-specific success rates to estimate annual returns for investments in drug developing companies.
Results: Based on a sample of 311 Biopharma acquisitions from 2005 to 2020, companies developing orphan, multi-indication, and oncology drugs were valued significantly higher than their peers during later development stages (p < 0.05). We also estimated significantly higher returns for shareholders of companies with orphan relative to non-orphan-designated lead drugs from Phase 1 to FDA approval (46% vs. 12%, p < 0.001). Drugs developed across multiple indications also provided higher returns than single-indication agents from Pre-Clinic to FDA approval (21% vs. 11%, p < 0.001). Returns for oncology drugs exceeded other disease areas (26% vs. 8%, p < 0.001).
Conclusions: Clinical and economic conditions surrounding orphan-designated drugs translate to a favorable financial risk-return profile for Bioentrepreneurs and investors. Bioentrepreneurs must be aware of the upside real option value their multi-indication drug could offer when negotiating acquisition or licensing agreements.
Keywords: Drug development; Investment; Multi-indication; Oncology; Orphan; Valuation.
© 2022. The Author(s).
Conflict of interest statement
The authors declare no conflict of interest.
Figures
References
-
- Bansal R, De Backer R, Ranade V. What’s behind the pharmaceutical sector’s M&A push. 2018.
-
- Meyers AD, Hurley P. Bioentrepreneurship education programmes in the United States. J Commer Biotechnol. 2008;14:2–12. doi: 10.1057/palgrave.jcb.3050078. - DOI
-
- Lavrynenko A, Shmatko N, Meissner D. Managing skills for open innovation: the case of biotechnology. Manag Decis. 2018 doi: 10.1108/MD-04-2017-0301. - DOI
Publication types
MeSH terms
LinkOut - more resources
Full Text Sources