. 2022 Feb;55(2):e13178.
doi: 10.1111/cpr.13178. Epub 2022 Jan 11.

Alkbh1-mediated DNA N6-methyladenine modification regulates bone marrow mesenchymal stem cell fate during skeletal aging

Affiliations

Alkbh1-mediated DNA N6-methyladenine modification regulates bone marrow mesenchymal stem cell fate during skeletal aging

Guang-Ping Cai et al. Cell Prolif. 2022 Feb.

Abstract

Objectives: DNA N6-methyladenine (N6-mA) demethylase Alkbh1 participates in regulating osteogenic differentiation of mesenchymal stem cell (MSCs) and vascular calcification. However, the role of Alkbh1 in bone metabolism remains unclear.

Materials and methods: Bone marrow mesenchymal stem cells (BMSCs)-specific Alkbh1 knockout mice were used to investigate the role of Alkbh1 in bone metabolism. Western blot, qRT-PCR, and immunofluorescent staining were used to evaluate the expression of Alkbh1 or optineurin (optn). Micro-CT, histomorphometric analysis, and calcein double-labeling assay were used to evaluate bone phenotypes. Cell staining and qRT-PCR were used to evaluate the osteogenic or adipogenic differentiation of BMSCs. Dot blotting was used to detect the level of N6-mA in genomic DNA. Chromatin immunoprecipitation (Chip) assays were used to identify critical targets of Alkbh1. Alkbh1 adeno-associated virus was used to overexpress Alkbh1 in aged mice.

Results: Alkbh1 expression in BMSCs declined during aging. Knockout of Alkbh1 promoted adipogenic differentiation of BMSCs while inhibited osteogenic differentiation. BMSC-specific Alkbh1 knockout mice exhibited reduced bone mass and increased marrow adiposity. Mechanistically, we identified optn as the downstream target through which Alkbh1-mediated DNA m6A modification regulated BMSCs fate. Overexpression of Alkbh1 attenuated bone loss and marrow fat accumulation in aged mice.

Conclusions: Our findings demonstrated that Alkbh1 regulated BMSCs fate and bone-fat balance during skeletal aging and provided a potential target for the treatment of osteoporosis.

Keywords: Alkbh1; BMSCs; aging; epigenetic; osteoporosis.


Conflict of interest statement

The authors declare that they have no conflict of interest.

Figures
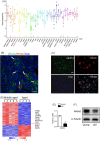
FIGURE 1
FIGURE 1
Alkbh1 expression in BMSCs declines during aging. (A) Alkbh1 expression pattern in 31 human normal tissues from GTEx. (B) Immunofluorescence reveals colocalization of Aklbh1 (green) and nestin (red) in bone marrow of 3‐month‐old mice. Scale bar: 50 μm. (C) Immunofluorescence shows overlapping of Aklbh1 (green) and nestin (red) in cultured bone marrow cells. Scale bar: 100 μm. (D) Heatmap of top 500 DEGs in microarray data (GSE35955). (E and F) qRT‐PCR (E) and western blot (F) analysis of Alkbh1 expression in BMSCs from young (3‐month‐old) and old (18‐month‐old) mice (n = 3). Data are presented as mean ± SEM. ***p < 0.001, Student's t test
FIGURE 2
FIGURE 2
Deletion of Alkbh1 in BMSCs results in impaired osteogenic and enhanced adipogenic differentiation. (A) Representative images of PCR genotyping of transgenic mice. (B and C) qRT‐PCR (B) and western blot (C) analysis of Alkbh1 expression in BMSCs from Prx1‐Cre; Alkbh1fl/fl and Alkbh1fl/fl mice (n = 3). (D) Representative images and quantification of ARS and ALP staining of BMSCs from Prx1‐Cre; Alkbh1fl/fl and Alkbh1fl/fl mice under osteogenic differentiation (n = 3). (E–H) qRT‐PCR analysis reveals decreased transcription of Runx2, ALP, SP7, and Bglap in BMSCs from Prx1‐Cre; Alkbh1fl/fl mice under osteogenic differentiation (n = 3). (I) Representative images and quantification of oil red O staining of BMSCs from Prx1‐Cre; Alkbh1fl/fl and Alkbh1fl/fl mice under adipogenic differentiation (n = 3). Scale bar: 50 μm. (J and K) qRT‐PCR analysis reveals increased transcription of Pparg and Fabp4 in BMSCs from Prx1‐Cre; Alkbh1fl/fl mice under adipogenic differentiation (n = 3). Data are presented as mean ± SEM. *p < 0.05; **p < 0.01; ***p < 0.001, Student's t test
FIGURE 3
FIGURE 3
Knockout of Alkbh1 in BMSCs results in reduced bone mass and increased marrow adiposity. (A–E) Representative μCT images and quantitative analysis of femurs from 3‐month‐old and 15‐month‐old male mice (n = 6–8). (F and G) Representative images of HE staining (F) and quantification (G) of the number of adipocytes in femoral (n = 5). Scale bar: 100 μm. (H and I) Representative images of immunohistochemical staining (H) and quantitative analysis (I) of osteocalcin‐positive cells in femora (n = 5). Scale bar: 50 μm. (J and K) Representative images of calcein double labeling of trabecular bone (J) and quantitative analysis of MAR (K) (n = 5). Scale bar: 20 μm. Data are presented as mean ± SEM. *p < 0.05; **p < 0.01; ***p < 0.001, Student's t test
FIGURE 4
FIGURE 4
Loss of Alkbh1 inhibits the transcription of optineurin. (A) Immunofluorescence reveals that Alkbh1 protein predominantly localizes in the nucleus of mouse BMSCs. DAPI is blue, Aklbh1 is green, and nestin is red. Scale bar: 25 μm. (B) Dot blot analysis shows increased genomic DNA 6mA levels in BMSCs from Prx1‐Cre; Alkbh1fl/fl mice. (C) Heatmap of selected genes associated with BMSCs differentiation (GSE30561). (D) ChIP‐seq profile shows Alkbh1‐Flag ChIP‐seq enrichments at the optn promoter region. (E) ChIP‐qPCR for Flag. Alkbh1‐Flag binds to optn promoter region (n = 3). (F) ChIP‐qPCR for N6‐mA. Knockout of Alkbh1 increases N6‐mA enrichment on optn promoter region (n = 3). (G and H) qRT‐PCR (G) and western blot (H) analysis of optn expression (n = 3). Data are presented as mean ± SEM. *p < 0.05, Student's t test
FIGURE 5
FIGURE 5
Overexpression of optn rescues the abnormal lineage allocation of Alkbh1 knockout BMSCs. (A) Western blot analysis of optn and Alkbh1. (B and C) Representative images (B) and quantification (C) of ARS and ALP staining (n = 3). (D–G) qRT‐PCR analysis of the transcription of Runx2, ALP, SP7, and Bglap in BMSCs under osteogenic differentiation (n = 3). (H) Representative images and quantification of oil red O staining of BMSCs under adipogenic differentiation (n = 3). Scale bar: 50 μm. (I and J) qRT‐PCR analysis the transcription of Pparg and Fabp4 in BMSCs under adipogenic differentiation (n = 3). Data are presented as mean ± SEM. *p < 0.05; **p < 0.01; ***p < 0.001, one‐way ANOVA
FIGURE 6
FIGURE 6
Overexpression of Alkbh1 attenuates bone loss and marrow fat accumulation in aged mice. (A and B) qRT‐PCR (A) and western blot (B) analysis of Alkbh1 expression (n = 3). (C–G) Representative μCT images and quantitative analysis of distal femurs (n = 5). (H and I) Representative images of HE staining (H) and quantification (I) of the number of adipocytes in femoral (n = 5). Scale bar: 100 μm. (J and K) Representative images of immunohistochemical staining (J) and quantitative analysis (K) of osteocalcin‐positive cells in femora (n = 5). Scale bar: 50 μm. (L and M) Representative images of calcein double labeling of trabecular bone (L) and quantitative analysis of MAR (M) (n = 5). Scale bar: 20 μm. Data are presented as mean ± SEM. *p < 0.05; **p < 0.01, Student's t test

References

    1. Shen W, Chen J, Gantz M, et al. MRI‐measured pelvic bone marrow adipose tissue is inversely related to DXA‐measured bone mineral in younger and older adults. Eur J Clin Nutr. 2012;66(9):983‐988. - PMC - PubMed
    1. Verma S, Rajaratnam JH, Denton J, Hoyland JA, Byers RJ. Adipocytic proportion of bone marrow is inversely related to bone formation in osteoporosis. J Clin Pathol. 2002;55(9):693‐698. - PMC - PubMed
    1. Schwartz AV, Sigurdsson S, Hue TF, et al. Vertebral bone marrow fat associated with lower trabecular BMD and prevalent vertebral fracture in older adults. J Clin Endocrinol Metab. 2013;98(6):2294‐2300. - PMC - PubMed
    1. Duque G, Rivas D, Li W, et al. Age‐related bone loss in the LOU/c rat model of healthy ageing. Exp Gerontol. 2009;44(3):183‐189. - PubMed
    1. Rendina‐Ruedy E, Rosen CJ. Lipids in the bone marrow: an evolving perspective. Cell Metab. 2020;31(2):219‐231. - PMC - PubMed