. 2022 Jan 12:11:e69517.
doi: 10.7554/eLife.69517.

Motor planning brings human primary somatosensory cortex into action-specific preparatory states

Affiliations

Motor planning brings human primary somatosensory cortex into action-specific preparatory states

Giacomo Ariani et al. Elife. .

Abstract

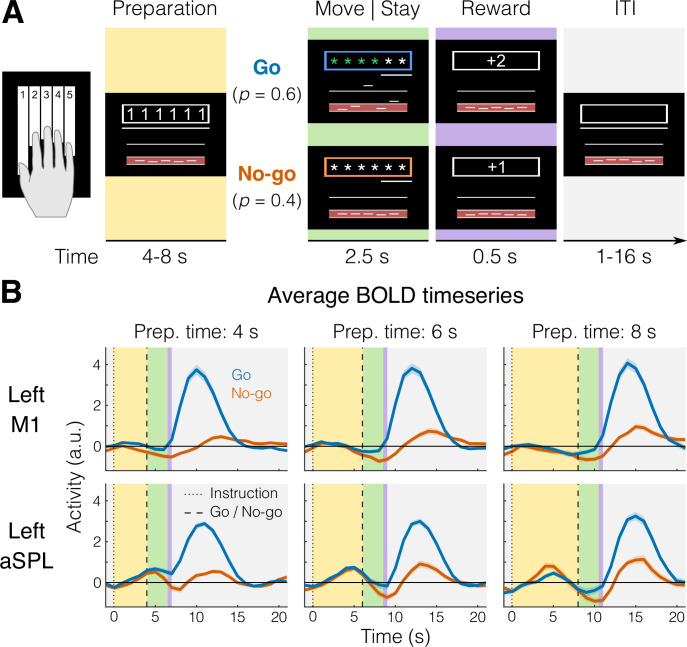
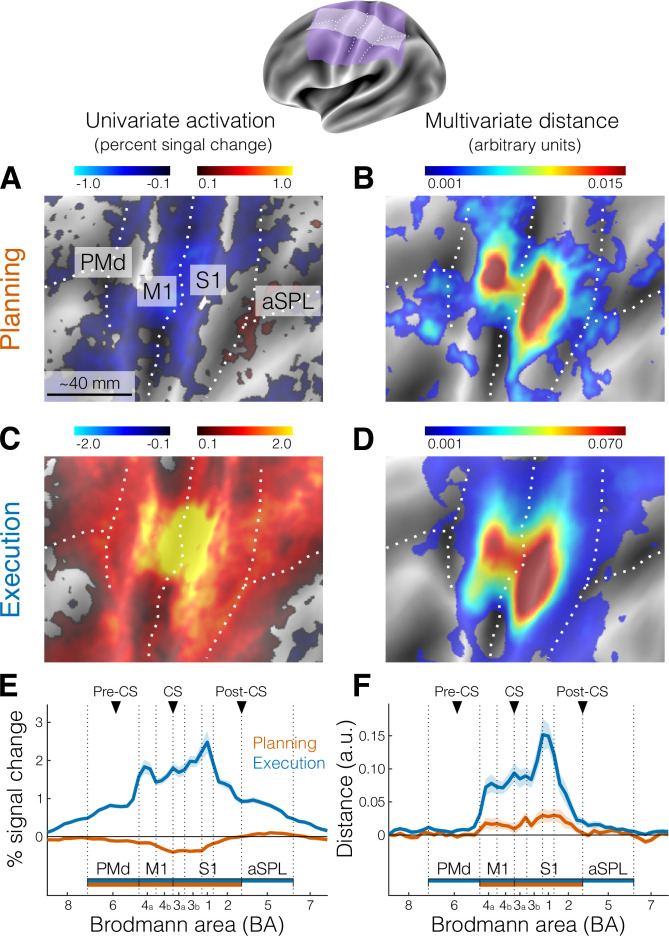
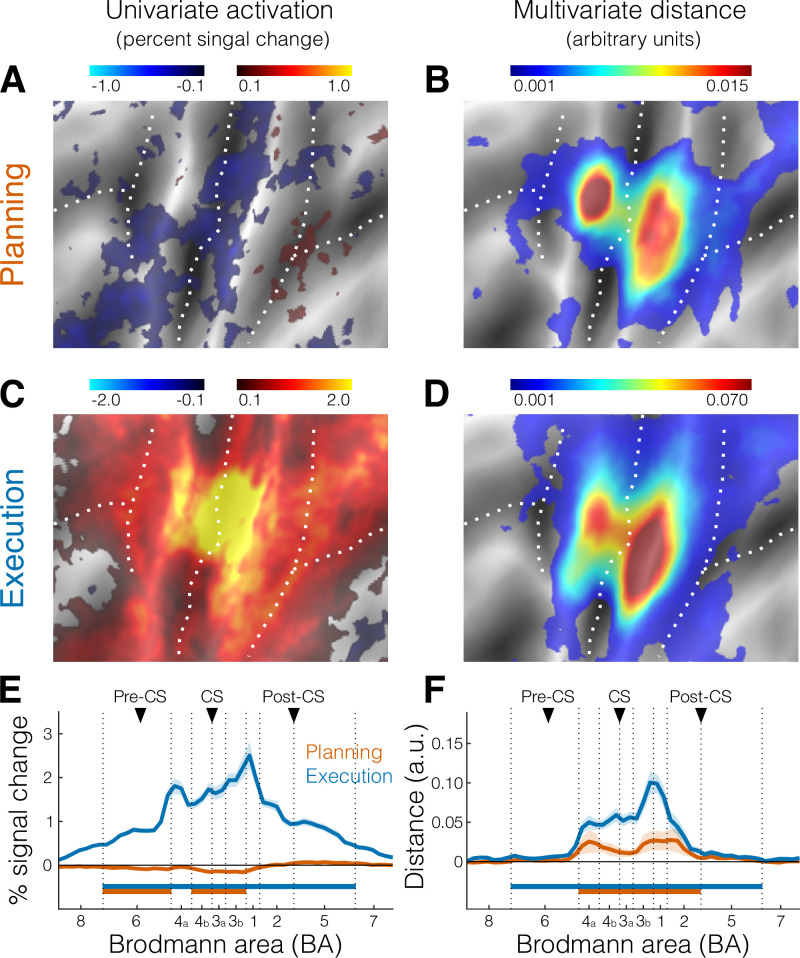
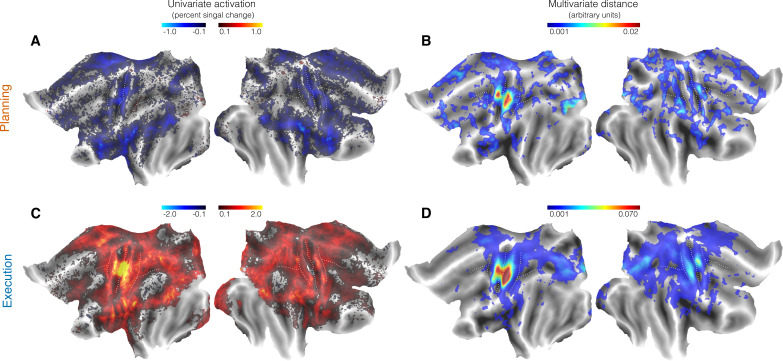
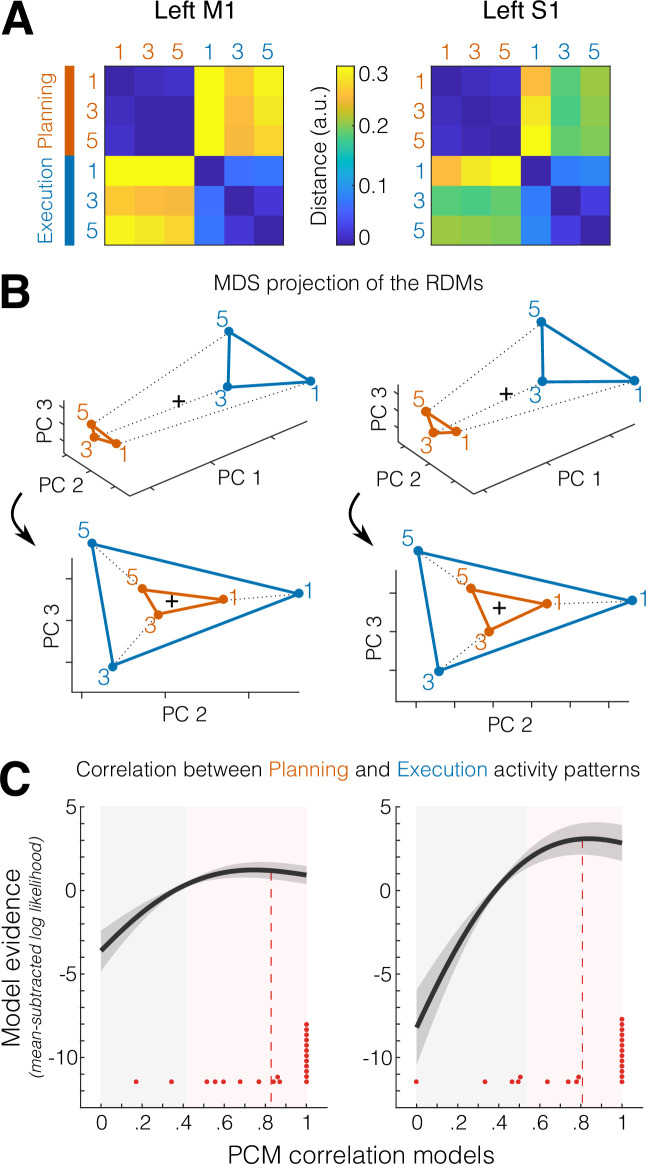
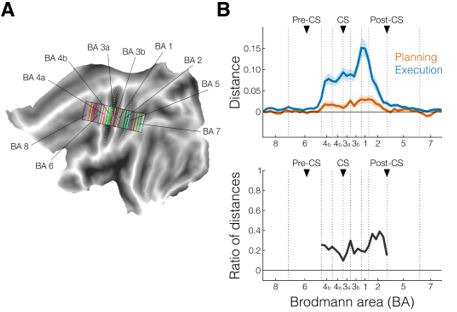
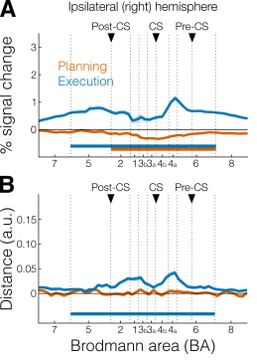
Motor planning plays a critical role in producing fast and accurate movement. Yet, the neural processes that occur in human primary motor and somatosensory cortex during planning, and how they relate to those during movement execution, remain poorly understood. Here, we used 7T functional magnetic resonance imaging and a delayed movement paradigm to study single finger movement planning and execution. The inclusion of no-go trials and variable delays allowed us to separate what are typically overlapping planning and execution brain responses. Although our univariate results show widespread deactivation during finger planning, multivariate pattern analysis revealed finger-specific activity patterns in contralateral primary somatosensory cortex (S1), which predicted the planned finger action. Surprisingly, these activity patterns were as informative as those found in contralateral primary motor cortex (M1). Control analyses ruled out the possibility that the detected information was an artifact of subthreshold movements during the preparatory delay. Furthermore, we observed that finger-specific activity patterns during planning were highly correlated to those during execution. These findings reveal that motor planning activates the specific S1 and M1 circuits that are engaged during the execution of a finger press, while activity in both regions is overall suppressed. We propose that preparatory states in S1 may improve movement control through changes in sensory processing or via direct influence of spinal motor neurons.

Keywords: fMRI; finger control; human; motor planning; neuroscience; representational geometry; sensorimotor cortex.


Conflict of interest statement

GA No competing interests declared, JP, JD Reviewing editor, eLife

Figures

Figure 1.
Figure 1.. fMRI task and blood-oxygen-level-dependent (BOLD) responses.
(A) Example trial with timing information. Background colors indicate different experimental phases (yellow = preparation; green = move [go] or stay [no-go]; purple = reward; gray = intertrial interval, ITI). (B) Group-averaged BOLD response (N = 22) for go (blue) and no-go (orange) trials in a region that shows no planning-evoked activity (left M1, top), and one that shows some planning-evoked activity (left anterior superior parietal lobule [aSPL], bottom). Shaded areas indicate standard error of the mean (SEM). Background colors correspond to trial phases as in A.
Figure 2.
Figure 2.. Activation and distance analyses of movement planning and execution.
The inset shows the inflated cortical surface of the contralateral (left) hemisphere, highlighting the area of interest (A-D, purple) and the strip used for the profile region of interest (ROI) analysis (E, F, white). Major sulci are indicated by white dotted lines.( A) Univariate activation map (percent signal change) for the contrast planning > baseline (no-go trials only). (B) Multivariate searchlight map of the mean crossnobis distance between the planning of the three fingers (no-go trials only). (C) Same as A, but for the univariate contrast execution > baseline (go trials). (D) Same as B, but for the mean crossnobis distance between fingers during execution. Colorbars in A and C reflect mean percent signal change, whereas colorbars in B and D reflect mean crossnobis distance (arbitrary units). (E) Profile ROI analysis (see Materials and methods) of the mean percent signal change (± standard error of the mean [SEM]) during planning (no-go trials, orange) and execution (blue). The x-axis corresponds to Brodmann areas (BAs) selected from the white strip shown in the inset at the top. Horizontal bars indicate significance (p < 0.05) in a two-sided one-sample t-test vs zero for selected ROIs. (F) Same as E, but for the mean crossnobis distance (± SEM). Vertical dotted lines mark the approximate boundaries between BAs subdivisions of our main ROIs (see Materials and methods). Black triangles point to the approximate location of the main anatomical landmarks: Pre-CS = precentral sulcus; CS = central sulcus; Post-CS = postcentral sulcus. PMd (BA 6) = dorsal premotor cortex; M1 (BA 4a, 4b) = primary motor cortex; S1 (BA 3a, 3b, 1, 2) = primary somatosensory cortex; aSPL (BA 5) = anterior superior parietal lobule. For analogous results using the estimates of planning activity from all trials, see Figure 2—figure supplement 1. For the whole-brain maps of univariate and multivariate results, see Figure 2—figure supplement 2.
Figure 2—figure supplement 1.
Figure 2—figure supplement 1.. Activation and distance analyses using planning of both go and no-go trials.
(A) Activation map (percent signal change) for the contrast planning > baseline. The selected area of interest is the same as shown in purple in the inset of Figure 2A. (B) Crossnobis distance searchlight map for movement planning. (C) Same as A, but for the contrast execution > baseline. (D) Same as B, but for movement execution. (E, F) Profile region of interest (ROI) analysis corresponding to the same area shown in white in the inset of Figure 2A. (E) Mean percent signal change (± standard error of the mean [SEM]) during planning (orange) and execution (blue). (F) Mean crossnobis distance (± SEM). Horizontal bars indicate significance (p < 0.05) in a two-sided one-sample t-test against zero. All other figure conventions are the same as in Figure 2.
Figure 2—figure supplement 2.
Figure 2—figure supplement 2.. Whole-brain flat surface maps (both cortical hemispheres).
(A) Univariate activation for planning (no-go trials). (B) Multivariate distance for planning (no-go trials). (C) Univariate activation for execution. (D) Multivariate distance for execution. Colorbars reflect mean percent signal change for the univariate maps and mean crossnobis distance (arbitrary units) for the multivariate maps.
Figure 3.
Figure 3.. Small involuntary movements do not explain preparatory activity patterns in M1 and S1 (A).
Mean finger force (± standard error of the mean [SEM]) plotted in 10 ms bins, time aligned to instruction onset (dotted vertical line) and end of the preparation phase (dashed vertical lines), separately for the three fingers and go (blue) and no-go (orange) trials. (B) Example of an individual trial with a 6-s preparation phase, followed six presses of the little finger (green). Horizontal solid line denotes press threshold (1 N). Dash-dotted lines denote the boundaries of the finger preactivation red area in Figure 1A (see Materials and methods). Reaction time (RT) was defined as the time from the go cue (dashed vertical line) to the onset of the first press (left solid vertical line). Movement time (MT) was defined as the time from the onset of the first press (left solid vertical line) until the release of the last press (right solid vertical line). (C) Pearson’s correlation (r) between behavioral and neural distances in M1 and S1 (see Materials and methods) during the preparation phase (planning, orange). Each dot represents an individual participant (N = 22). Solid line shows linear regression fit; p values pairs refers to the slope and the intercept of the fitted line. (D) Same as C, but during the movement phase (execution, blue).
Figure 4.
Figure 4.. Correlated representations of single fingers across planning and execution.
(A) Representational dissimilarity matrices (RDMs) showing the average crossnobis distance between the activity patterns for digits 1 (thumb), 3 (middle), and 5 (little) during the preparation (no-go planning, orange) and movement (execution, blue) phases, for M1 (left) and S1(right), in the left hemisphere. (B) Two different views of a multidimensional scaling (MDS) plot that represents the distance between activity patterns in A as spatial distance in a three-dimensional (3D) coordinate system. Top, view highlighting the first principal component (PC1, difference in average activation between planning and execution). Bottom, rotated view highlighting the correspondence between representational geometries across planning and execution visible on PC2 and PC3. The black cross denotes the mean pattern across conditions. (C) Pattern component modeling (PCM) evaluation of models (x-axis) of different correlations between planning- and execution-related activity patterns. Shown in dark gray is the group average of the individual log-likelihood (± standard error of the mean [SEM] across participants) curves expressed as a difference from the mean log-likelihood across models (i.e., zero on the y-axis). Red dots indicate the best fitting correlation model for each participant (N = 22). Red dashed lines denote the average winning (i.e., best fitting) models across participants. Gray-shaded areas indicate models that perform statistically worse (p < 0.05) than the best fitting correlation model (determined in a cross-validated fashion, see Materials and methods). Pink-shaded areas indicate models that do not perform significantly worse than the best fitting correlation model (p ≥ 0.05).
Author response image 1.
Author response image 1.. A.
Example of rectangular searchlights used to examine different subsections of our ROIs, superimposed on the flat map of the left hemisphere. Each color corresponds to a different searchlight (i.e., one point on the x-axis in B). Black outlines denote approximate boundaries of the different subdivisions of the ROIs (see also vertical dotted lines in B). White dotted lines indicate the three main sulci for our regions of interest: precentral sulcus (pre-CS), central sulcus (CS), and postcentral sulcus (post-CS). B. New crossnobis distance analysis (top) and corresponding ratio of the distances (bottom) during planning (no-go trials only, orange) and execution (blue). Black triangles denote approximate location of sulci as anatomical landmarks.
Author response image 2.
Author response image 2.. A.
Profile ROIs analysis of activation (mean percent signal change) in the ipsilateral (right) hemisphere for planning (orange) and execution (blue). Vertical dotted lines denote boundaries of ROI subdivisions. Black triangles denote the three main sulci in the right hemisphere: postcentral sulcus (post-CS), central sulcus (CS), and precentral sulcus (pre-CS). Horizontal bars indicate significance (p < 0.05) in a 2-sided one-sample t-test vs zero. B. Same as A but for multivariate crossnobis distance.

References

    1. Alexander GE, Crutcher MD. Neural representations of the target (goal) of visually guided arm movements in three motor areas of the monkey. Journal of Neurophysiology. 1990;64:164–178. doi: 10.1152/jn.1990.64.1.164. - DOI - PubMed
    1. Andersen RA, Cui H. Intention, action planning, and decision making in parietal-frontal circuits. Neuron. 2009;63:568–583. doi: 10.1016/j.neuron.2009.08.028. - DOI - PubMed
    1. Arbuckle SA, Weiler J, Kirk EA, Rice CL, Schieber M, Pruszynski JA, Ejaz N, Diedrichsen J. Structure of Population Activity in Primary Motor Cortex for Single Finger Flexion and Extension. The Journal of Neuroscience. 2020;40:9210–9223. doi: 10.1523/JNEUROSCI.0999-20.2020. - DOI - PMC - PubMed
    1. Ariani G, Wurm MF, Lingnau A. Decoding Internally and Externally Driven Movement Plans. The Journal of Neuroscience. 2015;35:14160–14171. doi: 10.1523/JNEUROSCI.0596-15.2015. - DOI - PMC - PubMed
    1. Ariani G, Oosterhof NN, Lingnau A. Time-resolved decoding of planned delayed and immediate prehension movements. Cortex; a Journal Devoted to the Study of the Nervous System and Behavior. 2018;99:330–345. doi: 10.1016/j.cortex.2017.12.007. - DOI - PubMed

Publication types