

Loss of TREM2 rescues hyperactivation of microglia, but not lysosomal deficits and neurotoxicity in models of progranulin deficiency
- PMID: 35019161
- PMCID: PMC8844989
- DOI: 10.15252/embj.2021109108
Loss of TREM2 rescues hyperactivation of microglia, but not lysosomal deficits and neurotoxicity in models of progranulin deficiency
Abstract
Haploinsufficiency of the progranulin (PGRN)-encoding gene (GRN) causes frontotemporal lobar degeneration (GRN-FTLD) and results in microglial hyperactivation, TREM2 activation, lysosomal dysfunction, and TDP-43 deposition. To understand the contribution of microglial hyperactivation to pathology, we used genetic and pharmacological approaches to suppress TREM2-dependent transition of microglia from a homeostatic to a disease-associated state. Trem2 deficiency in Grn KO mice reduced microglia hyperactivation. To explore antibody-mediated pharmacological modulation of TREM2-dependent microglial states, we identified antagonistic TREM2 antibodies. Treatment of macrophages from GRN-FTLD patients with these antibodies led to reduced TREM2 signaling due to its enhanced shedding. Furthermore, TREM2 antibody-treated PGRN-deficient microglia derived from human-induced pluripotent stem cells showed reduced microglial hyperactivation, TREM2 signaling, and phagocytic activity, but lysosomal dysfunction was not rescued. Similarly, lysosomal dysfunction, lipid dysregulation, and glucose hypometabolism of Grn KO mice were not rescued by TREM2 ablation. Synaptic loss and neurofilament light-chain (NfL) levels, a biomarker for neurodegeneration, were further elevated in the Grn/Trem2 KO cerebrospinal fluid (CSF). These findings suggest that TREM2-dependent microglia hyperactivation in models of GRN deficiency does not promote neurotoxicity, but rather neuroprotection.
Keywords: frontotemporal lobar degeneration; lysosomes; microglia; neurodegeneration; progranulin.
© 2022 The Authors. Published under the terms of the CC BY NC ND 4.0 license.
Conflict of interest statement
CH collaborates with Denali Therapeutics, participated on one advisory board meeting of Biogen, and received a speaker honorarium from Novartis and Roche. CH is chief advisor of ISAR Bioscience. KMM, BVL, TL, JS, JWL, and GDP are employees and shareholders of Denali Therapeutics. DP is a scientific advisor of ISAR Bioscience. MB received speaker honoraria from GE healthcare, Roche, and LMI and is an advisor of LMI.
Figures
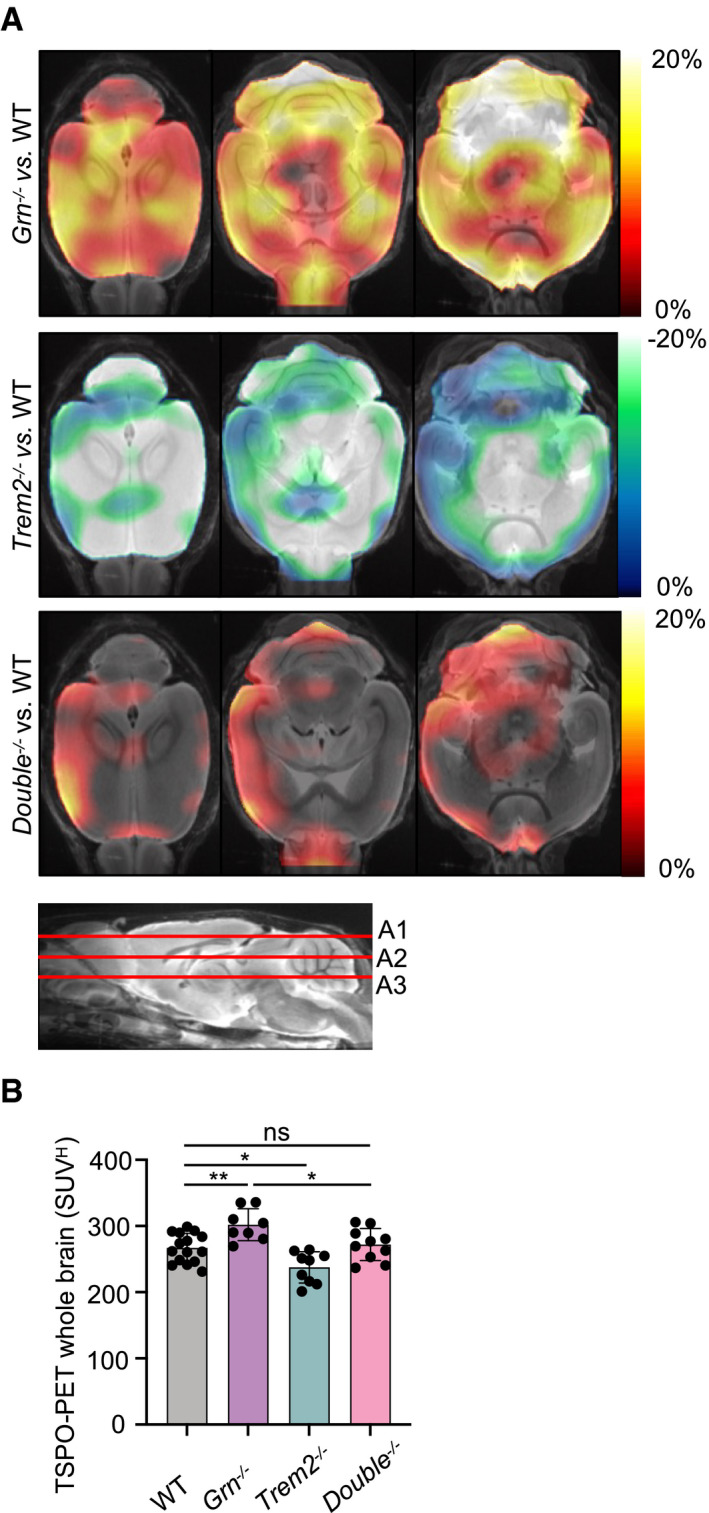
Axial slices as indicated below (A1, A2, and A3) show %‐TSPO‐PET differences between Grn −/−, Trem2 −/−, or Double −/− mice and WT at the group level. Images adjusted to an MRI template indicate increased microglial activity in the brain of Grn −/− mice (hot color scale), compensated microglial activity in the brain of Double −/− mice, and decreased microglial activity in the brain of Trem2 −/− mice (cold color scale), each in contrast against age‐matched WT mice.
Scatter plot illustrates individual mouse TSPO‐PET values derived from a whole‐brain volume of interest. A total of 8–15 female mice per group at an average age of 11.1 ± 1.6 months (Grn −/− (n = 8), Trem2 −/− (n = 9), Double −/− (n = 10), and WT (n = 15)). Data represent mean ± SD. For statistical analysis, one‐way ANOVA with Tukey post hoc test was used. Statistical significance was set at *P < 0.05; **P < 0.01; ns, not significant.
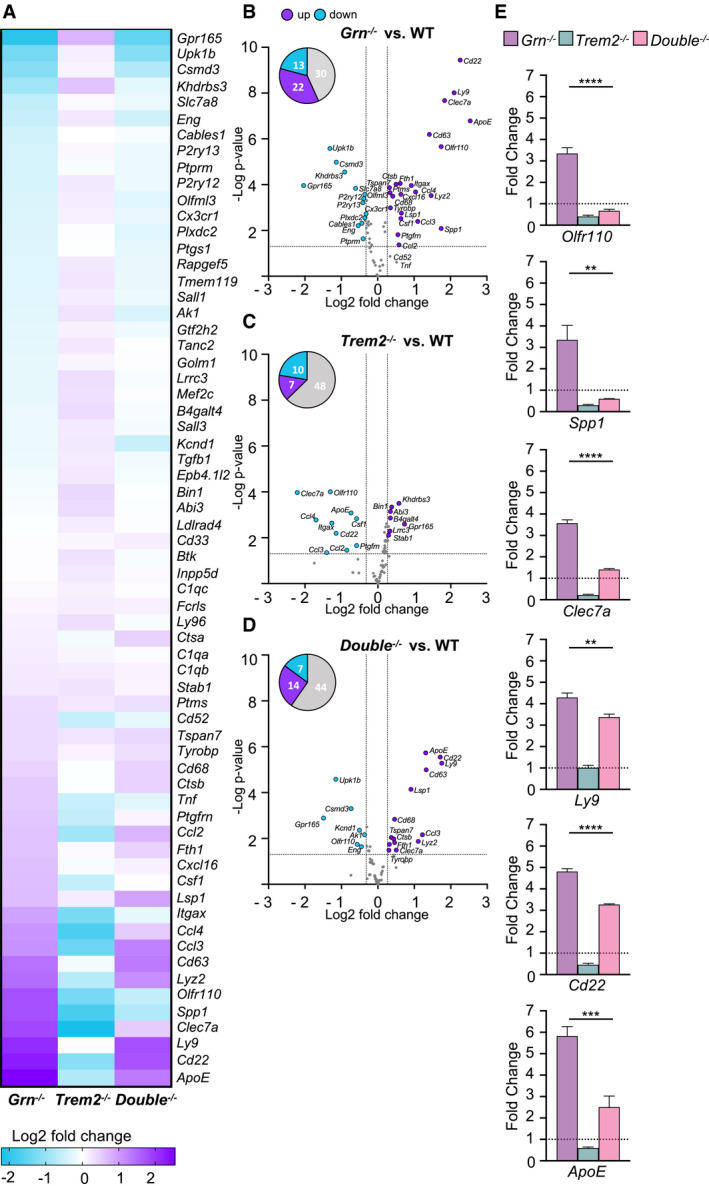
Heatmap of 65 DAM‐associated gene transcripts analyzed by NanoString in FCRLS‐ and CD11b‐positive Grn −/− (n = 6), Trem2 −/− (n = 5), and Double −/− (n = 6) microglia in comparison to WT (n = 7) microglia isolated from 6‐month‐old male mice. The expression‐corrected and housekeeping gene normalized RNA counts for each gene and sample were normalized to the mean value of WT followed by a log2 transformation.
Volcano plot presentation of the differently expressed transcripts in FCRLS‐ and CD11b‐positive Grn −/− (n = 6) in comparison to WT (n = 6) microglia isolated from 6‐month‐old male mice. A total of 35 of 65 analyzed genes are significantly changed more than 20%, with 22 genes upregulated (purple) and 13 genes downregulated (blue).
Volcano plot presentation of the differently expressed transcripts in FCRLS‐ and CD11b‐positive Trem2 −/− (n = 5) in comparison to WT (n = 6) microglia isolated from 6‐month‐old male mice. A total of 17 of 65 analyzed genes are significantly changed more than 20%, with 7 genes upregulated (purple) and 10 genes downregulated (blue).
Volcano plot presentation of the differently expressed transcripts in FCRLS‐ and CD11b‐positive Double −/− (n = 6) in comparison to WT (n = 6) microglia isolated from 6‐month‐old male mice. A total of 21 of 65 analyzed genes are significantly changed more than 20%, with 14 genes upregulated (purple) and 7 genes downregulated (blue).
Expression profiles of selected DAM genes, whose mRNA levels are rescued in Double −/− (n = 6) versus Grn −/− (n = 6) microglia. mRNA expression normalized to the mean of the WT cohort. Data represent mean ± SEM.

Schematic presentation of human TREM2 with the identified binding site of antagonistic antibodies Ab1 and Ab2 (purple) in the Ig‐like V‐type domain. Light purple indicates the overlapping amino acid sequence of the two peptides, which are bound by Ab1 and Ab2 (see also EV1B). The disease‐associated Y38C and R47H mutations are indicated in yellow. Created with BioRender.com.
AlphaLISA‐mediated quantification of p‐Syk in human macrophages with a dose titration treatment of Ab1 and Ab2 with or without liposomes for 5 min. IC50 and maximal inhibition (max) are indicated by a dotted line. Data represent the mean ± SEM (n = 3 independent experiments).
ELISA‐mediated quantification confirms reduced PGRN serum levels in GRN mutation carriers versus healthy controls. PGRN was measured by ELISA in technical triplicates and normalized to serum levels of healthy controls. Data points indicate individual patients (GRN‐FTLD) and healthy controls (HC).
Western blot of TREM2 in lysates and conditioned media of cultured human macrophages isolated from GRN‐FTLD patients and HC. Mature (mTREM2), immature (imTREM2), and soluble TREM2 (sTREM2) are indicated. Calnexin was used as loading control.
Quantification of mTREM2 expression levels in lysates of cultured human macrophages isolated from GRN‐FTLD patients (data shown in D). mTREM2 levels were normalized to HC (n = 4). Data points indicate individual patients.
ELISA‐mediated quantification of sTREM2 in conditioned media of human macrophages isolated from GRN‐FTLD patients and HC (n = 3). sTREM2 could not be measured in conditioned media of human macrophages isolated from patient #3 due to low overall cell yield. Data points indicate individual patients and HC.
Western blot of TREM2 in lysates and media of cultured human macrophages isolated from GRN‐FTLD #1 and HC #1 upon treatment with Ab1 and Ab2. An isotype antibody was used as a negative control. ADAM protease inhibition (GM) does not further increase mTREM2 levels in GRN‐FTLD patients. Equal amounts of protein were loaded. GAPDH was used as loading control.
Quantification of mTREM2 expression normalized to HC (n = 4) (data shown in G). Data points indicate individual patients.
ELISA‐mediated quantification of sTREM2 in conditioned media of human macrophages isolated from GRN‐FTLD patients (n = 3). sTREM2 could not be measured in conditioned media of human macrophages isolated from patient #3 due to low overall cell yield. Data points indicate individual patients.
AlphaLISA‐mediated quantification of p‐Syk levels in human macrophages upon treatment with Ab1 and Ab2 with liposomes for 60 min (n = 3). An isotype antibody was used as a negative control. Data points indicate individual patients. Isolated material from patient #3 did not yield enough cells to perform this experiment.

- A
AlphaLISA quantification of p‐Syk levels in HEK293 cells overexpressing TREM2‐DAP12 upon treatment with Ab1 or Ab2 with three doses of liposomes (EC10: 0.0189527 mg/ml, EC25: 0.0633607 mg/ml, or EC50: 0.211731 mg/ml). PBS was used as a negative control. Individual data points are shown (n = 2 independent experiments).
- B
Biochemical binding data of TREM2 IgV peptides to antagonistic antibodies Ab1 and Ab2, as well as isotype control. Positive data represent binding level above a threshold of 2*LLOD (lower limit of detection), from an average of three independent experiments.
- C
Table of Ab1 and Ab2 with Biacore binding affinities, cell binding affinities, and liposome signaling (p‐Syk) inhibition (EC50 and maximal inhibition) in human macrophage (n = 3 independent experiments).
- D, E
Cell‐binding dose–response curves generated by FACS in HEK293 cells overexpressing TREM2/DAP12 versus parental lines shown as mean fluorescence intensity (MFI).
- F, G
Biacore binding measurements of immobilized antagonist antibody to three concentrations of recombinant hTREM2‐ECD.
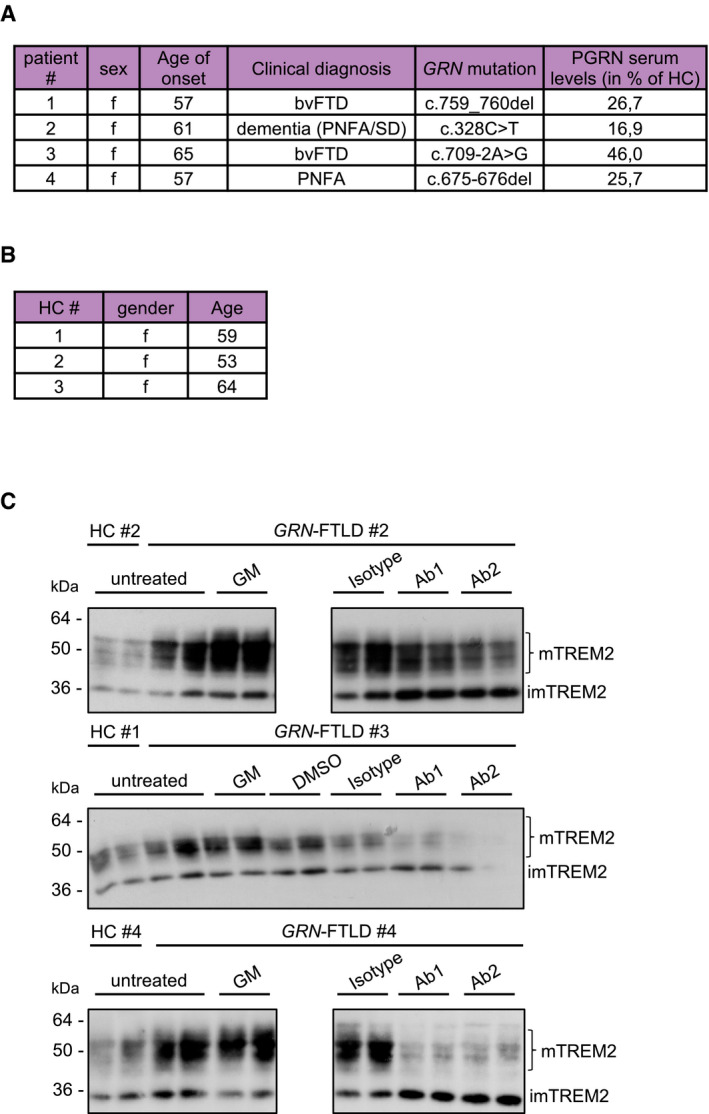
Clinical data and mutation status of the four identified GRN mutation carriers and healthy controls. Mutation status of patients #1–3 was already confirmed before. The mutation status of patient #4 was detected by sequencing of exons including flanking sequences.
Clinical data of healthy controls (HC).
Western blot analysis of TREM2 using lysates of cultured human macrophages isolated from GRN mutation carriers (patients #2 to #4) (A) and healthy control upon treatment with Ab1 and Ab2. An isotype antibody was used as a negative control. ADAM protease inhibition (GM) does not further increase mTREM2 levels in PGRN mutation carriers. Equal amounts of protein were loaded.

Western blot of PGRN in whole‐cell lysates of WT and GRN −/− hiMGL. Actin was used as loading control.
Western blot of TREM2 in whole‐cell lysates of WT and GRN −/− hiMGL. Mature (mTREM) and immature TREM2 (imTREM2) are indicated. Actin was used as loading control.
Quantification of mTREM2 expression in whole‐cell lysates of WT and GRN −/− hiMGL (data shown in B). mTREM2 levels were normalized to WT (n = 3, biological replicates).
ELISA‐mediated quantification of sTREM2 in conditioned media of WT and GRN −/− hiMGL (n = 3, biological replicates).
ELISA‐mediated quantification of sTREM2 in conditioned media of GRN −/− hiMGL upon treatment with Ab1 and Ab2 (20 μg/ml, 40 μg/ml) (n = 3, biological replicates). An isotype antibody (10 μg/ml) was used as a negative control.
AlphaLISA‐mediated quantification of p‐Syk levels in GRN −/− hiMGL upon treatment with Ab1 and Ab2 (5 μg/ml, 10 μg/ml) with liposomes (1 mg/ml) for 5 min. (n = 8, biological replicates).
Uptake assay for fluorescent myelin in WT hiMGL. Phagocytosis of myelin significantly decreased upon treatment with TREM2 antagonistic antibodies Ab1 and Ab2 (n = 4, biological replicates).
Uptake assay for fluorescent myelin. GRN −/− hiMGL phagocytose significantly more myelin as compare to WT hiMGL. This is reversed upon treatment with TREM2 antagonistic antibodies Ab1 and Ab2 (n = 4, biological replicates).

Expression of all analyzed gene transcripts in GRN −/− hiMGL treated with control isotype antibody, Ab1, or Ab2 in comparison to WT hiMGL. Data show the mean of four individual treatments and NanoString measurements. The mRNA counts for each gene were normalized to the mean value of all WT samples followed by a log2 transformation.
Volcano plot presentation of the differently expressed transcripts in GRN −/− hiMGL treated with isotype compared to WT hiMGL. Genes with more than 20% significantly changed expression are marked in purple (upregulated) or blue (downregulated).
Volcano plot presentation of the differently expressed transcripts in GRN −/− hiMGL treated with Ab1 comparison to WT hiMGL. Genes with more than 20% significantly changed expression are marked in purple (upregulated) or blue (downregulated).
Volcano plot presentation of the differently expressed transcripts in GRN −/− hiMGL treated with Ab2 comparison to WT hiMGL. Genes with more than 20% significantly changed expression are marked in purple (upregulated) or blue (downregulated).
Transcript levels of DAM gene transcripts significantly altered in GRN −/− hiMGL, treated with Ab1 or Ab2 in comparison to isotype treatment from the data set in A, and normalized to the mean of the WT hiMGL samples (n = 4, biological replicates).
Transcript levels of CTSD, NPC2, and CD68 of WT and GRN −/− hiMGL untreated, treated with isotype control, and Ab1 or Ab2 in comparison to WT hiMGL from the data set in A normalized to the mean of the WT hiMGL samples (n = 4, biological replicates).
Catalytic activity of cathepsin D (CatD) in untreated WT and GRN −/− hiMGL or GRN −/− hiMGL treated with isotype control, Ab1 or Ab2 (20 μg/ml, 40 μg/ml), as measured by a CatD in vitro activity assay (n = 3, biological replicates).
- A
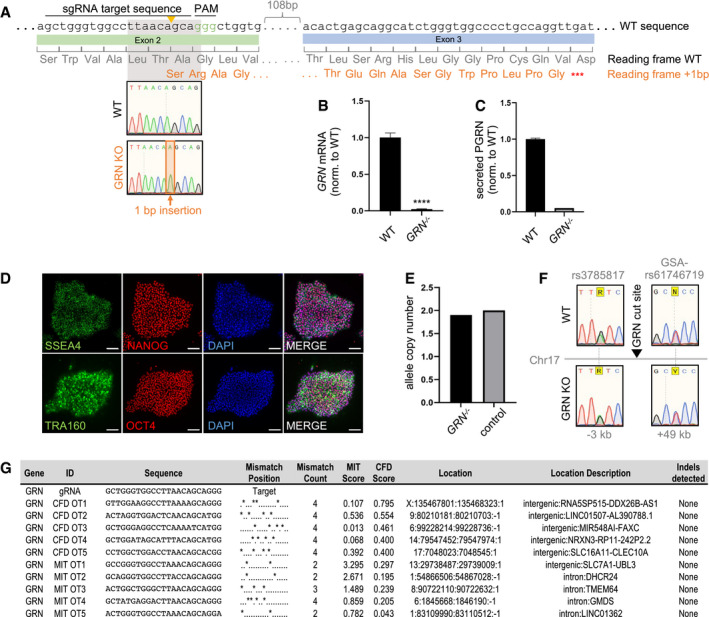
GRN knockout generation strategy: GRN was targeted in exon 2 by a sgRNA (target and PAM sequence indicated), leading to a one base pair insertion in the GRN −/− line. The resulting frameshift exposes a nearby stop codon.
- B
GRN mRNA transcript levels in WT and GRN −/− hiMGL normalized to WT, as measured by qPCR (n = 3, biological replicates).
- C
ELISA‐mediated quantification of secreted PGRN in conditioned media of WT and GRN −/− hiMGL (n = 3, biological replicates).
- D
Immunofluorescence analysis of pluripotency markers SSEA4, NANOG, TRA160, and OCT 4 with DAPI in GRN −/− iPSCs. Scalebars = 100 μm.
- E, F
Analysis of CRISPR‐mediated on‐target effects by qgPCR quantitation of allele copy number (E) and Sanger sequencing of SNPs near the edited locus in WT and GRN −/− iPSC lines (F) shows maintenance of both alleles after editing.
- G
List of top five most similar off‐target sites ranked by the CFD and MIT prediction scores, respectively. No off‐target editing was detected by Sanger sequencing.

- A
Western blot of CatD in total brain lysates from 14‐month‐old female WT, Grn −/−, Trem2 −/−, and Double −/− mice. CatD maturation variants are indicated (sc: single chain; hc: heavy chain; n = 3).
- B, C
Quantification of CatD variants in A normalized to WT (n = 3 per genotype).
- D, E
Catalytic activity of CatD in brain lysates from female 6‐month‐old (n = 4 per genotype) (D) or 14‐month‐old (n = 3 per genotype) (E) Grn −/−, Trem2 −/−, and Double −/− mice normalized to WT.
- F
Immunohistochemical analysis of lipofuscin (green) in coronal brain sections. Representative images of thalamus are shown. Scalebars = 50 μm.
- G
Quantification of lipofuscin autofluorescence. Five images per mouse were taken, and means were normalized to WT samples (n = 3 per genotype, female).
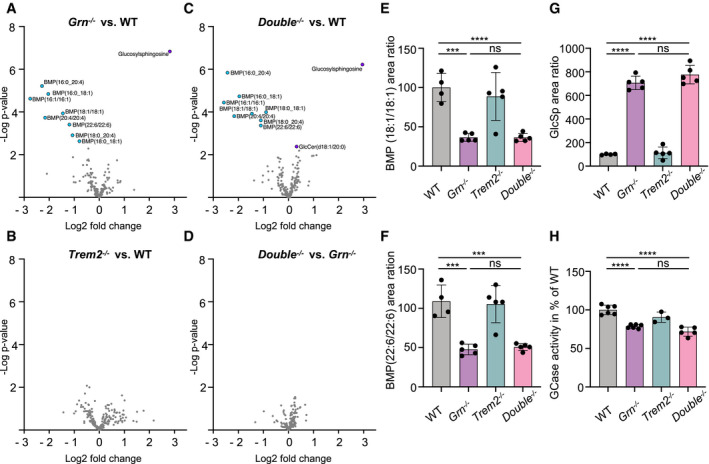
- A–D
Volcano plot presentation of lipids and metabolites upregulated (purple) or downregulated (blue) in total brain homogenates from 6‐month‐old male Grn −/− (A, n = 5), Trem2 −/− (B, n = 5), and Double −/− (C, n = 5) mice in comparison to WT (n = 4), and Double −/− in comparison to Grn −/− mice (D). Counts for each sample were normalized to the mean value of WT followed by a log2 transformation (n = 4–5 per genotype). Analyte values were adjusted with an FDR < 10% to exclude type I errors in null hypothesis testing.
- E–G
Abundance of BMP species and glucosylsphingosine (GlcSph) in total brain of 6‐month‐old Grn −/−, Trem2 −/−, Double −/−, and WT mice (n = 4–5 per genotype).
- H
Glucocerebrosidase (GCase) activity in whole‐brain lysates from 6‐month‐old male Grn −/−, Trem2 −/−, Double −/−, and WT mice. The linear increase in fluorescence signal was measured and then normalized to WT mice (n = 3–6 per genotype).

Immunohistochemical analysis of synaptophysin (SPH, pink) and VGAT (yellow) in coronal brain sections. Representative images of thalamus are shown. Scalebars = 50 μm.
Quantification of SPH‐positive area. Three images per mouse were taken, and means were normalized to WT samples (n = 3 per genotype, female).
Quantification of VGAT‐positive area. Three images per mouse were taken, and means were normalized to WT samples (n = 3 per genotype, female).
Western blot of SPH in RIPA lysates from 14‐month‐old female WT, Grn −/−, Trem2 −/−, and Double −/− mice. Actin was used as loading control.
Quantification of SPH protein levels in D normalized to WT (n = 3).
Morphological analysis of cortical microglia. Representative maximum‐intensity projections of confocal z‐stack images showing IBA1+ microglial cells of female WT, Grn −/−, Trem2 −/−, and Double −/− mice (scalebar = 50 µm). Arrows point to individual microglia, which are shown as three‐dimensional reconstruction, scalebar = 10 µm.
Morphological differences in cortical microglia from WT, Grn −/−, Trem2 −/−, and Double −/− mice shown by branch volume, sphericity score, branch length, and the number of branch nodes. Statistical analysis of group difference for the morphological scores “Branch volume” (auc = 0.72), “Sphericity score” (auc = 0.82), “Branch length” (auc = 0.69), and “Number of branch nodes” (auc = 0.80) was performed using the Wilcoxon rank‐sum test with continuity correction and Bonferroni post hoc correction for multiple testing in R (version 4.0.3). Two images per mouse (n = 3 per genotype, female) were analyzed, each data point represents one microglia cell. Median and interquartile range are displayed.

Immunoassay‐based quantification of neurofilament light‐chain (NfL) protein levels in CSF of 6‐month‐old Grn −/− (n = 4), Trem2 −/− (n = 4), Double −/− (n = 4), and WT (n = 5) male mice.
Immunoassay‐based quantification of NfL levels in CSF of 14‐month‐old Grn −/−, Trem2 −/−, Double −/−, and WT female mice (n = 3 per genotype).
Neuropathology NanoString panel analysis of total brain mRNA expression of 6‐month‐old and 14‐month‐old Grn −/−, Trem2 −/−, Double −/−, and WT male mice based on NanoString advanced analysis R‐script included in the panel (6‐month‐old mice: n = 4, 14‐month‐old mice: n = 3).
Transcript levels of all significantly changed genes in Double −/− versus Grn −/− brain mRNA of 6‐month‐old and 14‐month‐old mice analyzed in C. Grin3b were under detection limit in the 14‐month‐old cohort. Transcript expression is normalized to the mean of the WT cohort.
The same cohort of mice scanned for TSPO‐PET was additionally scanned for FDG‐PET. Axial slices as indicated show %‐FDG‐PET differences among Grn −/−, Trem2 −/−, and Double −/− (all cold color scales) when compared to WT at the group level. Images were adjusted to an MRI template.
Bar graph illustrates individual FDG‐PET values derived from a whole‐brain volume of interest. Data represent mean ± SD. A total of 8–15 female mice per group at an average age of 10.7 ± 1.5 months (Grn −/− n = 8, Trem2 −/− n = 10, Double −/− n = 10, WT n = 15) were used.

Volcano plot presentation of the differently expressed transcripts in brains of 6‐month‐old male Grn −/− mice compared to WT brain mRNA (n = 4 per genotype). A total of 17 of 752 analyzed genes are significantly changed more than 20%, with 11 genes upregulated (purple) and 6 genes downregulated (blue).
Volcano plot presentation of the differently expressed genes in brain mRNA of 6‐month‐old male Trem2 −/− mice in comparison to WT brain mRNA (n = 4 per genotype). A total of 16 of 752 analyzed genes are significantly changed by more than 20%, with 4 genes upregulated (purple) and 12 genes downregulated (blue).
Volcano plot presentation of the differently expressed genes in brain mRNA of 6‐month‐old male Double −/− mice in comparison to WT brain mRNA (n = 4 per genotype). A total of 25 of 752 analyzed genes are significantly changed by more than 20%, with 8 genes upregulated (purple) and 17 genes downregulated (blue).
Volcano plot presentation of the differently expressed transcripts in brains of 14‐month‐old male Grn −/− mice compared to WT brain mRNA (n = 3 per genotype). A total of 49 of 752 analyzed genes are significantly changed more than 20%, with 44 genes upregulated (purple) and 5 genes downregulated (blue).
Volcano plot presentation of the differently expressed genes in brain mRNA of 14‐month‐old male Trem2 −/− mice in comparison to WT brain mRNA (n = 3 per genotype). A total of 7 of 752 analyzed genes are significantly changed by more than 20%, with 7 downregulated (blue).
Volcano plot presentation of the differently expressed genes in brain mRNA of 14‐month‐old male Double −/− mice in comparison to WT brain mRNA (n = 3 per genotype). A total of 21 of 752 analyzed genes are significantly changed by more than 20%, with 8 genes upregulated (purple) and 13 genes downregulated (blue).
Transcript levels of selected significantly rescued genes in Double −/− versus Grn −/− brain mRNA of 6‐month‐old (n = 4 per genotype) and 14‐month‐old mice (n = 3 per genotype). Transcript expression is normalized to the mean of the WT cohort.
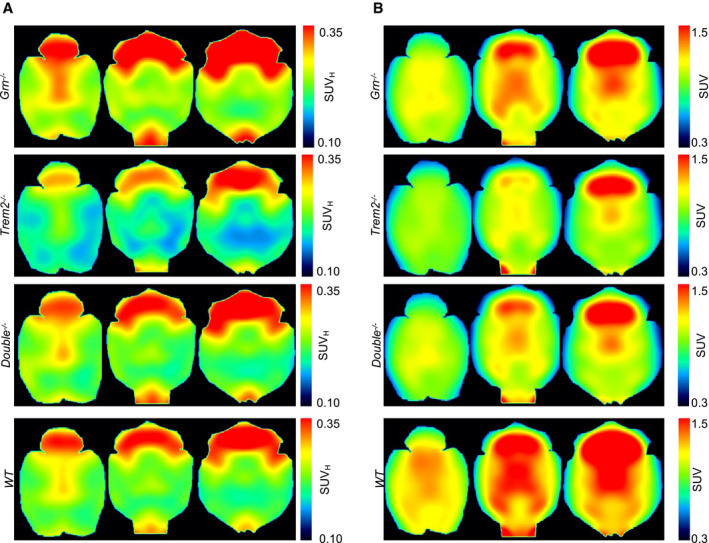
TSPO‐PET images depict increased microglial activity in Grn −/− mice, reduced microglial activity in Trem2 −/− mice, and similar levels of microglial activity in Double −/− and WT mice.
FDG‐PET images indicate similar reduction in glucose uptake in Grn −/−, Trem2 −/−, and Double −/− in comparison to WT mice.
References
-
- Aguzzi A, Haass C (2003) Games played by rogue proteins in prion disorders and Alzheimer's disease. Science 302: 814–818 - PubMed
-
- Almeida MR, Macario MC, Ramos L, Baldeiras I, Ribeiro MH, Santana I (2016) Portuguese family with the co‐occurrence of frontotemporal lobar degeneration and neuronal ceroid lipofuscinosis phenotypes due to progranulin gene mutation. Neurobiol Aging 41: 200 e201–200 e205 - PubMed
-
- Baker M, Mackenzie IR, Pickering‐Brown SM, Gass J, Rademakers R, Lindholm C, Snowden J, Adamson J, Sadovnick AD, Rollinson S et al (2006) Mutations in progranulin cause tau‐negative frontotemporal dementia linked to chromosome 17. Nature 442: 916–919 - PubMed
Publication types
MeSH terms
Substances
LinkOut - more resources
Full Text Sources
Other Literature Sources
Molecular Biology Databases
Research Materials
Miscellaneous
