. 2022 Feb;21(2):e13548.
doi: 10.1111/acel.13548. Epub 2022 Jan 12.

The metabolome as a biomarker of aging in Drosophila melanogaster

Affiliations

The metabolome as a biomarker of aging in Drosophila melanogaster

Xiaqing Zhao et al. Aging Cell. 2022 Feb.

Abstract

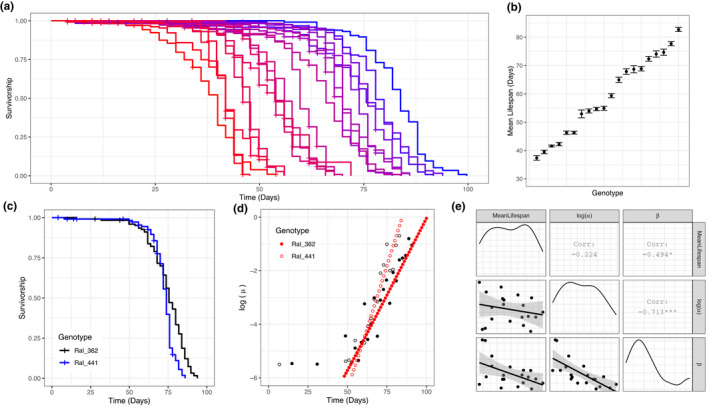
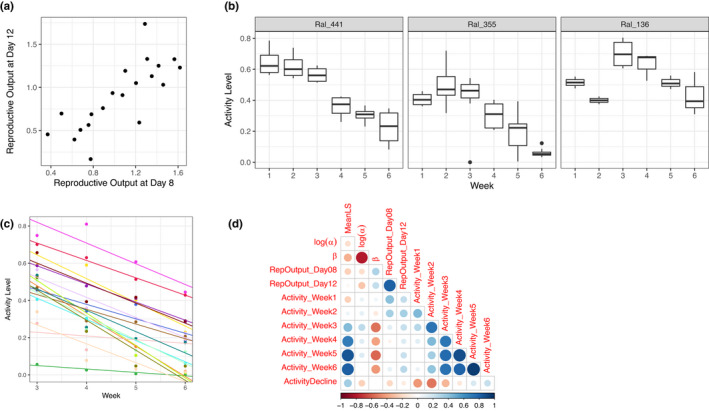
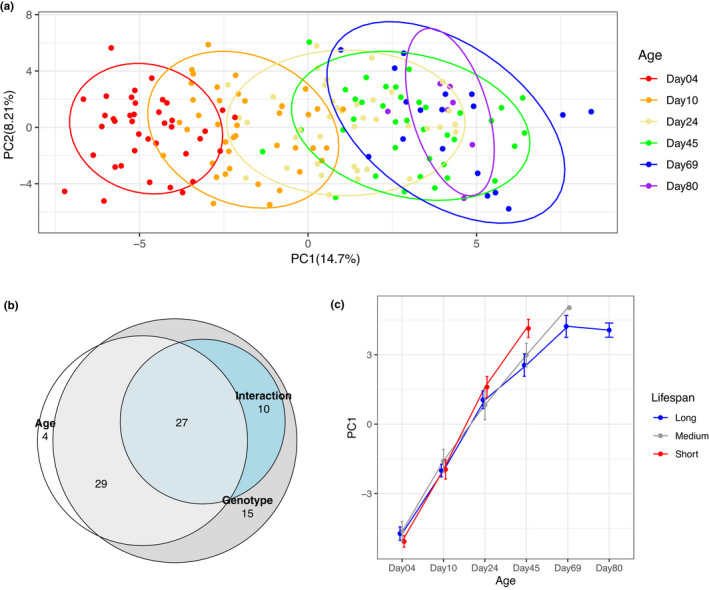
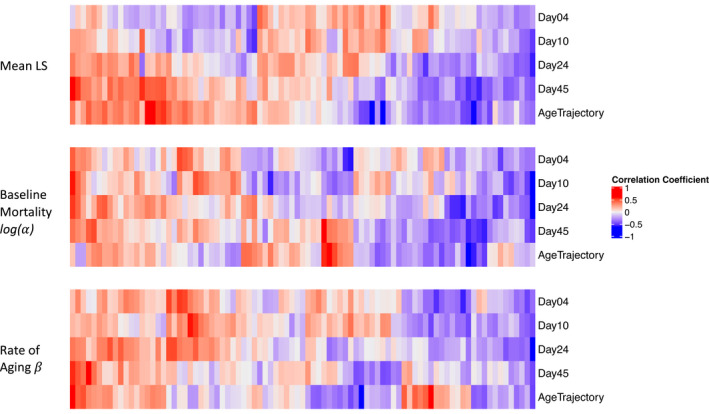
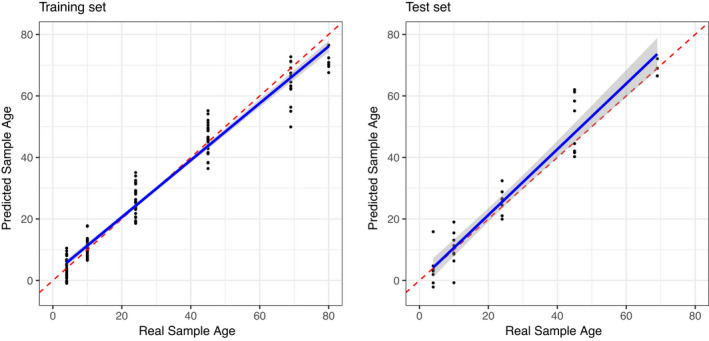
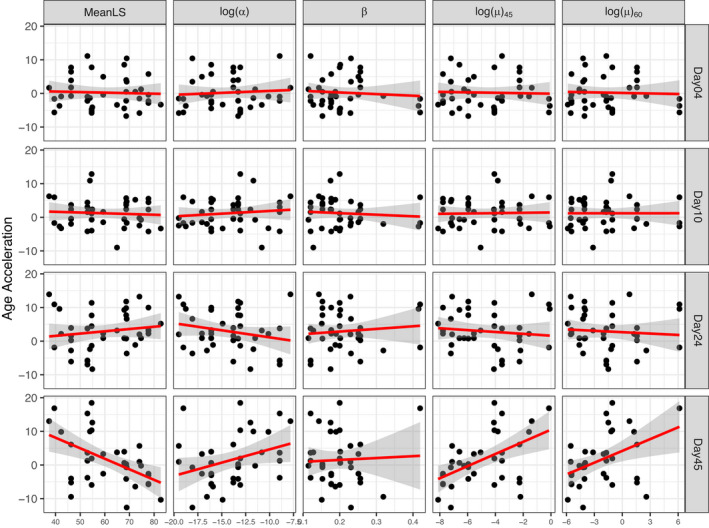
Many biomarkers have been shown to be associated not only with chronological age but also with functional measures of biological age. In human populations, it is difficult to show whether variation in biological age is truly predictive of life expectancy, as such research would require longitudinal studies over many years, or even decades. We followed adult cohorts of 20 Drosophila Genetic Reference Panel (DGRP) strains chosen to represent the breadth of lifespan variation, obtain estimates of lifespan, baseline mortality, and rate of aging, and associate these parameters with age-specific functional traits including fecundity and climbing activity and with age-specific targeted metabolomic profiles. We show that activity levels and metabolome-wide profiles are strongly associated with age, that numerous individual metabolites show a strong association with lifespan, and that the metabolome provides a biological clock that predicts not only sample age but also future mortality rates and lifespan. This study with 20 genotypes and 87 metabolites, while relatively small in scope, establishes strong proof of principle for the fly as a powerful experimental model to test hypotheses about biomarkers and aging and provides further evidence for the potential value of metabolomic profiles as biomarkers of aging.

Keywords: aging; biomarker; drosophila; metabolomics; mortality.


Conflict of interest statement

The authors declare that they have no conflict of interest.

Figures

FIGURE 1
FIGURE 1
Variation in age‐at‐death among 20 DGRP strains. (a) Kaplan–Meier survival curves of 20 DGRP strains. Each line represents a different genotype. (b) Mean (± 1 SE) of lifespan for 20 DGRP strains. (c) Survival curves of Ral_362 and Ral_441. These two strains have similar mean lifespan (Ral_362 = 74.7 days; Ral_441 = 72.4 days), but they show significantly different survival curves (log‐rank test, p = 2 × 10‒4). (d) Instantaneous mortality risks of Ral_362 (filled dots) and Ral_441 (open dots). Black dots show measured mortality and blue dots show Gompertz–Makeham fitted mortality. Ral_362 has greater baseline mortality (log(α) = −11.5) compared to Ral_441 (log(α) = −15.9), but rate of aging is lower in Ral_362 (β = 0.115) compared to Ral_441 (β = 0.188). (e) Correlation among mean lifespan, log(α), and β. Shading around regression lines indicates 95% confidence intervals
FIGURE 2
FIGURE 2
Variation in fitness‐related organismal phenotypes. (a) Variation in the square root of number of viable offspring produced by each female each day. Note that reproductive outputs at the age of day 8 and day 12 are highly correlated. (b) Examples of activity level change with age. Ral_441 represents a pattern of monotonic decline starting from the first week. Ral_355 and Ral_136 represent non‐monotonic change of activity level over age. Note that all three strains show monotonic decline in activity starting from week 3. (c) Linear regression of activity level over age between week 3 and week 6. Different colors denote different genotypes. (d) Correlation between age‐at‐death parameters and fitness‐related organismal phenotypes. Size of dots is proportional to absolute values of Spearman's ρ
FIGURE 3
FIGURE 3
Overview of metabolomics data. (a) Principal components 1 and 2 of all samples, colored by sample age. Ellipses represent 90% confidence intervals. Note that PC1 separates samples of different ages. (b) Venn diagram illustrating overlap of metabolites with significant Age, Genotype, or Age × Genotype interaction terms. Areas shown in the figure are proportional to the numbers in each category. (c) Principal component 1 over sample age, stratified by genotype lifespan. Error bars show ±1 standard error
FIGURE 4
FIGURE 4
Individual metabolites as predictors of age at death. Correlation coefficients between age‐at‐death parameters and age‐specific metabolite levels or age trajectory of metabolite levels. Note that order of the columns is different for each of the three mortality parameters
FIGURE 5
FIGURE 5
Metabolome is predictive of sample age. Both the training set (left) and test set (right) show elastic net regression predicted age vs. actual sample age. Red lines are the isometric line. Blue lines represent linear regression of the predicted sample age over real sample age. 80% of the samples were used to construct the model (left), and the model was used to predict age of the remaining 20% of samples (right). Predictions were repeated 100 times with different sets of training and test partitions. The figures shown here represent a case close to the mean R2 value
FIGURE 6
FIGURE 6
Age acceleration is correlated with demographic parameters. Red lines represent linear regression fit of data. Shading around red line shows 95% confidence interval of linear regression

References

    1. Adams, K. J. , Pratt, B. , Bose, N. , Dubois, L. G. , St. John‐Williams, L. , Perrott, K. M. , Ky, K. , Kapahi, P. , Sharma, V. , MacCoss, M. J. , Moseley, M. A. , Colton, C. A. , MacLean, B. X. , Schilling, B. , & Thompson, J. W . (2020). Skyline for Small Molecules: A Unifying Software Package for Quantitative Metabolomics. Journal of Proteome Research, 19(4), 1447–1458. 10.1021/acs.jproteome.9b00640 - DOI - PMC - PubMed
    1. Baker, G. T. , & Sprott, R. L. (1988). Biomarkers of aging. Experimental Gerontology, 23(4‐5), 223–239. 10.1016/0531-5565(88)90025-3 - DOI - PubMed
    1. Belsky, D. W. , Caspi, A. , Houts, R. , Cohen, H. J. , Corcoran, D. L. , Danese, A , Harrington, H. L. , Israel, S. , Levine, M. E. , Schaefer, J. D. , Sugden, K. , Williams, B. , Yashin, A. I. , Poulton, R. , & Moffitt, T. E. (2015). Quantification of biological aging in young adults. Proceedings of the National Academy of Sciences, 112(30), E4104–E4110. 10.1073/pnas.1506264112 - DOI - PMC - PubMed
    1. Benjamini, Y. , & Hochberg, Y . (1995). Controlling the false discovery rate: a practical and powerful approach to multiple testing. Journal of the Royal Statistical Society: Series B (Methodological), 57(1), 289–300.
    1. Bohannon, R. W . (2015). Muscle strength: clinical and prognostic value of hand‐grip dynamometry. Current Opinion in Clinical Nutrition & Metabolic Care, 18(5), 465–470. 10.1097/MCO.0000000000000202 - DOI - PubMed

Publication types

LinkOut - more resources