

Characteristics of Gut Microbiota in Patients with GH-Secreting Pituitary Adenoma
- PMID: 35019688
- PMCID: PMC8754134
- DOI: 10.1128/spectrum.00425-21
Characteristics of Gut Microbiota in Patients with GH-Secreting Pituitary Adenoma
Abstract
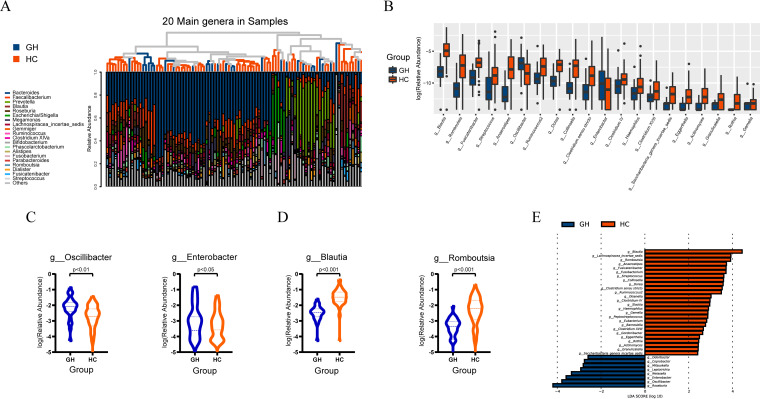
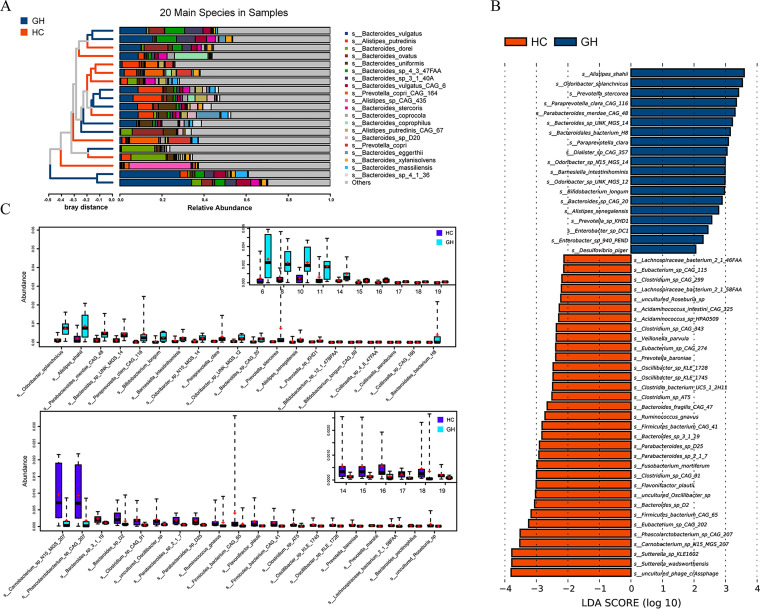
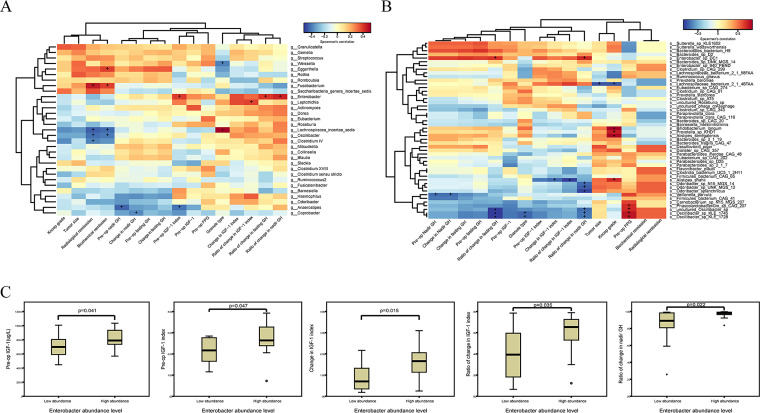
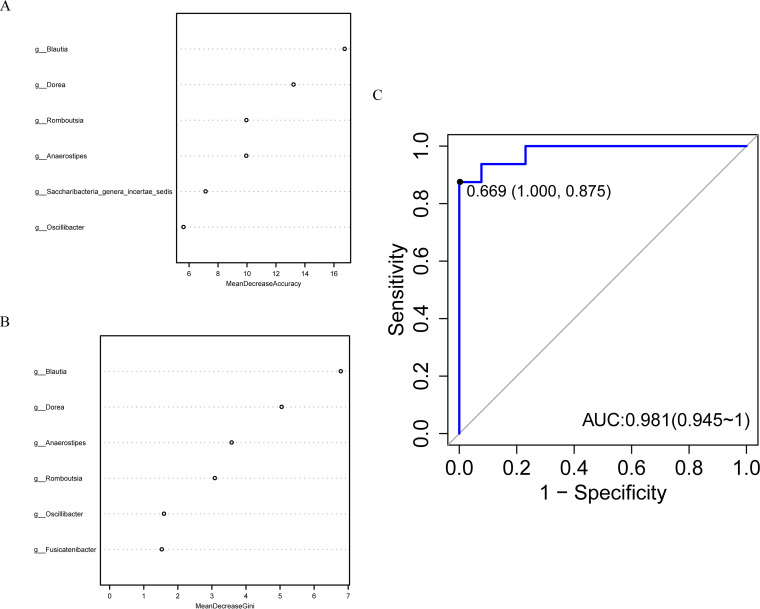
Prior study has demonstrated that gut microbiota at the genus level is significantly altered in patients with growth hormone (GH)-secreting pituitary adenoma (GHPA). Yet, no studies exist describing the state of gut microbiota at species level in GHPA. We performed a study using 16S rRNA amplicon sequencing in a cohort of patients with GH-secreting pituitary adenoma (GHPA, n = 28) and healthy controls (n = 67). Among them, 9 patients and 10 healthy controls were randomly chosen and enrolled in metagenomics shotgun sequencing, generating 280,426,512 reads after aligning to NCBI GenBank DataBase to acquire taxa information at the species level. Weighted UniFrac analysis revealed that microbial diversity was notably decreased in patients with GHPA, consistent with a previous study. With 16S rRNA sequencing, after correction for false-discovery rate (FDR), rank-sum test at the genus level revealed that the relative abundance of Oscillibacter and Enterobacter was remarkably increased in patients and Blautia and Romboutsia genera predominated in the controls, augmented by additional LEfSe (linear discriminant analysis effect size) analysis. As for further comparison at the species level with metagenomics sequencing, rank-sum test together with LEfSe analysis confirmed the enrichment of Alistipes shahii and Odoribacter splanchnicus in the patient group. Notably, LEfSe analysis with metagenomics also demonstrated that Enterobacter sp. DC1 and Enterobacter sp. 940 PEND, derived from Enterobacter, were both significantly enriched in patients. Functional analysis showed that amino acid metabolism pathway was remarkably enriched in GHPA, while carbohydrate metabolism pathway was notably enriched in controls. Further, significant positive correlations were observed between Enterobacter and baseline insulin-like growth factor 1 (IGF-1), indicating that Enterobacter may be strongly associated with GH/IGF-1 axis in GHPA. Our data extend our insight into the GHPA microbiome, which may shed further light on GHPA pathogenesis and facilitate the exploration of novel therapeutic targets based on microbiota manipulation. IMPORTANCE Dysbiosis of gut microbiota is associated not only with intestinal disorders but also with numerous extraintestinal diseases. Growth hormone-secreting pituitary adenoma (GHPA) is an insidious disease with persistent hypersecretion of GH and IGF-1, causing increased morbidity and mortality. Researches have reported that the GH/IGF-1 axis exerts its own influence on the intestinal microflora. Here, the results showed that compared with healthy controls, GHPA patients not only decreased the alpha diversity of the intestinal flora but also significantly changed their beta diversity. Further, metagenomics shotgun sequencing in the present study exhibited that Enterobacter sp. DC1 and Enterobacter sp. 940 PEND were enriched in patients. Also, we were pleasantly surprised to find that the Enterobacter genus was strongly positively correlated with baseline IGF-1 levels. Collectively, our work provides the first glimpse of the dysbiosis of the gut microbiota at species level, providing a better understanding of the pathophysiological process of GHPA.
Keywords: clinical therapeutics; metabolism; metagenomics.
Conflict of interest statement
The authors declare no conflict of interest.
Figures


Similar articles
-
Multi-omics study reveals gut microbiota dysbiosis and tryptophan metabolism alterations in GH-PitNET progression.Sci Rep. 2025 Jul 7;15(1):24261. doi: 10.1038/s41598-025-07812-x. Sci Rep. 2025. PMID: 40624207 Free PMC article.
-
Gut microbiome characteristics of women with hypothyroidism during early pregnancy detected by 16S rRNA amplicon sequencing and shotgun metagenomic.Front Cell Infect Microbiol. 2024 Aug 9;14:1369192. doi: 10.3389/fcimb.2024.1369192. eCollection 2024. Front Cell Infect Microbiol. 2024. PMID: 39185088 Free PMC article.
-
Comprehensive circular RNA profiling reveals that hsa_circ_0001368 is involved in growth hormone-secreting pituitary adenoma development.Brain Res Bull. 2020 Aug;161:65-77. doi: 10.1016/j.brainresbull.2020.04.018. Epub 2020 May 7. Brain Res Bull. 2020. PMID: 32389802
-
Gut microbiota alterations in colorectal adenoma-carcinoma sequence based on 16S rRNA gene sequencing: A systematic review and meta-analysis.Microb Pathog. 2024 Oct;195:106889. doi: 10.1016/j.micpath.2024.106889. Epub 2024 Aug 26. Microb Pathog. 2024. PMID: 39197689
-
Gut Microbiota Profile in Patients with Type 1 Diabetes Based on 16S rRNA Gene Sequencing: A Systematic Review.Dis Markers. 2020 Aug 27;2020:3936247. doi: 10.1155/2020/3936247. eCollection 2020. Dis Markers. 2020. PMID: 32908614 Free PMC article.
Cited by
-
Dynamic changes in the gut microbiota during three consecutive trimesters of pregnancy and their correlation with abnormal glucose and lipid metabolism.Eur J Med Res. 2024 Feb 12;29(1):117. doi: 10.1186/s40001-024-01702-0. Eur J Med Res. 2024. PMID: 38347605 Free PMC article.
-
Excess Growth Hormone Alters the Male Mouse Gut Microbiome in an Age-dependent Manner.Endocrinology. 2022 Jul 1;163(7):bqac074. doi: 10.1210/endocr/bqac074. Endocrinology. 2022. PMID: 35617141 Free PMC article.
-
Growth hormone attenuates obesity and reshapes gut microbiota in high-fat diet-fed mice.Metabol Open. 2024 Oct 22;24:100326. doi: 10.1016/j.metop.2024.100326. eCollection 2024 Dec. Metabol Open. 2024. PMID: 39513179 Free PMC article.
-
Multi-omics study reveals gut microbiota dysbiosis and tryptophan metabolism alterations in GH-PitNET progression.Sci Rep. 2025 Jul 7;15(1):24261. doi: 10.1038/s41598-025-07812-x. Sci Rep. 2025. PMID: 40624207 Free PMC article.
-
Gut microbiota composition and metabolic characteristics in patients with Craniopharyngioma.BMC Cancer. 2024 Apr 25;24(1):521. doi: 10.1186/s12885-024-12283-w. BMC Cancer. 2024. PMID: 38658858 Free PMC article.
References
-
- Li J, Jia H, Cai X, Zhong H, Feng Q, Sunagawa S, Arumugam M, Kultima J, Prifti E, Nielsen T, Juncker A, Manichanh C, Chen B, Zhang W, Levenez F, Wang J, Xu X, Xiao L, Liang S, Zhang D, Zhang Z, Chen W, Zhao H, Al-Aama J, Edris S, Yang H, Wang J, Hansen T, Nielsen H, Brunak S, Kristiansen K, Guarner F, Pedersen O, Doré J, Ehrlich S, Bork P, Wang J, MetaHIT Consortium. 2014. An integrated catalog of reference genes in the human gut microbiome. Nat Biotechnol 32:834–841. doi:10.1038/nbt.2942. - DOI - PubMed
Publication types
MeSH terms
Substances
LinkOut - more resources
Full Text Sources
Research Materials
Miscellaneous
