Epstein-Barr Virus LMP1-Activated mTORC1 and mTORC2 Coordinately Promote Nasopharyngeal Cancer Stem Cell Properties
- PMID: 35019715
- PMCID: PMC8906414
- DOI: 10.1128/jvi.01941-21
Epstein-Barr Virus LMP1-Activated mTORC1 and mTORC2 Coordinately Promote Nasopharyngeal Cancer Stem Cell Properties
Abstract
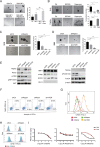
Epstein-Barr virus (EBV) is associated with several malignant diseases, including Burkitt's lymphoma, nasopharyngeal carcinoma (NPC), certain types of lymphomas, and a portion of gastric cancers. The virus-encoded oncoprotein, LMP1, induces the epithelial-to-mesenchymal transition (EMT), leading to cancer stem cell formation. In the current study, we investigated how LMP1 contributes to cancer stem cell development in NPC. We found that LMP1 plays an essential role in acquiring cancer stem cell (CSC) characteristics, including tumor initiation, metastasis, and therapeutic resistance by activating the PI3K/mTOR/Akt signaling pathway. We dissected the functions of distinct signaling (mTORC1 and mTORC2) in the acquisition of different CSC characteristics. Side population (SP) formation, which represents the chemotherapy resistance feature of CSC, requires mTORC1 signaling. Tumor initiation capability is mainly attributed to mTORC2, which confers on NPC the capabilities of proliferation and survival by activating mTORC2 downstream genes c-Myc. Both mTORC1 and mTORC2 enhance cell migration and invasion of NPC cells, suggesting that mTORC1/2 coregulate metastasis of NPC. The revelation of the roles of the mTOR signaling pathways in distinct tumorigenic features provides a guideline for designing efficient therapies by choosing specific mTOR inhibitors targeting mTORC1, mTORC2, or both to achieve durable remission of NPC in patients. IMPORTANCE LMP1 endows NPC to gain cancer stem cell characteristics through activating mTORC1 and mTORC2 pathways. The different mTOR pathways are responsible for distinct tumorigenic features. Rapamycin-insensitive mTORC1 is essential for CSC drug resistance. NPC tumor initiation capacity is mainly attributed to mTORC2 signaling. mTORC1 and mTORC2 coregulate NPC cell migration and invasion. The revelation of the roles of mTOR signaling in NPC CSC establishment has implications for novel therapeutic strategies to treat relapsed and metastatic NPC and achieve durable remission.
Keywords: Epstein-Barr virus (EBV); LMP1; cancer stem cell; mTORC1; mTORC2; nasopharyngeal carcinoma (NPC).
Conflict of interest statement
The authors declare no conflict of interest.
Figures


Similar articles
-
Activation of sterol regulatory element-binding protein 1 (SREBP1)-mediated lipogenesis by the Epstein-Barr virus-encoded latent membrane protein 1 (LMP1) promotes cell proliferation and progression of nasopharyngeal carcinoma.J Pathol. 2018 Oct;246(2):180-190. doi: 10.1002/path.5130. Epub 2018 Aug 22. J Pathol. 2018. PMID: 29968360 Free PMC article.
-
Epstein-Barr Virus-Encoded Latent Membrane Protein 1 Upregulates Glucose Transporter 1 Transcription via the mTORC1/NF-κB Signaling Pathways.J Virol. 2017 Feb 28;91(6):e02168-16. doi: 10.1128/JVI.02168-16. Print 2017 Mar 15. J Virol. 2017. PMID: 28053105 Free PMC article.
-
Regulation of DNA Damage Signaling and Cell Death Responses by Epstein-Barr Virus Latent Membrane Protein 1 (LMP1) and LMP2A in Nasopharyngeal Carcinoma Cells.J Virol. 2015 Aug;89(15):7612-24. doi: 10.1128/JVI.00958-15. Epub 2015 May 13. J Virol. 2015. PMID: 25972552 Free PMC article.
-
Discrete signaling mechanisms of mTORC1 and mTORC2: Connected yet apart in cellular and molecular aspects.Adv Biol Regul. 2017 May;64:39-48. doi: 10.1016/j.jbior.2016.12.001. Epub 2017 Jan 4. Adv Biol Regul. 2017. PMID: 28189457 Review.
-
Pathogenic role of Epstein-Barr virus latent membrane protein-1 in the development of nasopharyngeal carcinoma.Cancer Lett. 2013 Aug 28;337(1):1-7. doi: 10.1016/j.canlet.2013.05.018. Epub 2013 May 17. Cancer Lett. 2013. PMID: 23689138 Review.
Cited by
-
Target recycling amplification (TRA) combined with multiple strand displacement amplification (SDA) for sensitive detection of Epstein-Barr virus microRNA.Pract Lab Med. 2025 Aug 6;46:e00496. doi: 10.1016/j.plabm.2025.e00496. eCollection 2025 Sep. Pract Lab Med. 2025. PMID: 40823120 Free PMC article.
-
Targeting Metabolic Vulnerabilities in Epstein-Barr Virus-Driven Proliferative Diseases.Cancers (Basel). 2023 Jun 29;15(13):3412. doi: 10.3390/cancers15133412. Cancers (Basel). 2023. PMID: 37444521 Free PMC article. Review.
-
Novel Role of the Epstein-Barr Virus Encoded Deubiquitinating Enzyme (BPLF1) in mTOR-Mediated Cell Growth and Proliferation Pathways.Viruses. 2025 Aug 20;17(8):1139. doi: 10.3390/v17081139. Viruses. 2025. PMID: 40872852 Free PMC article.
-
A narrative review: exploring viral-induced malignancies through the lens of dysregulated cellular metabolism and glucose transporters.BMC Cancer. 2024 Oct 29;24(1):1329. doi: 10.1186/s12885-024-13013-y. BMC Cancer. 2024. PMID: 39472817 Free PMC article. Review.
-
Global trends in research of nasopharyngeal carcinoma: a bibliometric and visualization analysis.Front Oncol. 2024 Jul 2;14:1392245. doi: 10.3389/fonc.2024.1392245. eCollection 2024. Front Oncol. 2024. PMID: 39015496 Free PMC article.
References
-
- Sun X, Su S, Chen C, Han F, Zhao C, Xiao W, Deng X, Huang S, Lin C, Lu T. 2014. Long-term outcomes of intensity-modulated radiotherapy for 868 patients with nasopharyngeal carcinoma: an analysis of survival and treatment toxicities. Radiother Oncol 110:398–403. 10.1016/j.radonc.2013.10.020. - DOI - PubMed
-
- Horikawa T, Yang J, Kondo S, Yoshizaki T, Joab I, Furukawa M, Pagano JS. 2007. Twist and epithelial-mesenchymal transition are induced by the EBV oncoprotein latent membrane protein 1 and are associated with metastatic nasopharyngeal carcinoma. Cancer Res 67:1970–1978. 10.1158/0008-5472.CAN-06-3933. - DOI - PubMed
Publication types
MeSH terms
Substances
LinkOut - more resources
Full Text Sources
Miscellaneous

