. 2022 Feb 23;10(1):e0196021.
doi: 10.1128/spectrum.01960-21. Epub 2022 Jan 12.

Microbiome Resilience despite a Profound Loss of Minority Microbiota following Clindamycin Challenge in Humanized Gnotobiotic Mice

Affiliations

Microbiome Resilience despite a Profound Loss of Minority Microbiota following Clindamycin Challenge in Humanized Gnotobiotic Mice

Lin Liu et al. Microbiol Spectr. .

Abstract

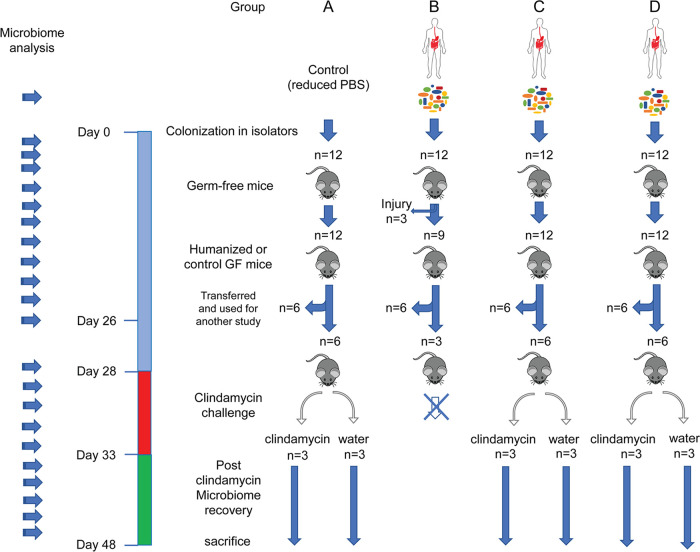
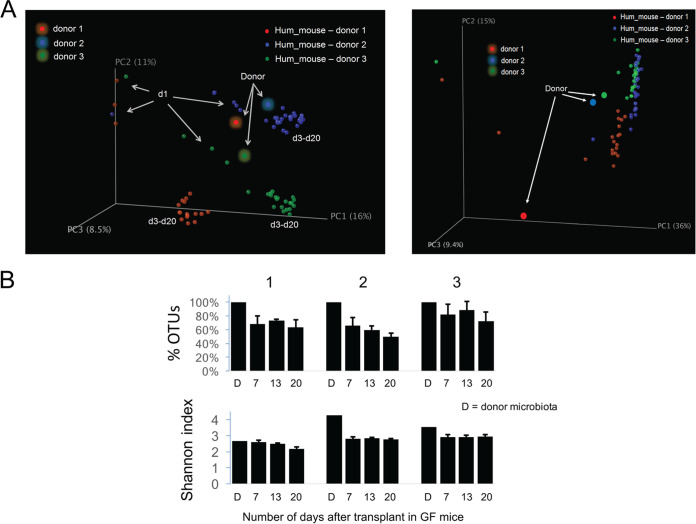
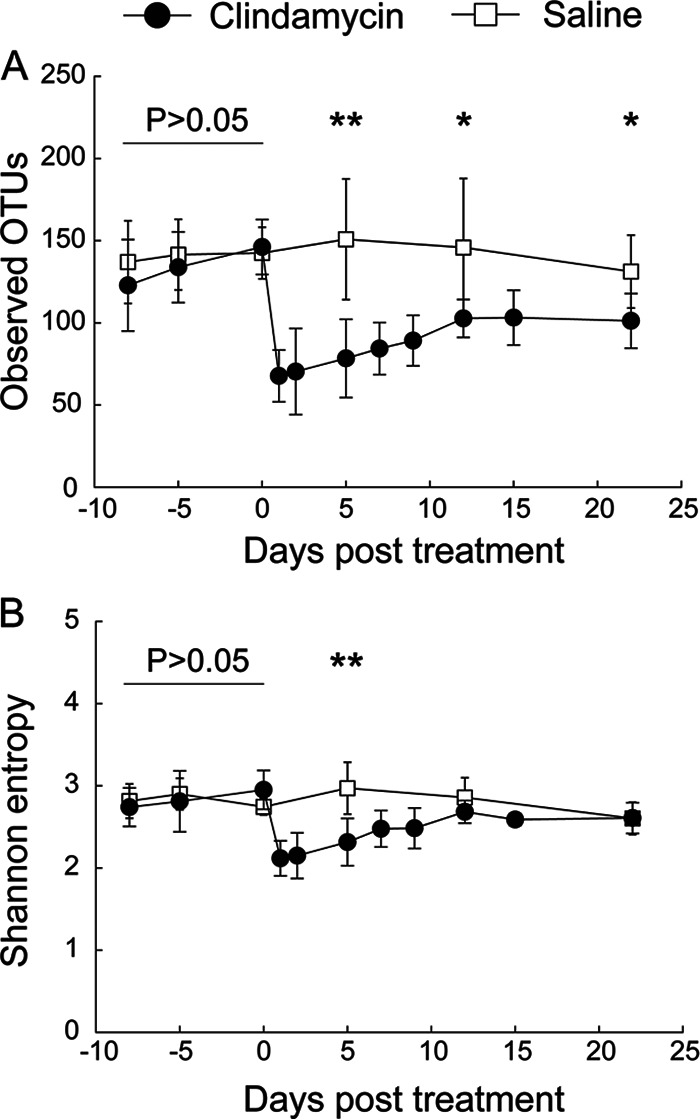
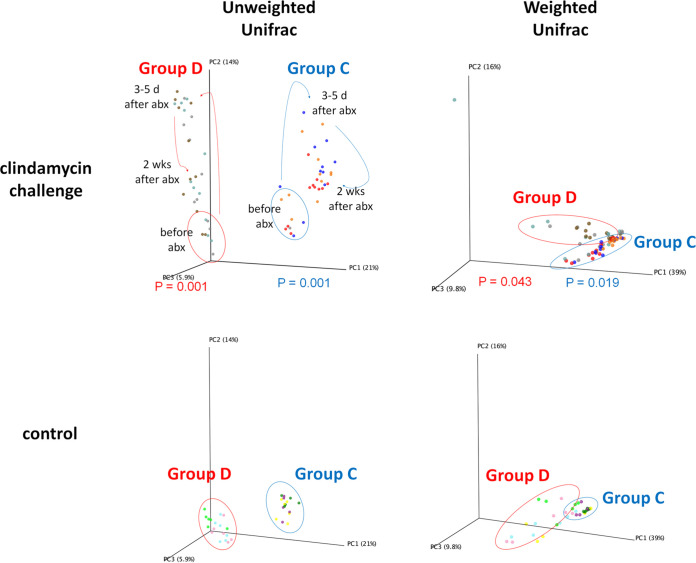
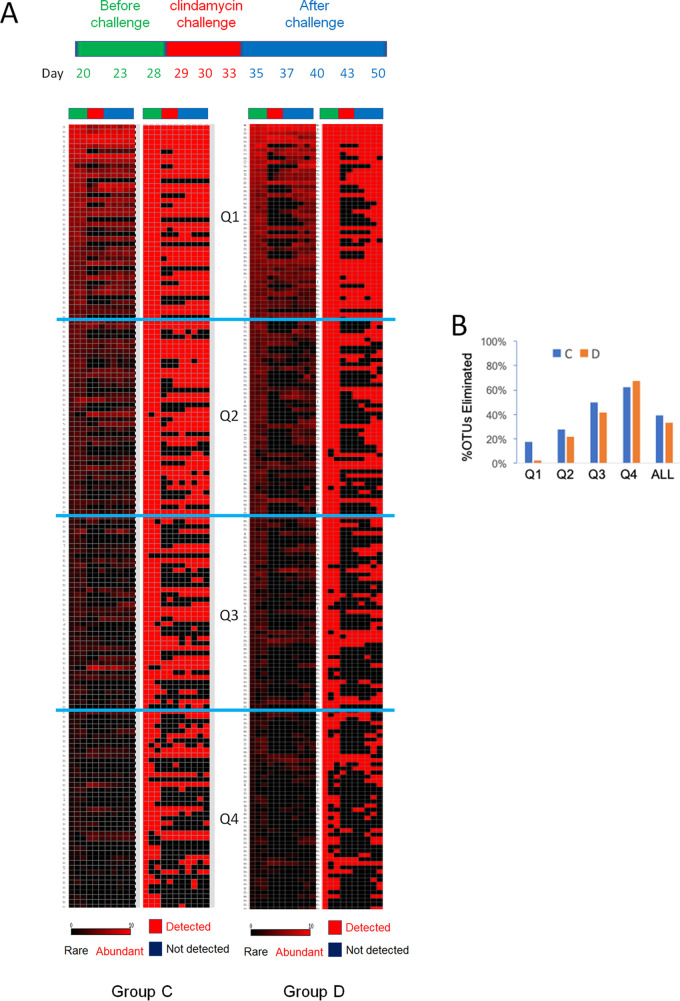
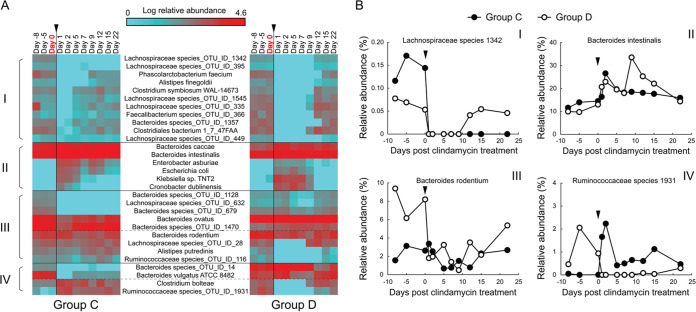
Antibiotics are known to induce gut dysbiosis and increase the risk of antibiotic resistance. While antibiotic exposure is a known risk factor leading to compromised colonization resistance against enteric pathogens such as Clostridioides difficile, the extent and consequences of antibiotic perturbation on the human gut microbiome remain poorly understood. Human studies on impacts of antibiotics are complicated by the tremendous variability of gut microbiome among individuals, even between identical twins. Furthermore, antibiotic challenge experiments cannot be replicated in human subjects for a given gut microbiome. Here, we transplanted feces from three unrelated human donors into groups of identical germfree (GF) Swiss-Webster mice, and examined the temporal responses of the transplanted microbiome to oral clindamycin challenge in gnotobiotic isolators over 7 weeks. Analysis of 177 longitudinal fecal samples revealed that 59% to 81% of human microbiota established a stable configuration rapidly and stably in GF mice. Microbiome responses to clindamycin challenge was highly reproducible and microbiome-dependent. A short course of clindamycin was sufficient to induce a profound loss (∼one third) of the microbiota by disproportionally eliminating minority members of the transplanted microbiota. However, it was inadequate to disrupt the global microbial community structure or function, which rebounded rapidly to resemble its pre-treatment state after clindamycin discontinuation. Furthermore, the response of individual microbes was community-dependent. Taken together, these results suggest that the overall gut microbiome structure is resilient to antibiotic perturbation, the functional consequences of which warrant further investigation. IMPORTANCE Antibiotics cause imbalance of gut microbiota, which in turn increase our susceptibility to gastrointestinal infections. However, how antibiotics disrupt gut bacterial communities is not well understood, and exposing healthy volunteers to unnecessary antibiotics for research purposes carries clinical and ethical concerns. In this study, we used genetically identical mice transplanted with the same human gut microbiota to control for both genetic and environmental variables. We found that a short course of oral clindamycin was sufficient to eliminate one third of the gut bacteria by disproportionally eliminating minority members of the transplanted microbiota, but it was inadequate to disrupt the overall microbial community structure and function, which rebounded rapidly to its pre-treatment state. These results suggest that gut microbiome is highly resilient to antibiotic challenge and degradation of the human gut ecosystem may require repeated or prolonged antibiotic exposure.

Keywords: clindamycin; gut dysbiosis; humanized gnotobiotic mice; microbiome; resilience.


Conflict of interest statement

The authors declare no conflict of interest.

Figures

FIG 1
FIG 1
Study design. Swiss-Webster germfree (GF) mice were gavaged with fecal samples from three unrelated healthy human donors or reduced PBS as mock control, and maintained in four different isolators. After 4 weeks, two groups of ex-GF mice and one group of GF mice were challenged with clindamycin or given sterile drinking water as controls (n = 3 per group) for 5 days. Murine fecal samples were collected longitudinally throughout the experiment and stored in a −20°C freezer for 16S rRNA analysis.
FIG 2
FIG 2
Unifrac analysis of fecal microbiota from human donors and recipient mice. Human fecal samples from three unrelated healthy volunteers (highlighted dots) were gavaged into male Swiss Webster GF mice in three separate isolators (n = 12 mice per isolator) and fecal samples were collected from each animal longitudinally. Temporal variation in fecal microbiota was examined using 16S rRNA analysis (four to five time points from three animals per group were analyzed). (A) Unweighted (left) and weighted (right) Unifrac was used to generate distances among all microbiome samples. Scatterplots were then generated using principal coordinate analysis (PCA). The percentage of variation explained by each principal coordinate (PC) is indicated on the axes. Each point represents a microbial community. d1, day 1 postcolonization; d3 to d20, day 3 through day 20; each color represents a unique donor inoculum. (B) Microbial richness (% OTUs) and diversity (Shannon Index) were compared between donor human microbiota (D) and transplanted microbiota established in GF mice.
FIG 3
FIG 3
Changes in gut microbial diversity and richness in response to oral clindamycin challenge. (A) Species richness (observed OTUs) and (B) Shannon diversity (entropy) of fecal microbiota before and after 5 days of clindamycin or mock treatment are shown on the y-axes. Mean values are compared between the clindamycin group (solid circles) and the saline controls (empty squares). No statistically significant difference was observed in OTU numbers or Shannon entropy between the two groups at the three time points prior to clindamycin treatment (P > 0.05). A single asterisk indicates a P value of <0.05 at the corresponding time points, and double asterisks indicate a P value of <0.01.
FIG 4
FIG 4
A single course of oral clindamycin induced a rapid and reproducible disturbance in gut microbiota. Ex-GF mice harboring human gut microbiota were treated with oral clindamycin for 5 days and longitudinal fecal microbiota compared using 16S rRNA sequence analysis. Weighted (right) and unweighted (left) analyses are shown as scatterplots using Unifrac principal coordinate analysis (PCA). The percentage of variation explained by each principal coordinate (PC) is indicated on the corresponding axes. Each color point represents a microbial community and samples from the same animal are shown using the same color dots. In unweighted Unifrac (top left), microbial communities before clindamycin treatment, 3 to 5 days after clindamycin, and 2 weeks after clindamycin clustered separately. In contrast, weighted Unifrac (top left) showed tighter clustering of microbial communities before and after clindamycin challenge. Circles and arrows in blue and red represent microbial communities from two different donor microbiome, C and D, respectively. Fecal microbiome before and after clindamycin challenge were compared and the statistical significance of the microbiome difference before and after clindamycin was determined using permutational multivariate analysis of variance (PERMANOVA) and the P values for group C and D are shown in blue and red, respectively. Ex-GF control mice treated with sterile water showed no appreciable changes in gut microbiome throughout the experiment (bottom left and right).
FIG 5
FIG 5
Clindamycin challenge disproportionally eliminates minority members of the transplanted microbiota. Two groups of humanized mice (group C and group D, see Fig. 1) were challenged with 5 days of clindamycin, and longitudinal fecal microbiome were analyzed. (A) For each group (C and D), two heatmaps are shown. The heatmap on the left shows the relative abundance of OTUs (red: high abundance; black: low abundance), and the heatmap on the right indicates OTUs detected (red) or not detected (black). Each column represents samples from a specific time point (from left to right, before clindamycin challenge: day 20, 23, 28; during clindamycin challenge: day 29, 30, 33; after challenge: day 35, 37. 40, 43, and 50; see Fig. 1). Each row is an OTU, ordered from top to bottom by the relative abundance of the OTU on day 20. OTUs were binned by quartiles (Q1 to Q4). Q1 includes top 25% OTUs in relative abundance on day 20, whereas Q4 includes the bottom 25% OTUs representing minority or low abundance OTUs. (B) The proportion of OTUs eliminated by clindamycin challenge in each quartile. A high percentage of OTUs in Q4 (i.e., minority OTUs) were eliminated by clindamycin challenge, and a low proportion of OTUs in Q1 were eliminated. Overall, approximately one third of OTUs were eliminated (“ALL”).
FIG 6
FIG 6
Community-dependent response of gut-associated microbes to clindamycin challenge. (A) Heat map of relative abundance of gut-associated microbes showing community-dependent, individualized response to clindamycin challenge. Mean values were used for both groups. Relative abundance is expressed as log10 (percent relative abundance x 100,000) for better visualization of minority species. The log value scale is shown on top. Post-treatment days are indicated above the heat map with pre-treatment baseline bolded in red and the black arrowhead indicating the start of 5-day clindamycin treatment. Four major response patterns were observed: (I) suppressed in both mice groups; (II) enriched in both groups; (III) suppressed in one group but fluctuating or no significant change in the other; and (IV) suppressed in one group but enriched in the other. The taxonomy of each bacterial species is shown in-between the heat maps. (B) Temporal changes of the relative abundance of a representative species from each group are shown. Black arrowheads indicate the start of clindamycin challenge.
FIG 7
FIG 7
Differential responses of Firmicutes, Bacteroidetes, and Proteobacteria species to clindamycin challenge. A maximum likelihood tree was constructed using representative 16S rRNA sequences of the 30 shared bacterial species from Fig. 6. The response patterns (I through IV) to clindamycin challenge for each species as shown in Fig. 5 is indicated. The three major phyla are depicted in red (Firmicutes), blue (Proteobacteria), and green (Bacteroidetes) branches.

Similar articles

Cited by

References

    1. Ananthakrishnan AN. 2011. Clostridium difficile infection: epidemiology, risk factors and management. Nat Rev Gastroenterol Hepatol 8:17–26. doi:10.1038/nrgastro.2010.190. - DOI - PubMed
    1. Lessa FC, Mu Y, Bamberg WM, Beldavs ZG, Dumyati GK, Dunn JR, Farley MM, Holzbauer SM, Meek JI, Phipps EC, Wilson LE, Winston LG, Cohen JA, Limbago BM, Fridkin SK, Gerding DN, McDonald LC. 2015. Burden of clostridium difficile infection in the United States. N Engl J Med 372:825–834. doi:10.1056/NEJMoa1408913. - DOI - PMC - PubMed
    1. Musso G, Gambino R, Cassader M. 2010. Obesity, diabetes, and gut microbiota: the hygiene hypothesis expanded? Diabetes Care 33:2277–2284. doi:10.2337/dc10-0556. - DOI - PMC - PubMed
    1. Diaz Heijtz R, Wang S, Anuar F, Qian Y, Björkholm B, Samuelsson A, Hibberd ML, Forssberg H, Pettersson S. 2011. Normal gut microbiota modulates brain development and behavior. Proc Natl Acad Sci USA 108:3047–3052. doi:10.1073/pnas.1010529108. - DOI - PMC - PubMed
    1. Marchesi JR, Adams DH, Fava F, Hermes GDA, Hirschfield GM, Hold G, Quraishi MN, Kinross J, Smidt H, Tuohy KM, Thomas LV, Zoetendal EG, Hart A. 2016. The gut microbiota and host health: a new clinical frontier. Gut 65:330–339. doi:10.1136/gutjnl-2015-309990. - DOI - PMC - PubMed

Publication types