. 2022 Jan;3(1):66-81.
doi: 10.1158/2643-3230.BCD-21-0095. Epub 2021 Dec 1.

Next-Generation Sequencing of Minimal Residual Disease for Predicting Relapse after Tisagenlecleucel in Children and Young Adults with Acute Lymphoblastic Leukemia

Affiliations

Next-Generation Sequencing of Minimal Residual Disease for Predicting Relapse after Tisagenlecleucel in Children and Young Adults with Acute Lymphoblastic Leukemia

Michael A Pulsipher et al. Blood Cancer Discov. 2022 Jan.

Abstract

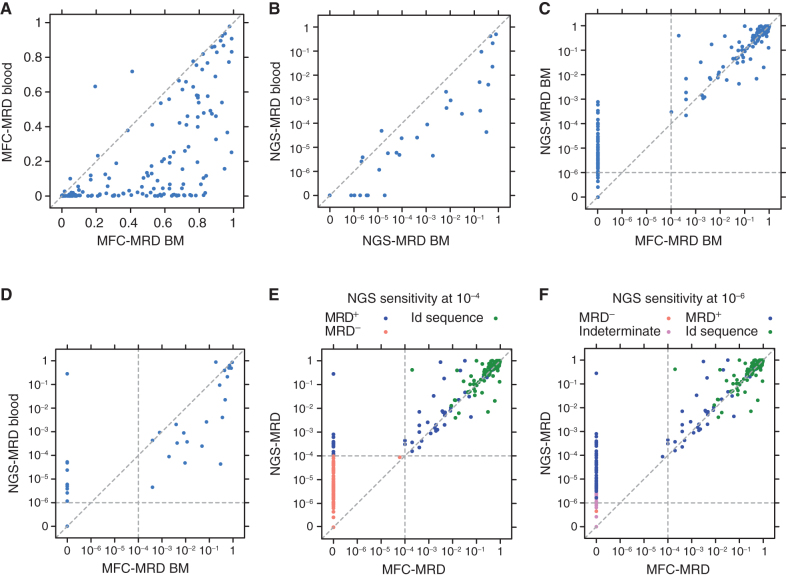
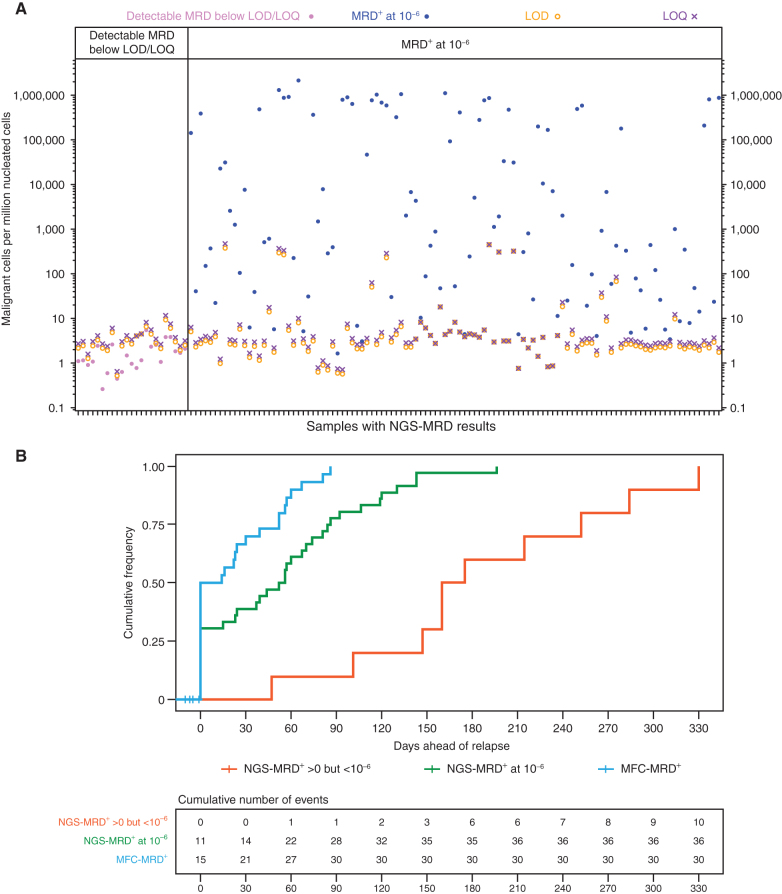
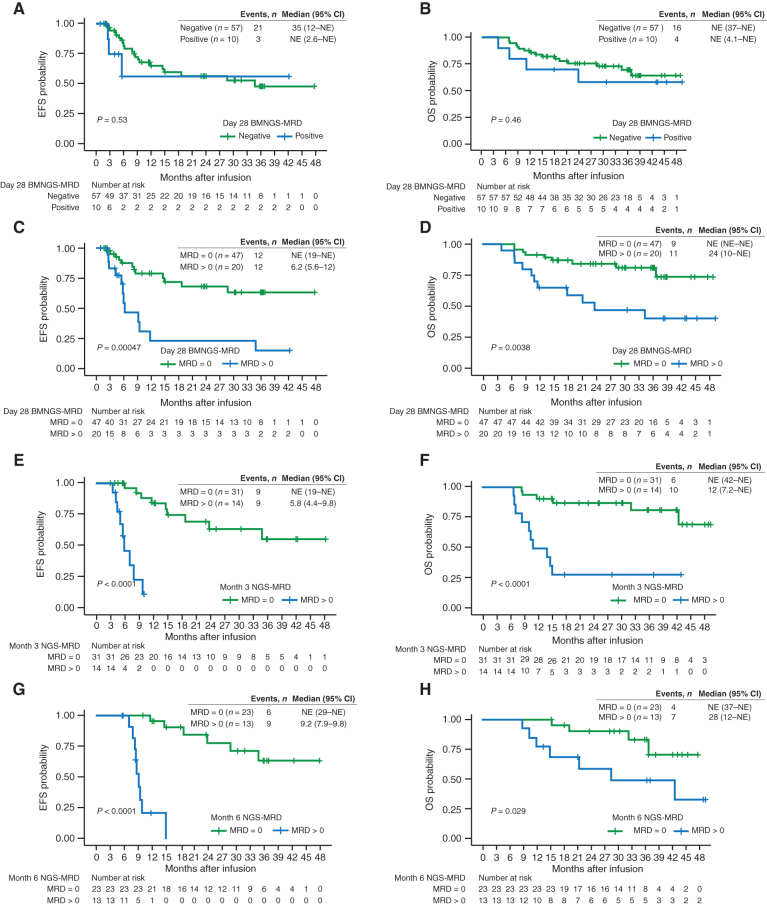
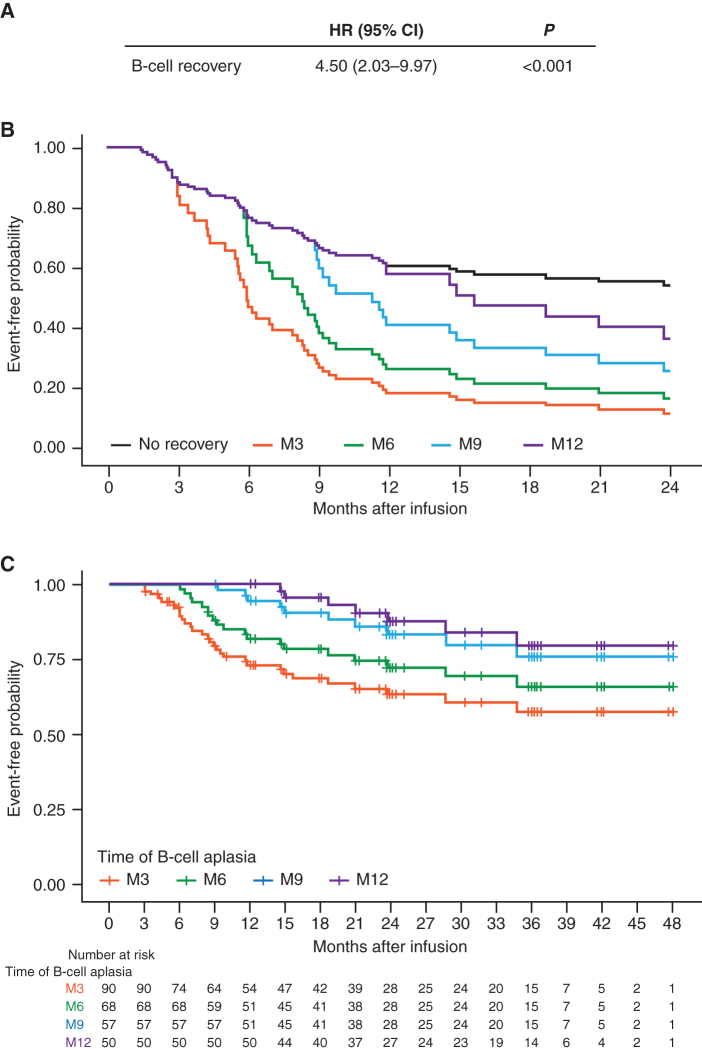
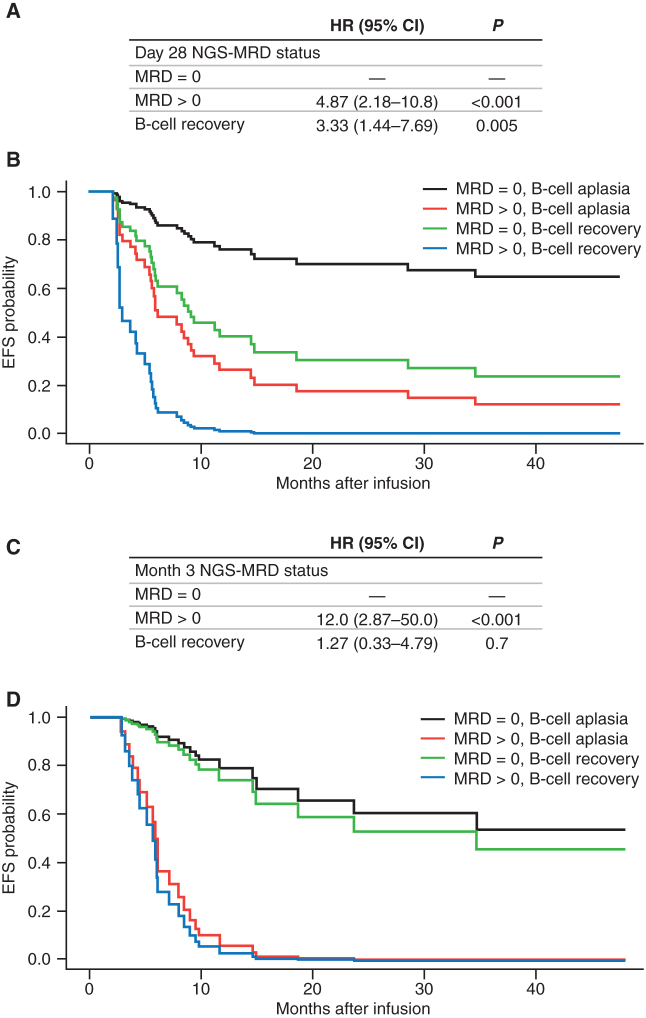
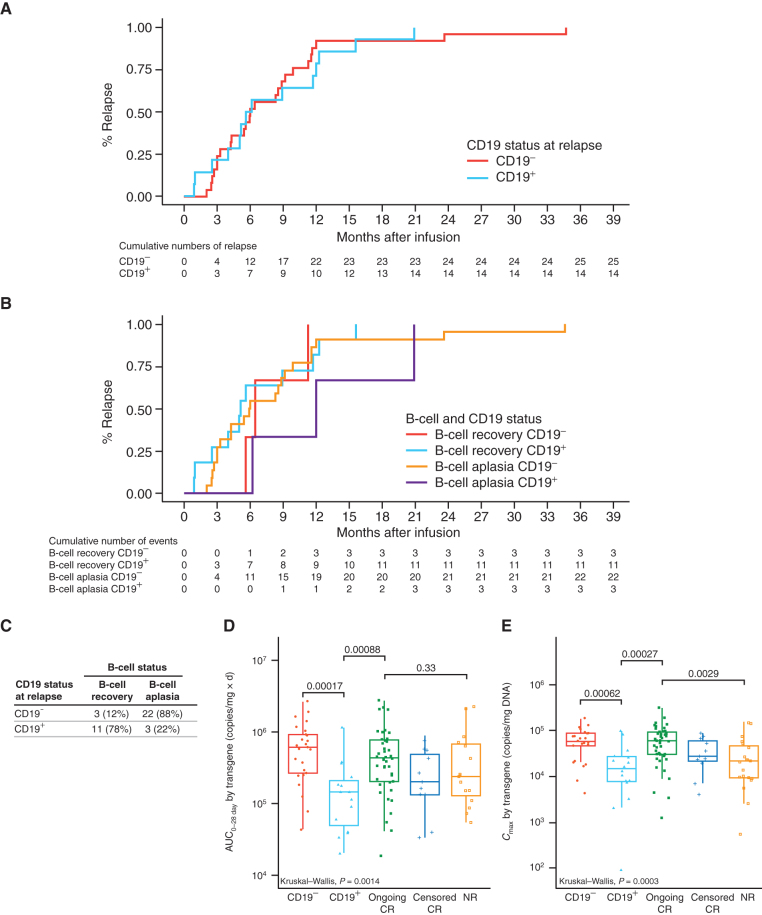
We assessed minimal residual disease (MRD) detection and B-cell aplasia after tisagenlecleucel therapy for acute lymphoblastic leukemia (ALL) to define biomarkers predictive of relapse (N = 143). Next-generation sequencing (NGS) MRD detection >0 in bone marrow (BM) was highly associated with relapse. B-cell recovery [signifying loss of functional chimeric antigen receptor (CAR) T cells] within the first year of treatment was associated with a hazard ratio (HR) for relapse of 4.5 [95% confidence interval (CI), 2.03-9.97; P < 0.001]. Multivariate analysis at day 28 showed independent associations of BMNGS-MRD >0 (HR = 4.87; 95% CI, 2.18-10.8; P < 0.001) and B-cell recovery (HR = 3.33; 95% CI, 1.44-7.69; P = 0.005) with relapse. By 3 months, the BMNGS-MRD HR increased to 12 (95% CI, 2.87-50; P < 0.001), whereas B-cell recovery was not independently predictive (HR = 1.27; 95% CI, 0.33-4.79; P = 0.7). Relapses occurring with persistence of B-cell aplasia were largely CD19- (23/25: 88%). Detectable BMNGS-MRD reliably predicts risk with sufficient time to consider approaches to relapse prevention such as hematopoietic cell transplantation (HCT) or second CAR-T cell infusion. SIGNIFICANCE: Detectable disease by BMNGS-MRD with or without B-cell aplasia is highly predictive of relapse after tisagenlecleucel therapy for ALL. Clonotypic rearrangements used to follow NGS-MRD did not change after loss of CD19 or lineage switch. High-risk patients identified by these biomarkers may benefit from HCT or investigational cell therapies.See related commentary by Ghorashian and Bartram, p. 2.This article is highlighted in the In This Issue feature, p. 1.


Figures

Figure 1. Comparisons of the sensitivity of MFC-MRD and NGS-MRD from peripheral blood and BM. Vertical and horizonal dotted lines represent the sensitivity cutoff for MFC and NGS, respectively. A, MFC-MRD from blood (y-axis) compared with samples from the same time point obtained from BM (x-axis); n = 450. B, NGS-MRD from blood (y-axis) compared with samples from the same time point obtained from BM (x-axis); n = 66. C, NGS-MRD from BM (y-axis) compared with MFC-MRD from BM (x-axis) in all matched samples; n = 280. D, NGS-MRD from blood (y-axis) compared with MFC-MRD from BM (x-axis) in all matched samples; n = 77. E, NGS-MRD compared with MFC-MRD in all matched samples with an NGS sensitivity cutoff of 10−4. F, NGS-MRD compared with MFC-MRD in all matched samples with an NGS sensitivity cutoff of 10−6. E and F, Green, red, blue, and purple dots represent baseline index clones, NGS-MRD−, NGS-MRD+, and NGS-MRD indeterminate (insufficient number of cells to determine MRD), respectively.
Figure 1.
Comparisons of the sensitivity of MFC-MRD and NGS-MRD from peripheral blood and BM. Vertical and horizonal dotted lines represent the sensitivity cutoff for MFC and NGS, respectively. A, MFC-MRD from blood (y-axis) compared with samples from the same time point obtained from BM (x-axis); n = 450. B, NGS-MRD from blood (y-axis) compared with samples from the same time point obtained from BM (x-axis); n = 66. C, NGS-MRD from BM (y-axis) compared with MFC-MRD from BM (x-axis) in all matched samples; n = 280. D, NGS-MRD from blood (y-axis) compared with MFC-MRD from BM (x-axis) in all matched samples; n = 77. E, NGS-MRD compared with MFC-MRD in all matched samples with an NGS sensitivity cutoff of 10−4. F, NGS-MRD compared with MFC-MRD in all matched samples with an NGS sensitivity cutoff of 10−6. E and F, Green, red, blue, and purple dots represent baseline index clones, NGS-MRD−, NGS-MRD+, and NGS-MRD indeterminate (insufficient number of cells to determine MRD), respectively.
Figure 2. Characteristics of NGS-reported MRD values and their associated lead times ahead of clinical relapse. A, Characteristics of reported values for BMNGS-MRD; x-axis represents individual samples, and y-axis represents a quantitative measure of MRD (normalized number of malignant cells in 1 million nucleated cells). For each sample, there is an LOD (shown by an orange circle) and an LOQ (shown by a purple ×). These quantities are directly proportional to the number of cells provided to the assay; samples with higher numbers of input cells allow more reliable detection and quantitation of residual disease at low levels. Positive test values below the LOD suggest that although residual disease is likely present, it might not be observed again if a repeat test of the same sample source (blood or marrow) were sent. Positive test values below the LOQ imply that the reported MRD frequencies may be inaccurate, although such values may be of the correct order of magnitude. The left panel shows samples that were detectable but below the LOD and LOQ, whereas the right panel shows samples that were considered positive (above LOD and LOQ) at the cutoff level of 10−6. B, Cumulative frequencies to overt relapse after patients achieved MFC-MRD+ (blue line), NGS-MRD+ at 10−6 level (green), and NGS-MRD+ below the 10−6 level but still detectable (red) were plotted using the Kaplan–Meier method.
Figure 2.
Characteristics of NGS-reported MRD values and their associated lead times ahead of clinical relapse. A, Characteristics of reported values for BMNGS-MRD; x-axis represents individual samples, and y-axis represents a quantitative measure of MRD (normalized number of malignant cells in 1 million nucleated cells). For each sample, there is an LOD (shown by an orange circle) and an LOQ (shown by a purple ×). These quantities are directly proportional to the number of cells provided to the assay; samples with higher numbers of input cells allow more reliable detection and quantitation of residual disease at low levels. Positive test values below the LOD suggest that although residual disease is likely present, it might not be observed again if a repeat test of the same sample source (blood or marrow) were sent. Positive test values below the LOQ imply that the reported MRD frequencies may be inaccurate, although such values may be of the correct order of magnitude. The left panel shows samples that were detectable but below the LOD and LOQ, whereas the right panel shows samples that were considered positive (above LOD and LOQ) at the cutoff level of 10−6. B, Cumulative frequencies to overt relapse after patients achieved MFC-MRD+ (blue line), NGS-MRD+ at 10−6 level (green), and NGS-MRD+ below the 10−6 level but still detectable (red) were plotted using the Kaplan–Meier method.
Figure 3. CR/CRi patients with detectable BMNGS-MRD at the end of day 28, month 3, and month 6 after tisagenlecleucel therapy had significantly shorter EFS and OS by Kaplan–Meier analyses, with the log-rank test P values included. EFS (A) and OS (B) of responding patients with BMNGS-MRD− based on cutoff of 10−6 at day 28 (green line) versus those with BMNGS-MRD+ (blue lines). EFS (C) and OS (D) of responding patients based on detection of BMNGS-MRD at 28 days at any level (blue lines) compared with patients with BMNGS-MRD = 0 (green lines). EFS (E) and OS (F) of responding patients based on detection of NGS-MRD at 3 months at any level (blue lines) compared with patients with BMNGS-MRD = 0 (green lines). EFS (G) and OS (H) of responding patients based on detection of BMNGS-MRD at 6 months at any level (blue lines) compared with patients with BMNGS-MRD = 0 (green lines). CI, confidence interval; NE, not estimable.
Figure 3.
CR/CRi patients with detectable BMNGS-MRD at the end of day 28, month 3, and month 6 after tisagenlecleucel therapy had significantly shorter EFS and OS by Kaplan–Meier analyses, with the log-rank test P values included. EFS (A) and OS (B) of responding patients with BMNGS-MRD− based on cutoff of 10−6 at day 28 (green line) versus those with BMNGS-MRD+ (blue lines). EFS (C) and OS (D) of responding patients based on detection of BMNGS-MRD at 28 days at any level (blue lines) compared with patients with BMNGS-MRD = 0 (green lines). EFS (E) and OS (F) of responding patients based on detection of NGS-MRD at 3 months at any level (blue lines) compared with patients with BMNGS-MRD = 0 (green lines). EFS (G) and OS (H) of responding patients based on detection of BMNGS-MRD at 6 months at any level (blue lines) compared with patients with BMNGS-MRD = 0 (green lines). CI, confidence interval; NE, not estimable.
Figure 4. Univariate Cox model to assess the time-dependent effect of B-cell recovery on EFS. A, HR, confidence interval, and P value for the risk of relapse once patients had B-cell recovery within 1 year after infusion. B, Adjusted EFS curves based on the Cox model from A for patients with B-cell recovery by month 3 (M3), month 6 (M6), month 9 (M9), and month 12 (M12). C, Landmark EFS analysis for patients with persistent B-cell aplasia and reaching M3, M6, M9, and M12.
Figure 4.
Univariate Cox model to assess the time-dependent effect of B-cell recovery on EFS. A, HR, confidence interval, and P value for the risk of relapse once patients had B-cell recovery within 1 year after infusion. B, Adjusted EFS curves based on the Cox model from A for patients with B-cell recovery by month 3 (M3), month 6 (M6), month 9 (M9), and month 12 (M12). C, Landmark EFS analysis for patients with persistent B-cell aplasia and reaching M3, M6, M9, and M12.
Figure 5. Multivariate Cox proportional hazards analyses for EFS combining BMNGS-MRD status (fixed times at day 28 or month 3) and B-cell recovery (time-dependent covariate). A, Results from multivariate Cox model for EFS using day 28 BMNGS-MRD status and B-cell recovery data within the first year (n = 66). B, Adjusted EFS curves based on the Cox model in A. C, Results from multivariate Cox model for EFS using month 3 BMNGS-MRD status and B-cell recovery data within the first year (n = 45). D, Adjusted EFS curves based on the Cox model in C.
Figure 5.
Multivariate Cox proportional hazards analyses for EFS combining BMNGS-MRD status (fixed times at day 28 or month 3) and B-cell recovery (time-dependent covariate). A, Results from multivariate Cox model for EFS using day 28 BMNGS-MRD status and B-cell recovery data within the first year (n = 66). B, Adjusted EFS curves based on the Cox model in A. C, Results from multivariate Cox model for EFS using month 3 BMNGS-MRD status and B-cell recovery data within the first year (n = 45). D, Adjusted EFS curves based on the Cox model in C.
Figure 6. Comparison of time to relapse, B-cell recovery incidence, and tisagenlecleucel expansion in CD19− and CD19+ relapse patients. A, Kaplan–Meier (KM) analysis for time to relapse by CD19 status: CD19- (red) and CD19+ (aqua). B, KM analysis for cumulative incidence of relapse by B-cell recovery and CD19 status: B-cell recovery plus CD19- (red), B-cell recovery plus CD19+ (green), B-cell aplasia plus CD19- (aqua), and B-cell aplasia plus CD19+ (purple). C, Relapses according to CD19 status and the presence or absence of B-cell recovery. AUC0–28d (D) and Cmax (E) of transgene levels in patients with CD19- relapse, CD19+ relapse, ongoing CR more than 1 year, CR censored for other therapy or HCT within the first year, and nonresponders (NR). Kruskal–Wallis P values indicate the significance difference in mean levels among different groups. Numbers above the brackets are pairwise comparison P values.
Figure 6.
Comparison of time to relapse, B-cell recovery incidence, and tisagenlecleucel expansion in CD19 and CD19+ relapse patients. A, Kaplan–Meier (KM) analysis for time to relapse by CD19 status: CD19- (red) and CD19+ (aqua). B, KM analysis for cumulative incidence of relapse by B-cell recovery and CD19 status: B-cell recovery plus CD19- (red), B-cell recovery plus CD19+ (green), B-cell aplasia plus CD19- (aqua), and B-cell aplasia plus CD19+ (purple). C, Relapses according to CD19 status and the presence or absence of B-cell recovery. AUC0–28d (D) and Cmax (E) of transgene levels in patients with CD19- relapse, CD19+ relapse, ongoing CR more than 1 year, CR censored for other therapy or HCT within the first year, and nonresponders (NR). Kruskal–Wallis P values indicate the significance difference in mean levels among different groups. Numbers above the brackets are pairwise comparison P values.

Comment in

References

    1. Maude SL, Laetsch TW, Buechner J, Rives S, Boyer M, Bittencourt Het al. . Tisagenlecleucel in children and young adults with B-cell lymphoblastic leukemia. N Engl J Med 2018;378:439–48. - PMC - PubMed
    1. Sun W, Malvar J, Sposto R, Verma A, Wilkes JJ, Dennis Ret al. . Outcome of children with multiply relapsed B-cell acute lymphoblastic leukemia: a therapeutic advances in childhood leukemia & lymphoma study. Leukemia 2018;32:2316–25. - PMC - PubMed
    1. Emily Whitehead Foundation [homepage on the Internet]. Philipsburg (PA): Emily Whitehead Foundation; 2014–2021 [cited 2021 Oct 28]. Available from: https://emilywhiteheadfoundation.org/our-journey/.
    1. Gardner RA, Finney O, Annesley C, Brakke H, Summers C, Leger Ket al. . Intent-to-treat leukemia remission by CD19 CAR T cells of defined formulation and dose in children and young adults. Blood 2017;129:3322–31. - PMC - PubMed
    1. Maude SL, Frey N, Shaw PA, Aplenc R, Barrett DM, Bunin NJet al. . Chimeric antigen receptor T cells for sustained remissions in leukemia. N Engl J Med 2014;371:1507–17. - PMC - PubMed

Publication types