. 2022 Jan;3(1):16-31.
doi: 10.1158/2643-3230.BCD-20-0216. Epub 2021 Oct 11.

Multiomic Profiling of Central Nervous System Leukemia Identifies mRNA Translation as a Therapeutic Target

Affiliations

Multiomic Profiling of Central Nervous System Leukemia Identifies mRNA Translation as a Therapeutic Target

Robert J Vanner et al. Blood Cancer Discov. 2022 Jan.

Abstract

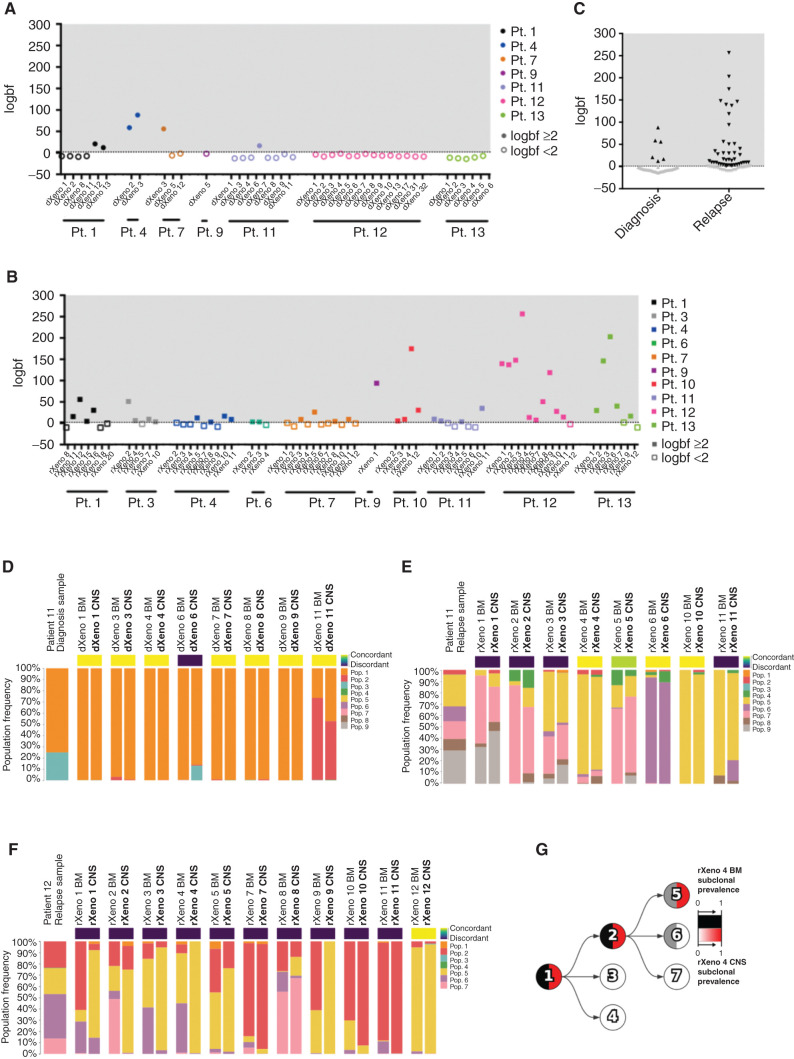
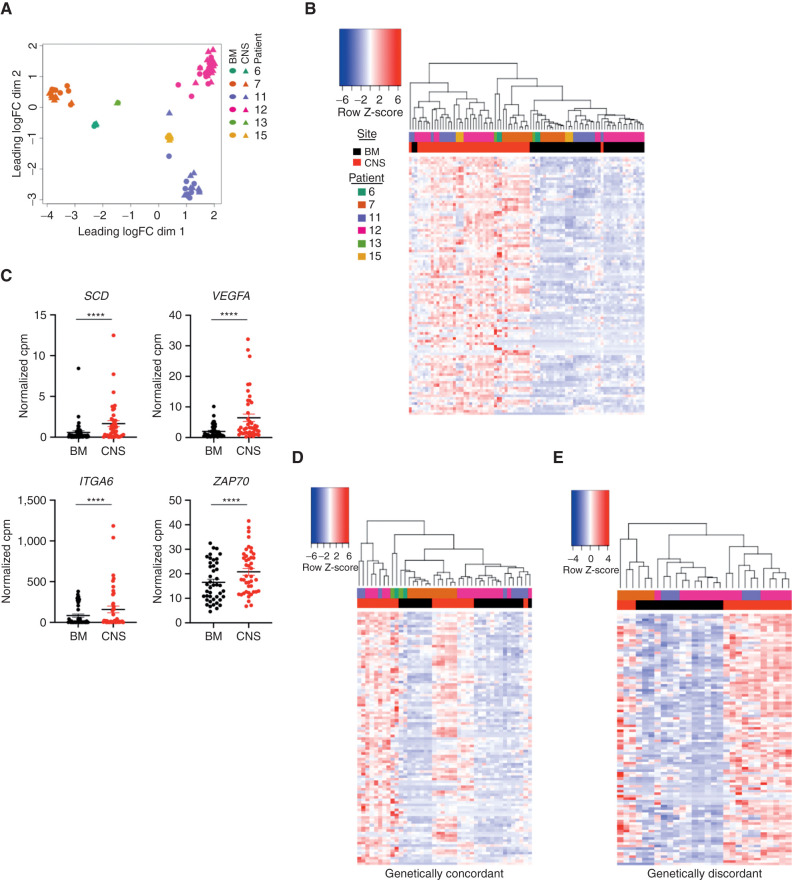
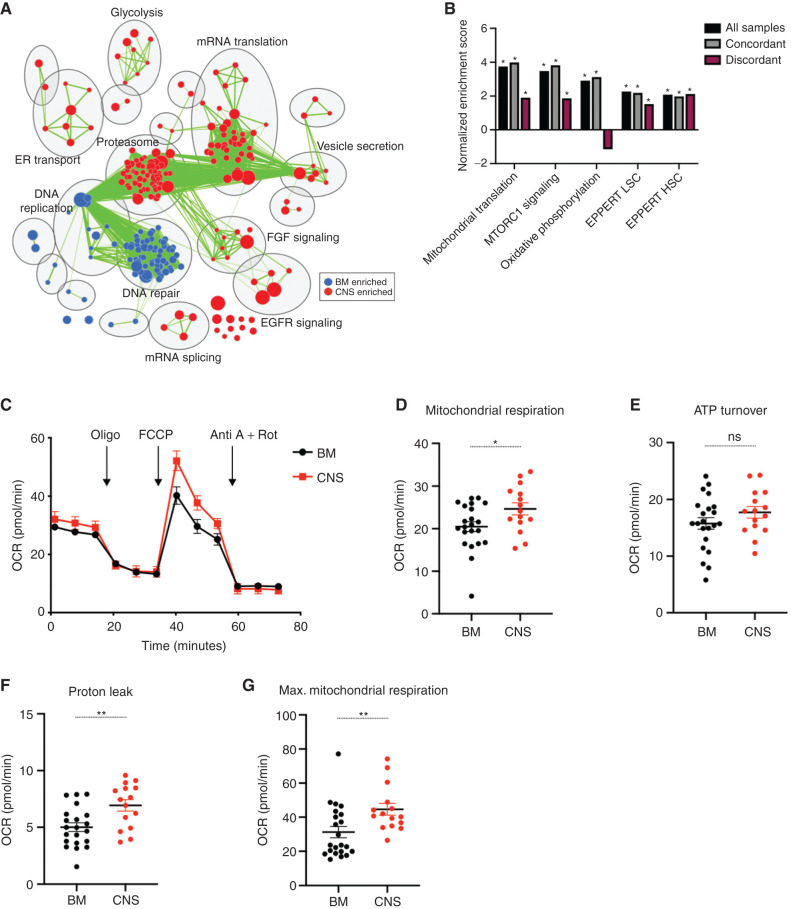
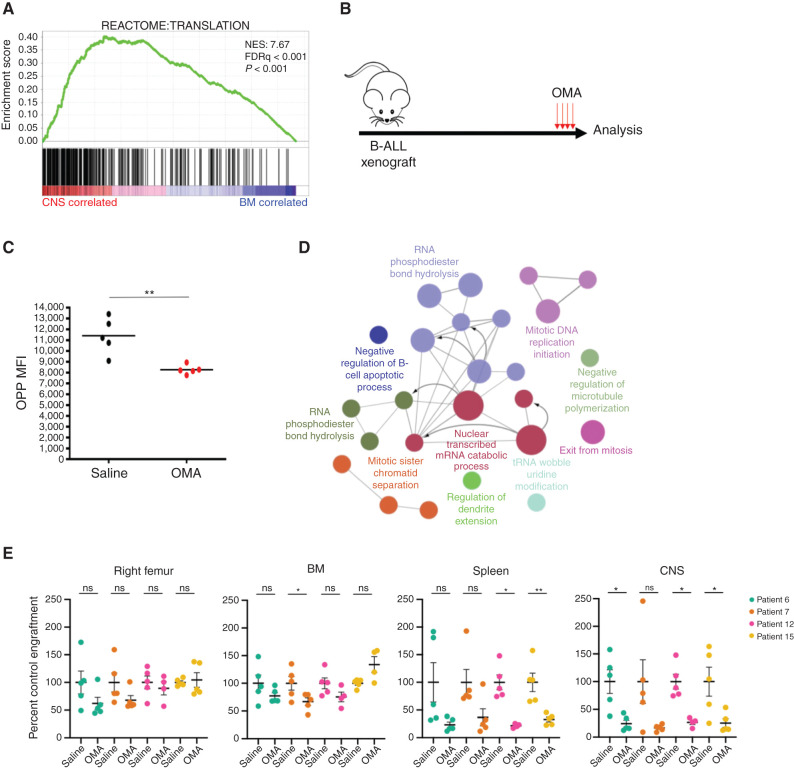
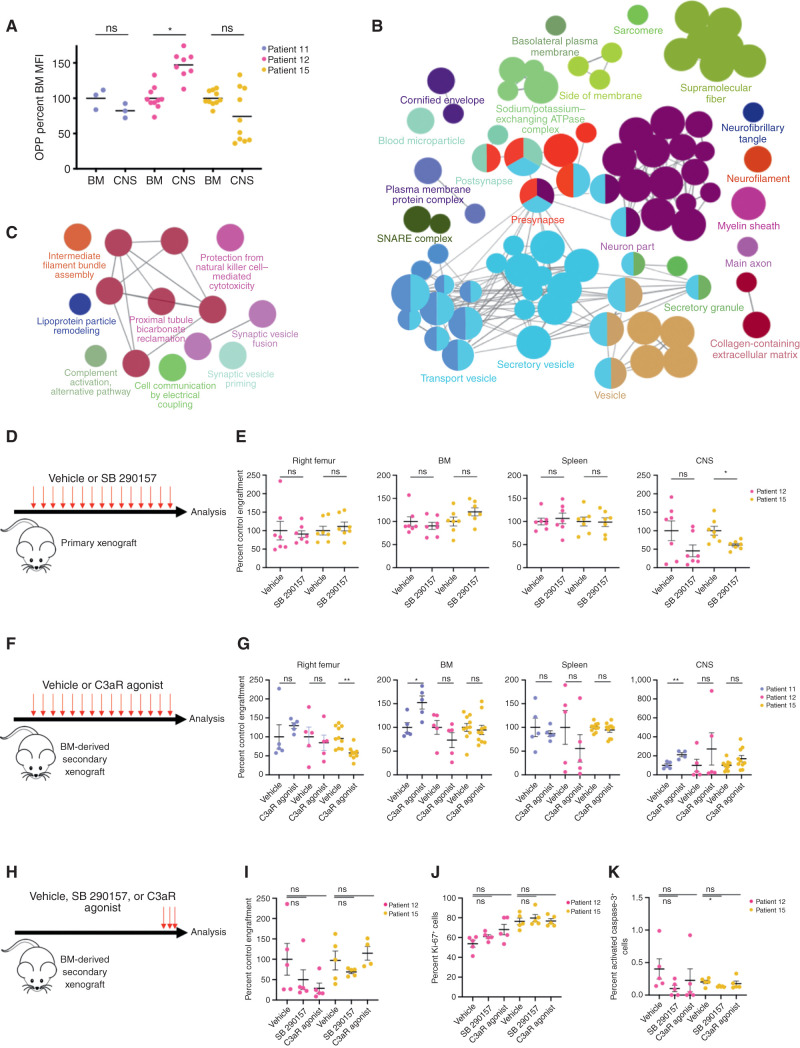
Central nervous system (CNS) dissemination of B-precursor acute lymphoblastic leukemia (B-ALL) has poor prognosis and remains a therapeutic challenge. Here we performed targeted DNA sequencing as well as transcriptional and proteomic profiling of paired leukemia-infiltrating cells in the bone marrow (BM) and CNS of xenografts. Genes governing mRNA translation were upregulated in CNS leukemia, and subclonal genetic profiling confirmed this in both BM-concordant and BM-discordant CNS mutational populations. CNS leukemia cells were exquisitely sensitive to the translation inhibitor omacetaxine mepesuccinate, which reduced xenograft leptomeningeal disease burden. Proteomics demonstrated greater abundance of secreted proteins in CNS-infiltrating cells, including complement component 3 (C3), and drug targeting of C3 influenced CNS disease in xenografts. CNS-infiltrating cells also exhibited selection for stemness traits and metabolic reprogramming. Overall, our study identifies targeting of mRNA translation as a potential therapeutic approach for B-ALL leptomeningeal disease. SIGNIFICANCE: Cancer metastases are often driven by distinct subclones with unique biological properties. Here we show that in B-ALL CNS disease, the leptomeningeal environment selects for cells with unique functional dependencies. Pharmacologic inhibition of mRNA translation signaling treats CNS disease and offers a new therapeutic approach for this condition.This article is highlighted in the In This Issue feature, p. 1.


Figures

Figure 1. Differences in clonal composition of BM and CNS B-ALL xenograft engraftment. Mutational population genetic concordance or discordance of CNS blasts as determined using Bayes factors comparing the concordant model, whereby a mouse's BM/CNS samples share mutational population frequencies, with the discordant model, whereby a BM/CNS sample pair can have different mutational population frequencies. We show the logarithm of the Bayes factor (“logbf,” base 10) for the discordant model versus the concordant model for each sample pair in diagnosis xenografts (A; patient 1 n = 6 xenografts; patient 4 n = 2 xenografts; patient 7 n = 3 xenografts; patient 9 n = 1 xenograft; patient 11 n = 8 xenografts; patient 12 n = 14 xenografts; and patient 13 n = 6 xenografts) or relapse xenografts (B; patient 1 n = 7 xenografts; patient 3 n = 5 xenografts; patient 4 n = 9 xenografts; patient 6 n = 3 xenografts; patient 7 n = 11 xenografts; patient 9 n = 1 xenograft; patient 10 n = 4 xenografts; patient 11 n = 8 xenografts; patient 12 n = 11 xenografts; and patient 13 n = 7 xenografts). We used a threshold of logbf e2 to declare discordance for each mouse represented by the dotted line, reflecting that the discordant model was at least 100 times more likely than the concordant model. Filled-in data points have a logbf e2, whereas data points with no fill color have a logbf <2. C, Summary of concordance and discordance calls in diagnosis and relapse patient samples. Black data points have a logbf e2, whereas gray data points have a logbf <2. Mutational population frequencies were computed using Pairtree from patient 11 diagnosis (D; n = 8 xenografts), patient 11 relapse (E; n = 8 xenografts), and patient 12 relapse (F; n = 11 xenografts) samples. (Patient 12 diagnosis in Supplementary Fig. S1I.) G, Evolutionary trajectory of mutational populations for patient 12 is shown in a clone tree determined using Pairtree. Each mutational population is shown as a tree node, with edges indicating evolutionary descent. Each node shows the relative prevalence of mutational population lineages, consisting of mutational populations and their descendants, in BM (black, left half of node) and CNS (red, right half of node) within relapse xenograft 4 from patient 12. Pop., population; Pt., patient. dXeno represents xenografts generated from diagnosis patient samples, and rXeno represents xenografts generated from relapse patient samples.
Figure 1.
Differences in clonal composition of BM and CNS B-ALL xenograft engraftment. Mutational population genetic concordance or discordance of CNS blasts as determined using Bayes factors comparing the concordant model, whereby a mouse's BM/CNS samples share mutational population frequencies, with the discordant model, whereby a BM/CNS sample pair can have different mutational population frequencies. We show the logarithm of the Bayes factor (“logbf,” base 10) for the discordant model versus the concordant model for each sample pair in diagnosis xenografts (A; patient 1 n = 6 xenografts; patient 4 n = 2 xenografts; patient 7 n = 3 xenografts; patient 9 n = 1 xenograft; patient 11 n = 8 xenografts; patient 12 n = 14 xenografts; and patient 13 n = 6 xenografts) or relapse xenografts (B; patient 1 n = 7 xenografts; patient 3 n = 5 xenografts; patient 4 n = 9 xenografts; patient 6 n = 3 xenografts; patient 7 n = 11 xenografts; patient 9 n = 1 xenograft; patient 10 n = 4 xenografts; patient 11 n = 8 xenografts; patient 12 n = 11 xenografts; and patient 13 n = 7 xenografts). We used a threshold of logbf e2 to declare discordance for each mouse represented by the dotted line, reflecting that the discordant model was at least 100 times more likely than the concordant model. Filled-in data points have a logbf e2, whereas data points with no fill color have a logbf <2. C, Summary of concordance and discordance calls in diagnosis and relapse patient samples. Black data points have a logbf e2, whereas gray data points have a logbf <2. Mutational population frequencies were computed using Pairtree from patient 11 diagnosis (D; n = 8 xenografts), patient 11 relapse (E; n = 8 xenografts), and patient 12 relapse (F; n = 11 xenografts) samples. (Patient 12 diagnosis in Supplementary Fig. S1I.) G, Evolutionary trajectory of mutational populations for patient 12 is shown in a clone tree determined using Pairtree. Each mutational population is shown as a tree node, with edges indicating evolutionary descent. Each node shows the relative prevalence of mutational population lineages, consisting of mutational populations and their descendants, in BM (black, left half of node) and CNS (red, right half of node) within relapse xenograft 4 from patient 12. Pop., population; Pt., patient. dXeno represents xenografts generated from diagnosis patient samples, and rXeno represents xenografts generated from relapse patient samples.
Figure 2. BM and CNS blasts are transcriptionally distinct. A, Multidimensional scaling of RNA-seq gene counts from matched BM (cells from bilateral femurs and tibias; circles) and CNS (triangles) xenografts derived from patient 6 (n = 2 mice), patient 7 (n = 10 mice), patient 11 (n = 9 mice), patient 12 (n = 18 mice), patient 13 (n = 1 mouse), and patient 15 (n = 3 mice). B, Unsupervised hierarchical clustering of matched BM and CNS xenografts based on the normalized gene counts per million (cpm) of the top 100 CNS-upregulated genes by FDR. C, Normalized counts per million for genes indicated in graph title are shown for n = 43 BM and n = 43 CNS xenografts. Line, mean; ****, FDR < 0.001 corrected for multiple hypothesis testing in edgeR. D and E, Expression of the top 100 CNS-upregulated genes from Fig. 1C in the BM and CNS of samples that were also analyzed by targeted sequencing and reported to be genetically concordant (D; n = 21) and discordant (E; n = 28) xenografts from patients 7, 11, 12, and 13, diagnosis and relapse, with samples grouped by unsupervised hierarchical clustering with expression intensity scaled by gene.
Figure 2.
BM and CNS blasts are transcriptionally distinct. A, Multidimensional scaling of RNA-seq gene counts from matched BM (cells from bilateral femurs and tibias; circles) and CNS (triangles) xenografts derived from patient 6 (n = 2 mice), patient 7 (n = 10 mice), patient 11 (n = 9 mice), patient 12 (n = 18 mice), patient 13 (n = 1 mouse), and patient 15 (n = 3 mice). B, Unsupervised hierarchical clustering of matched BM and CNS xenografts based on the normalized gene counts per million (cpm) of the top 100 CNS-upregulated genes by FDR. C, Normalized counts per million for genes indicated in graph title are shown for n = 43 BM and n = 43 CNS xenografts. Line, mean; ****, FDR < 0.001 corrected for multiple hypothesis testing in edgeR. D and E, Expression of the top 100 CNS-upregulated genes from Fig. 1C in the BM and CNS of samples that were also analyzed by targeted sequencing and reported to be genetically concordant (D; n = 21) and discordant (E; n = 28) xenografts from patients 7, 11, 12, and 13, diagnosis and relapse, with samples grouped by unsupervised hierarchical clustering with expression intensity scaled by gene.
Figure 3. CNS xenografts transcriptionally and metabolically resemble therapy-resistant cells. A, Cytoscape map of GSEA-identified differentially enriched gene sets upregulated in CNS and BM xenografts with the top 10 differentially regulated pathways labeled using AutoAnnotate. Node size is proportional to FDRq value of enrichment, and green edges indicate gene overlap between nodes. B, GSEA results showing normalized enrichment scores in CNS versus BM xenograft transcriptomes for gene sets previously associated with B-ALL chemotherapy resistance and clinical relapse in all profiled xenografts (n = 43), concordant xenografts (n = 21), and discordant xenografts (n = 28). *, FDRq score < 0.05. C, Pooled analysis of OCR measured by Seahorse XFe 96 analyzer with additions of oligomycin A (Oligo), carbonyl cyanide-4-phenylhydrazone (FCCP), antimycin A (Anti A), and rotenone (Rot) from BM and CNS KMT2A-rearranged xenografts (n = 3 mice patient 12 and n = 3 mice patient 15, n = 15 replicate wells). Basal respiration (D), ATP-linked respiration (E), proton leak respiration (F), and maximal (Max.) OCR across BM (G; n = 4 mice patient 12 and n = 4 mice patient 15, n = 22 replicate wells for D–G) and CNS (n = 3 mice patient 12 and n = 3 mice patient 15, n = 15 replicate wells for D–G) xenografts. Bars, mean ± SE; P values derived from two-sided unpaired Student t test (D–G), with *, P < 0.05; **, P < 0.01; ns, not significant.
Figure 3.
CNS xenografts transcriptionally and metabolically resemble therapy-resistant cells. A, Cytoscape map of GSEA-identified differentially enriched gene sets upregulated in CNS and BM xenografts with the top 10 differentially regulated pathways labeled using AutoAnnotate. Node size is proportional to FDRq value of enrichment, and green edges indicate gene overlap between nodes. B, GSEA results showing normalized enrichment scores in CNS versus BM xenograft transcriptomes for gene sets previously associated with B-ALL chemotherapy resistance and clinical relapse in all profiled xenografts (n = 43), concordant xenografts (n = 21), and discordant xenografts (n = 28). *, FDRq score < 0.05. C, Pooled analysis of OCR measured by Seahorse XFe 96 analyzer with additions of oligomycin A (Oligo), carbonyl cyanide-4-phenylhydrazone (FCCP), antimycin A (Anti A), and rotenone (Rot) from BM and CNS KMT2A-rearranged xenografts (n = 3 mice patient 12 and n = 3 mice patient 15, n = 15 replicate wells). Basal respiration (D), ATP-linked respiration (E), proton leak respiration (F), and maximal (Max.) OCR across BM (G; n = 4 mice patient 12 and n = 4 mice patient 15, n = 22 replicate wells for D–G) and CNS (n = 3 mice patient 12 and n = 3 mice patient 15, n = 15 replicate wells for D–G) xenografts. Bars, mean ± SE; P values derived from two-sided unpaired Student t test (D–G), with *, P < 0.05; **, P < 0.01; ns, not significant.
Figure 4. Blocking mRNA translation as a therapeutic strategy for CNS disease. A, Waveplot from GSEA in Fig. 2A showing the Reactome “Translation” gene set, the third most highly enriched gene set in CNS blasts (positively correlated). Normalized enrichment score (NES) = 7.66; FDRq < 0.001. B, B-ALL xenografts generated by intrafemoral injection of BM blasts (patients 6 and 7) or CNS blasts (patients 12 and 15) were monitored for leukemic engraftment and then treated with 1 mg/kg OMA daily for 4 days or 3 days if significant leukemic morbidity was observed (3 days patient 15; 4 days patients 6, 7, and 12) prior to analysis. C, Translation rate in CNS blasts of saline or OMA-treated patient 12 xenografts measured by O-propargyl-puromycin (OPP) incorporation (n = 5 mice). MFI, mean fluorescence intensity. D, Pathways significantly downregulated in proteomic analysis of CNS blasts in OMA-treated xenografts were identified by ClueGO analysis with Markov Cluster Algorithm (MCL) clustering, displayed as a Cytoscape enrichment map of nodes colored by gene ontology process, with size representing significance and edges showing connection between proteins in different nodes. E, Human B-ALL engraftment in tissues of NSG xenografts treated as in B, with human CD19+CD45+ cell counts normalized to saline-treated controls from the day of sacrifice (n = 5 mice per patient for vehicle; n = 5 mice per patient 6, 7, 12, and 4 mice for patient 15 for OMA). In plots, bars represent mean ± SE; two-sided unpaired t test, with *, P < 0.05; **, P < 0.01; ns, not significant.
Figure 4.
Blocking mRNA translation as a therapeutic strategy for CNS disease. A, Waveplot from GSEA in Fig. 2A showing the Reactome “Translation” gene set, the third most highly enriched gene set in CNS blasts (positively correlated). Normalized enrichment score (NES) = 7.66; FDRq < 0.001. B, B-ALL xenografts generated by intrafemoral injection of BM blasts (patients 6 and 7) or CNS blasts (patients 12 and 15) were monitored for leukemic engraftment and then treated with 1 mg/kg OMA daily for 4 days or 3 days if significant leukemic morbidity was observed (3 days patient 15; 4 days patients 6, 7, and 12) prior to analysis. C, Translation rate in CNS blasts of saline or OMA-treated patient 12 xenografts measured by O-propargyl-puromycin (OPP) incorporation (n = 5 mice). MFI, mean fluorescence intensity. D, Pathways significantly downregulated in proteomic analysis of CNS blasts in OMA-treated xenografts were identified by ClueGO analysis with Markov Cluster Algorithm (MCL) clustering, displayed as a Cytoscape enrichment map of nodes colored by gene ontology process, with size representing significance and edges showing connection between proteins in different nodes. E, Human B-ALL engraftment in tissues of NSG xenografts treated as in B, with human CD19+CD45+ cell counts normalized to saline-treated controls from the day of sacrifice (n = 5 mice per patient for vehicle; n = 5 mice per patient 6, 7, 12, and 4 mice for patient 15 for OMA). In plots, bars represent mean ± SE; two-sided unpaired t test, with *, P < 0.05; **, P < 0.01; ns, not significant.
Figure 5. Posttranscriptional upregulation of complement component 3 promotes leptomeningeal disease in KMT2A-rearranged xenografts. A, Translation rate measured by OPP incorporation in matched BM and CNS blasts from KMT2A-rearranged patient 11, 12, and 15 xenografts represented as OPP mean fluorescence intensity (MFI) normalized to matched BM mean for each sample; n = 3 mice (patient 11 diagnosis), n = 10 mice (patient 12 diagnosis, patient 15 diagnosis). B, Biological processes upregulated as measured by label-free mass spectrometry proteomics of CNS blasts compared with matched BM blasts shown as a Cytoscape enrichment map with Markov Cluster Algorithm (MCL)-clustered, ClueGO-identified nodes colored by gene ontology process, with node size reflecting the number of involved proteins and lines representing proteins shared between nodes. C, Cytoscape map of pathways upregulated in proteins with greater abundance in CNS blasts without differential RNA-seq counts of the corresponding mRNA compared with BM blasts. Circular nodes represent MCL clustering of ClueGO-identified biological processes, with node size reflecting the number of involved proteins and edges representing proteins shared between nodes. D, Primary B-ALL xenografts were treated with 10 mg/kg of the C3a receptor antagonist SB 290157 or DMSO vehicle biweekly from the week after engraftment to endpoint. E, Human B-ALL engraftment in various tissues from D normalized to vehicle; n = 7 mice per group from patient 12 diagnosis and patient 15 diagnosis. F, Secondary B-ALL BM xenografts were treated with vehicle or 10 mg/kg C3a receptor agonist biweekly from the week after engraftment to endpoint. G, Human B-ALL engraftment in various tissues from F normalized to vehicle control; n = 4 (patient 11 CNS), n = 5 (patient 11 BM and patient 12 BM and CNS), or n = 10 (patient 15) mice per group. H, Mice with established secondary B-ALL BM xenografts were treated with vehicle or 10 mg/kg C3a receptor agonist for 3 days immediately prior to endpoint. I, Human B-ALL CNS engraftment from H normalized to vehicle control. Percentage of human B-ALL cells in CNS xenografts from H positive for Ki-67 (J) or activated caspase-3 (K). n = 5 mice per group in I–K. Bars, mean ± SE; two-sided unpaired t test, with *, P < 0.05; **, P < 0.01; ns, not significant.
Figure 5.
Posttranscriptional upregulation of complement component 3 promotes leptomeningeal disease in KMT2A-rearranged xenografts. A, Translation rate measured by OPP incorporation in matched BM and CNS blasts from KMT2A-rearranged patient 11, 12, and 15 xenografts represented as OPP mean fluorescence intensity (MFI) normalized to matched BM mean for each sample; n = 3 mice (patient 11 diagnosis), n = 10 mice (patient 12 diagnosis, patient 15 diagnosis). B, Biological processes upregulated as measured by label-free mass spectrometry proteomics of CNS blasts compared with matched BM blasts shown as a Cytoscape enrichment map with Markov Cluster Algorithm (MCL)-clustered, ClueGO-identified nodes colored by gene ontology process, with node size reflecting the number of involved proteins and lines representing proteins shared between nodes. C, Cytoscape map of pathways upregulated in proteins with greater abundance in CNS blasts without differential RNA-seq counts of the corresponding mRNA compared with BM blasts. Circular nodes represent MCL clustering of ClueGO-identified biological processes, with node size reflecting the number of involved proteins and edges representing proteins shared between nodes. D, Primary B-ALL xenografts were treated with 10 mg/kg of the C3a receptor antagonist SB 290157 or DMSO vehicle biweekly from the week after engraftment to endpoint. E, Human B-ALL engraftment in various tissues from D normalized to vehicle; n = 7 mice per group from patient 12 diagnosis and patient 15 diagnosis. F, Secondary B-ALL BM xenografts were treated with vehicle or 10 mg/kg C3a receptor agonist biweekly from the week after engraftment to endpoint. G, Human B-ALL engraftment in various tissues from F normalized to vehicle control; n = 4 (patient 11 CNS), n = 5 (patient 11 BM and patient 12 BM and CNS), or n = 10 (patient 15) mice per group. H, Mice with established secondary B-ALL BM xenografts were treated with vehicle or 10 mg/kg C3a receptor agonist for 3 days immediately prior to endpoint. I, Human B-ALL CNS engraftment from H normalized to vehicle control. Percentage of human B-ALL cells in CNS xenografts from H positive for Ki-67 (J) or activated caspase-3 (K). n = 5 mice per group in I–K. Bars, mean ± SE; two-sided unpaired t test, with *, P < 0.05; **, P < 0.01; ns, not significant.

Comment in

References

    1. Pui CH, Thiel E. Central nervous system disease in hematologic malignancies: historical perspective and practical applications. Semin Oncol 2009;36:S2–16. - PMC - PubMed
    1. Gaudichon J, Jakobczyk H, Debaize L, Cousin E, Galibert MD, Troadec MBet al. Mechanisms of extramedullary relapse in acute lymphoblastic leukemia: reconciling biological concepts and clinical issues. Blood Rev 2019;36:40–56. - PubMed
    1. Pui CH, Howard SC. Current management and challenges of malignant disease in the CNS in paediatric leukaemia. Lancet Oncol 2008;9:257–68. - PubMed
    1. Fielding AK, Richards SM, Chopra R, Lazarus HM, Litzow MR, Buck Get al. Outcome of 609 adults after relapse of acute lymphoblastic leukemia (ALL); an MRC UKALL12/ECOG 2993 study. Blood 2007;109:944–50. - PubMed
    1. Hunger SP, Mullighan CG. Acute lymphoblastic leukemia in children. N Engl J Med 2015;373:1541–52. - PubMed

Publication types

MeSH terms