. 2022 Mar 1;33(3):ar26.
doi: 10.1091/mbc.E21-06-0309. Epub 2022 Jan 12.

PP2A-dependent TFEB activation is blocked by PIKfyve-induced mTORC1 activity

Affiliations

PP2A-dependent TFEB activation is blocked by PIKfyve-induced mTORC1 activity

Junya Hasegawa et al. Mol Biol Cell. .

Abstract

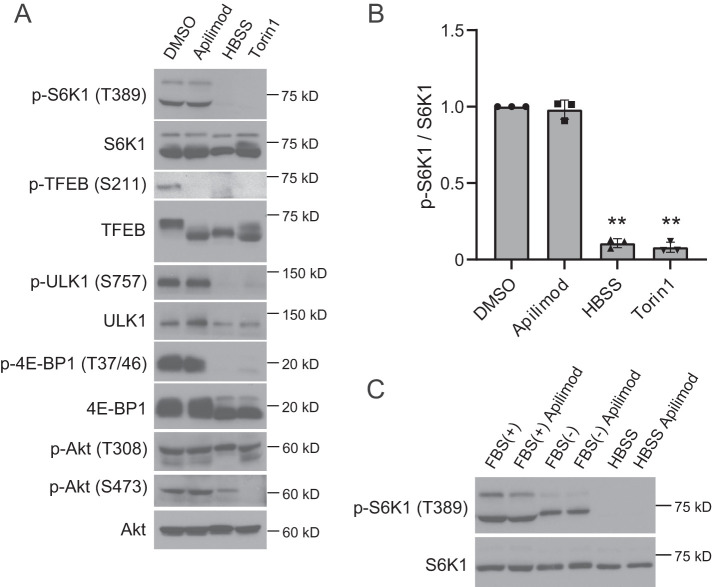
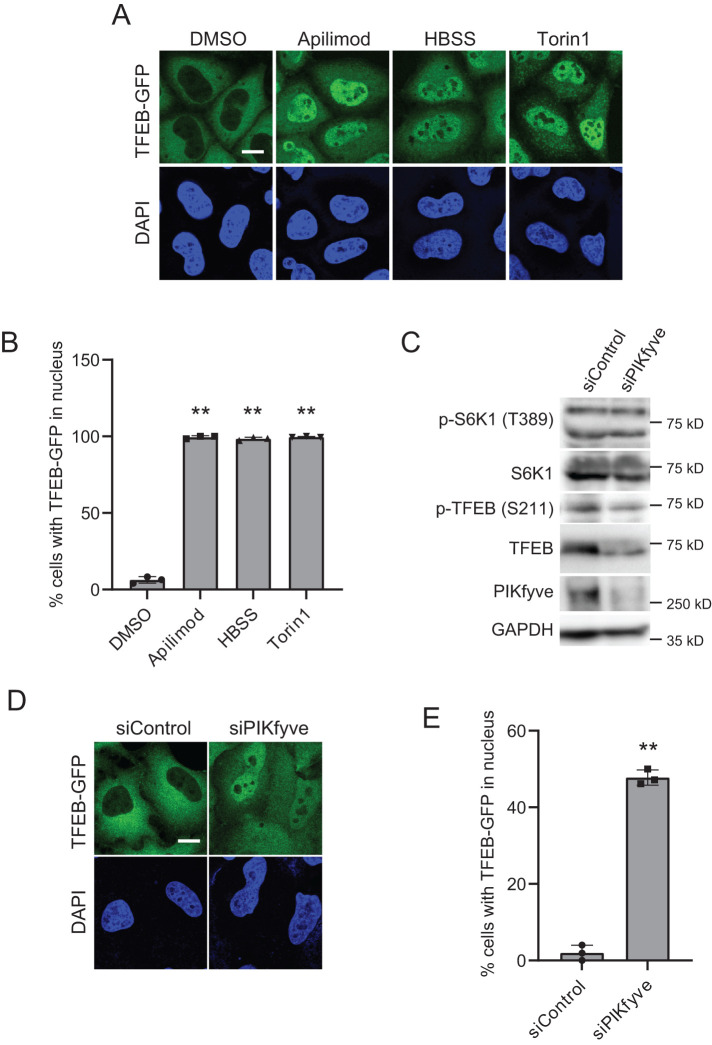
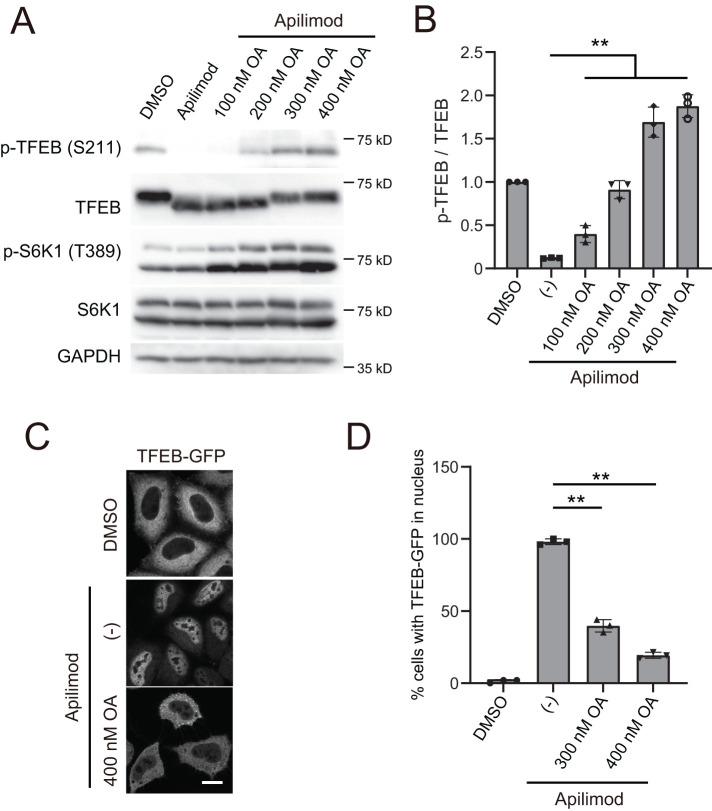
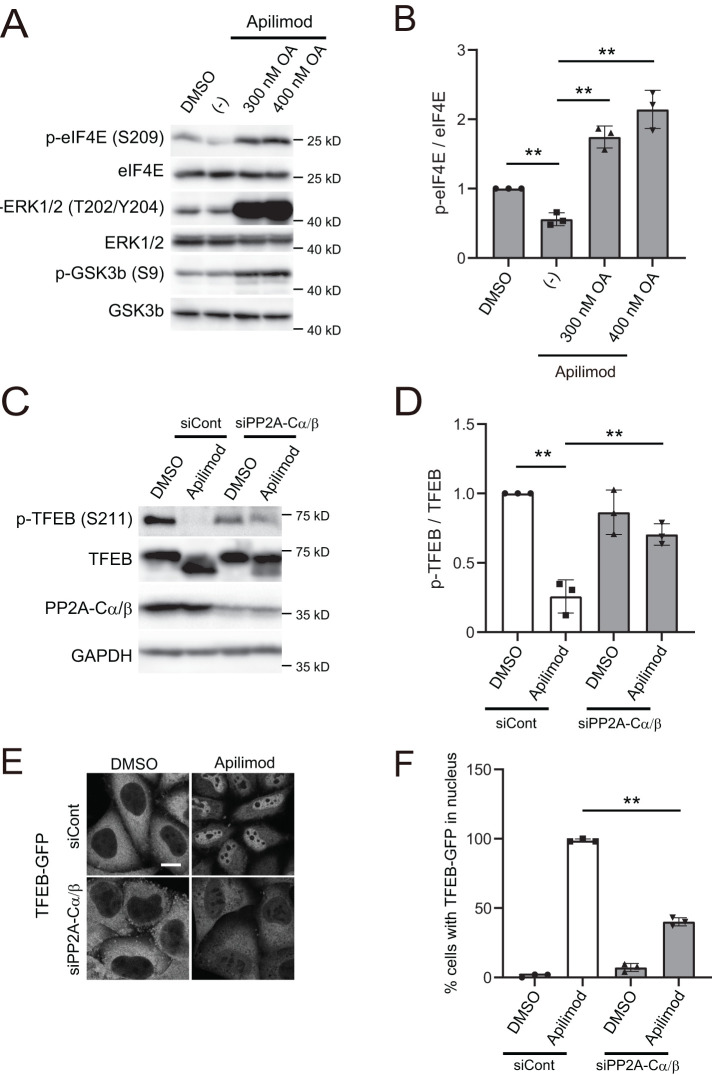
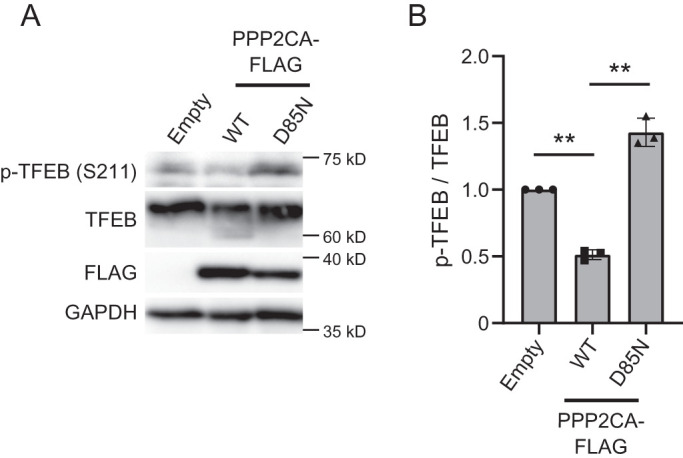
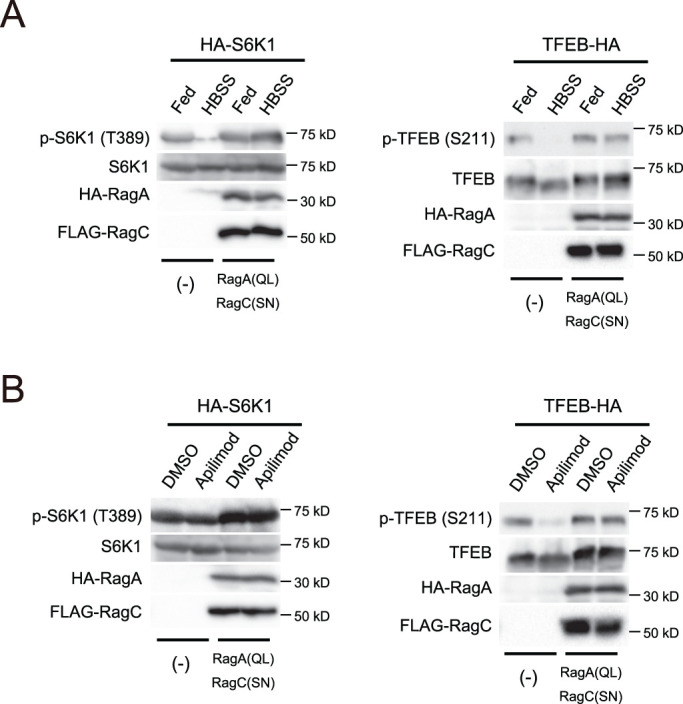
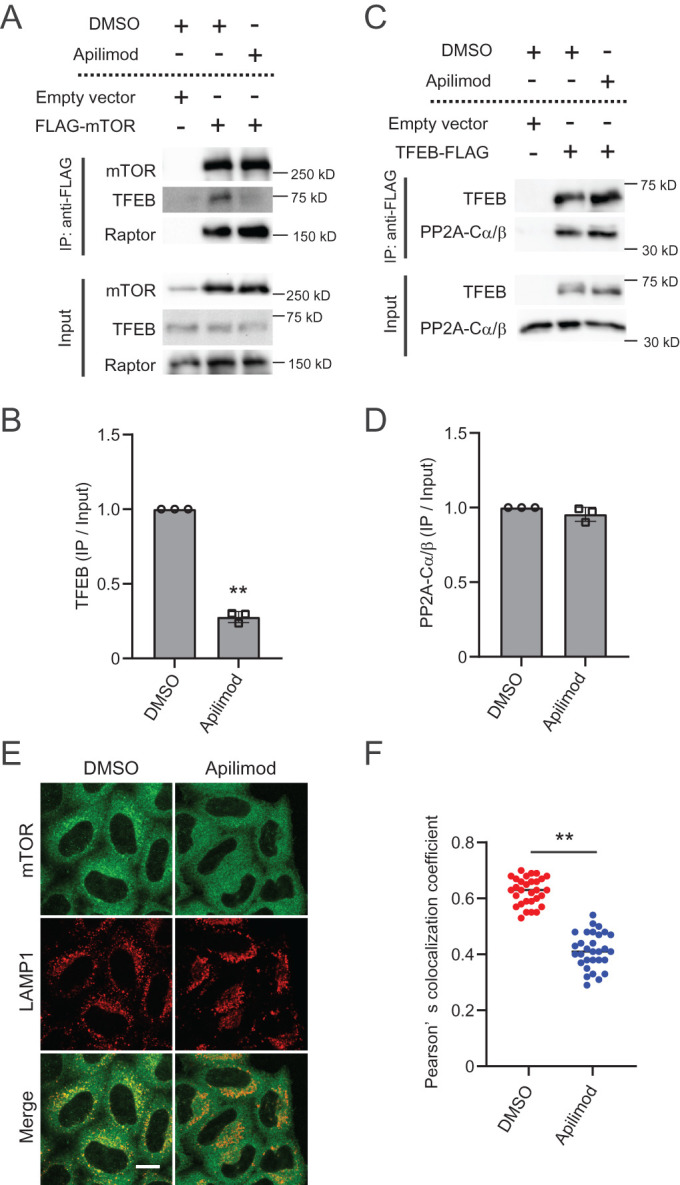
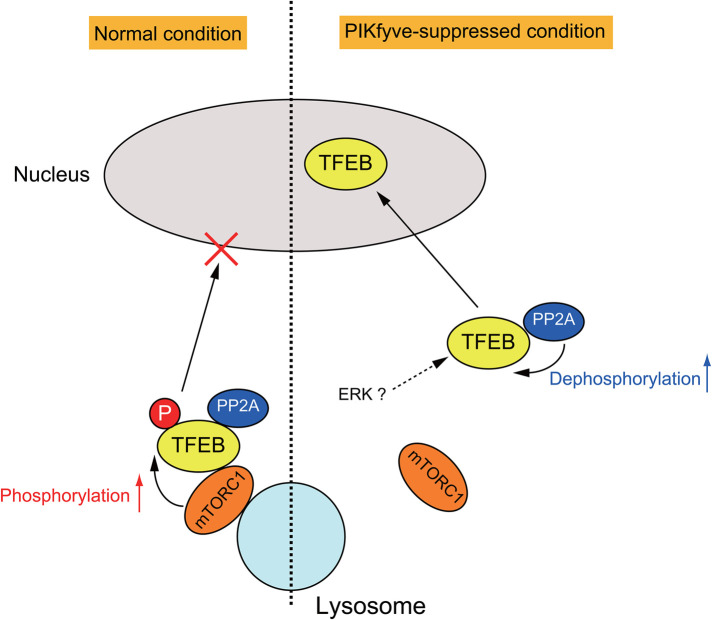
Transcriptional factor EB (TFEB) is a master regulator of genes required for autophagy and lysosomal function. The nuclear localization of TFEB is blocked by the mechanistic target of rapamycin complex 1 (mTORC1)-dependent phosphorylation of TFEB at multiple sites including Ser-211. Here we show that inhibition of PIKfyve, which produces phosphatidylinositol 3,5-bisphosphate on endosomes and lysosomes, causes a loss of Ser-211 phosphorylation and concomitant nuclear localization of TFEB. We found that while mTORC1 activity toward S6K1, as well as other major mTORC1 substrates, is not impaired, PIKfyve inhibition specifically impedes the interaction of TFEB with mTORC1. This suggests that mTORC1 activity on TFEB is selectively inhibited due to loss of mTORC1 access to TFEB. In addition, we found that TFEB activation during inhibition of PIKfyve relies on the ability of protein phosphatase 2A (PP2A) but not calcineurin/PPP3 to dephosphorylate TFEB Ser-211. Thus when PIKfyve is inhibited, PP2A is dominant over mTORC1 for control of TFEB phosphorylation at Ser-S211. Together these findings suggest that mTORC1 and PP2A have opposing roles on TFEB via phosphorylation and dephosphorylation of Ser-211, respectively, and further that PIKfyve inhibits TFEB activity by facilitating mTORC1-dependent phosphorylation of TFEB.


Figures

FIGURE 1:
FIGURE 1:
PIKfyve inhibition does not suppress mTORC1 activity. (A) HeLa cells treated with the indicated drugs (or DMSO vehicle control) were cultured for 2 h in the growth medium or HBSS for 2 h and then analyzed by immunoblot using the indicated antibodies. (B) Quantitation of phospho-S6K1 signal intensities from immunoblots in A, following normalization to the total S6K1 protein (mean ± SD; three independent experiments). **P < 0.01. (C) HeLa cells treated with apilimod were cultured for 2 h in the indicated medium (FBS[+], 10% FBS-DMEM; FBS[-], DMEM; HBSS) and then analyzed by immunoblot using anti-phospho-S6K1 and anti-S6K1 antibodies. Representative immunoblot from three independent experiments.
FIGURE 2:
FIGURE 2:
PIKfyve inhibition induces the dephosphorylation of TFEB and nuclear translocation of TFEB. (A) HeLa cells stably expressing TFEB-GFP treated with the indicated drugs were cultured for 1 h in the growth medium or HBSS for 1 h. Cells were fixed and stained with DAPI for nuclear staining and then analyzed by immunofluorescence microscopy. Bar, 10 µm. (B) Percentage of TFEB-GFP that is localized to the nucleus in A (mean ± SD; n > 100 cells from three independent experiments). **P < 0.01. (C) HeLa cells were transfected with siControl or siPIKfyve for 72 h and then analyzed by immunoblot using the indicated antibodies. (D) HeLa cells stably expressing TFEB-GFP were transfected with siControl or siPIKfyve for 72 h. Cells were fixed and stained with DAPI for nuclear staining and then analyzed by immunofluorescence microscopy. Bar, 10 µm. (E) Percentage of TFEB-GFP that is localized to the nucleus in D (mean ± SD; n > 50 cells from three independent experiments). **P < 0.01.
FIGURE 3:
FIGURE 3:
Treatment with okadaic acid restores dephosphorylation and nuclear translocation of TFEB induced by PIKfyve inhibition. (A) HeLa cells treated with 1 µM apilimod (or DMSO vehicle control) and okadaic acid at the indicated concentration were cultured for 1 h in the growth medium and then analyzed by immunoblot using the indicated antibodies. (B) Quantitation of phospho-TFEB signal intensities from immunoblots in A, following normalization to the total TFEB protein (mean ± SD; three independent experiments). (C) HeLa cells stably expressing TFEB-GFP treated with 1 µM apilimod and 400 nM okadaic acid were cultured for 1 h in the growth medium. Cells were fixed and then analyzed by immunofluorescence microscopy. Bar, 10 µm. (D) Percentage of TFEB-GFP that is localized to the nucleus in C (mean ± SD; n > 50 cells from three independent experiments). **P < 0.01.
FIGURE 4:
FIGURE 4:
PP2A knockdown suppresses PIKfyve-inhibition-dependent dephosphorylation and nuclear translocation of TFEB. (A) HeLa cells treated with 1 µM apilimod (or DMSO vehicle control) and okadaic acid at the indicated concentration were cultured for 1 h in the growth medium and then analyzed by immunoblot using the indicated antibodies. (B) Quantitation of phospho-elF4E signal intensities from immunoblots in A, following normalization to the total elF4E protein (mean ± SD; three independent experiments). **P < 0.01. (C) HeLa cells transfected with siControl, siPP2A-Cα and siPP2A-Cβ were treated with 1 µM apilimod (DMSO as a control) for 2 h and then analyzed by immunoblot using the indicated antibodies. (D) Quantitation of phospho-TFEB signal intensities from immunoblots in C, following normalization to the total TFEB protein (mean ± SD; three independent experiments). **P < 0.01. (E) HeLa cells transfected with siControl, siPP2A-Cα, and siPP2A-Cβ were treated with 1 µM apilimod (or DMSO vehicle control) for 2 h. Cells were fixed and then analyzed by immunofluorescence microscopy. Bar, 10 µm. (F) Percentage of TFEB-GFP that is localized to the nucleus in E (mean ± SD; n > 50 cells from three independent experiments). **P < 0.01.
FIGURE 5:
FIGURE 5:
Overexpression PPP2AC results in the dephosphorylation of TFEB. (A) HeLa cells transfected with a control vector or plasmid, which overexpresses PPP2AC (WT, D85N)-FLAG, were incubated for 1 d in the growth medium and then analyzed by immunoblot using the indicated antibodies. (B) Quantitation of phospho-TFEB signal intensities from immunoblots in A and normalized to total TFEB protein (mean ± SD; three independent experiments). **P < 0.01.
FIGURE 6:
FIGURE 6:
Constitutive active mutants of Rag GTPases suppress the dephosphorylation of TFEB by PIKfyve inhibition. (A) HEK293T cells expressing HA-S6K1 or TFEB-HA with/without HA-RagA (QL) and FLAG-RagC (SN) were cultured for 1 h in the growth medium or HBSS for 1 h and then analyzed by immunoblot using the indicated antibodies. Representative immunoblot from three independent experiments. (B) HEK293T cells expressing HA-S6K1 or TFEB-HA with/without HA-RagA (QL) and FLAG-RagC (SN) were treated with 1 µM apilimod (or DMSO vehicle control) and then analyzed by immunoblot using the indicated antibodies. Representative immunoblot from three independent experiments.
FIGURE 7:
FIGURE 7:
The interaction of TFEB with mTOR, but not with PP2A, is disrupted by PIKfyve suppression. (A) Lysates from HEK293T cells transfected with FLAG-mTOR were immunoprecipitated with anti-FLAG antibodies and then analyzed by immunoblot using the indicated antibodies. (B) Quantitation of immunoprecipitated TFEB signal intensities from immunoblots in A and normalized to input TFEB protein (mean ± SD; three independent experiments). **P < 0.01. (C) Lysates from HEK293T cells transfected with TFEB-FLAG were immunoprecipitated with anti-FLAG antibodies and then analyzed by immunoblot using the indicated antibodies. (D) Quantitation of immunoprecipitated PP2A-Cα/β signal intensities from immunoblots in C and normalized to input PP2A-Cα/β protein (mean ± SD; three independent experiments). **P < 0.01. (E) HeLa cells were treated with 1 µM apilimod (or DMSO vehicle control) for 2 h. Cells were fixed and stained with the indicated antibodies and then analyzed by immunofluorescence microscopy. Bar, 10 µm. (F) Quantitation of colocalization ratio between mTOR and LAMP1 in E (mean ± SD; n > 40 cells from three independent experiments). **P < 0.01.
FIGURE 8:
FIGURE 8:
A model for TFEB regulation by mTORC1 and PP2A. Under normal fed conditions, lysosomal localized mTORC1 phosphorylates TFEB, leading to cytoplasmic retention of TFEB. In PIKfyve-suppressed cells, the interaction between TFEB and mTORC1 is impaired, but TFEB can bind to PP2A, which promotes the dephosphorylation of TFEB, leading to the translocation of TFEB to the nucleus. See Results and Discussion for details.

Similar articles

Cited by

References

    1. Bago R, Malik N, Munson MJ, Prescott AR, Davies P, Sommer E, Shpiro N, Ward R, Cross D, Ganley IG, et al. (2014). Characterization of VPS34-IN1, a selective inhibitor of Vps34, reveals that the phosphatidylinositol 3-phosphate-binding SGK3 protein kinase is a downstream target of class III phosphoinositide 3-kinase. Biochem J 463, 413–427. - PMC - PubMed
    1. Balla T (2013). Phosphoinositides: Tiny lipids with giant impact on cell regulation. Physiol Rev 93, 1019–1137. - PMC - PubMed
    1. Bar-Peled L, Schweitzer LD, Zoncu R, Sabatini DM (2012). Ragulator is a GEF for the rag GTPases that signal amino acid levels to mTORC1. Cell 150, 1196–1208. - PMC - PubMed
    1. Cai X, Xu Y, Cheung AK, Tomlinson RC, Alcázar-Román A, Murphy L, Billich A, Zhang B, Feng Y, Klumpp M, et al. (2013). PIKfyve, a class III PI Kinase, is the target of the small molecular IL-12/IL-23 inhibitor apilimod and a player in toll-like receptor signaling. Chem Biol 20, 912–921. - PMC - PubMed
    1. Cai X, Xu Y, Kim Y-M, Loureiro J, Huang Q (2014). PIKfyve, a class III lipid kinase, is required for TLR-induced type I IFN production via modulation of ATF3. J Immunol 192, 3383–3389. - PubMed

Publication types

MeSH terms

Substances

LinkOut - more resources