

Quantification of human plasma metalloproteins in multiple sclerosis, ischemic stroke and healthy controls reveals an association of haptoglobin-hemoglobin complexes with age
- PMID: 35020753
- PMCID: PMC8754309
- DOI: 10.1371/journal.pone.0262160
Quantification of human plasma metalloproteins in multiple sclerosis, ischemic stroke and healthy controls reveals an association of haptoglobin-hemoglobin complexes with age
Abstract
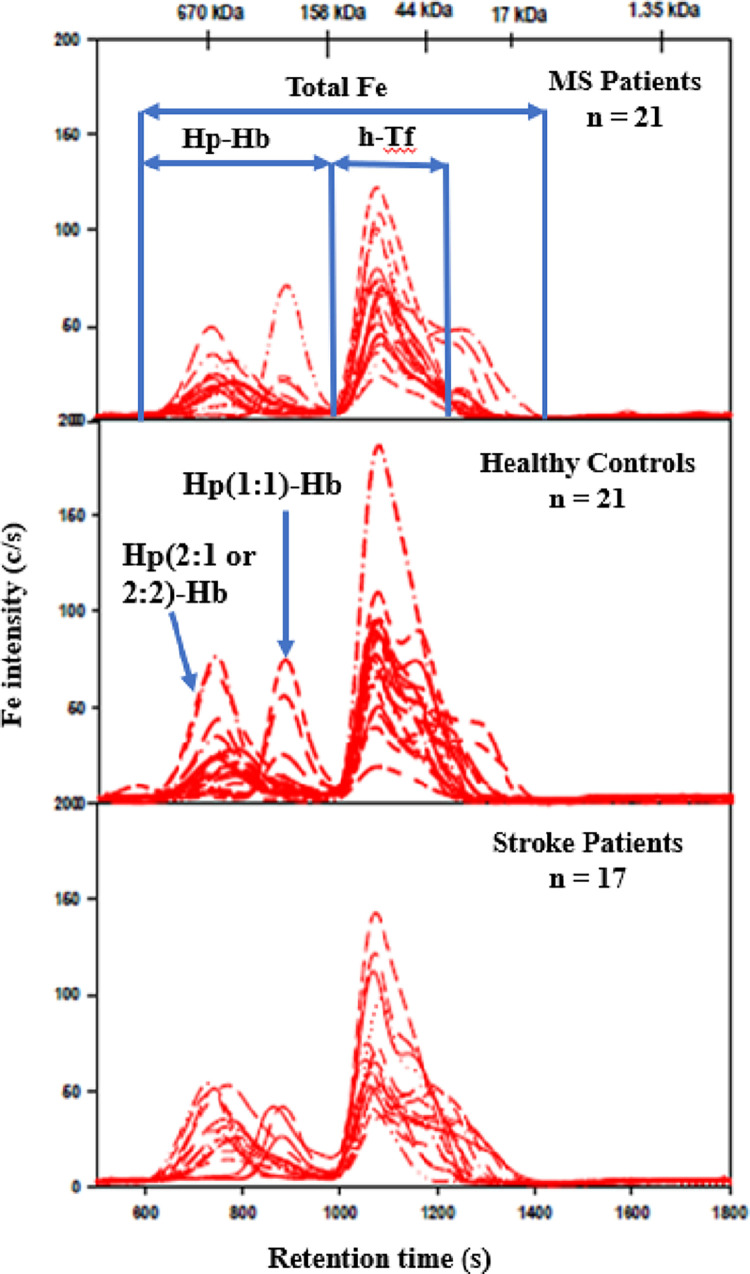
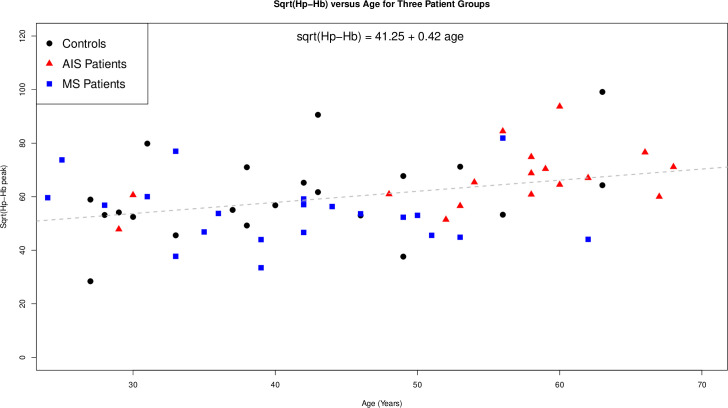
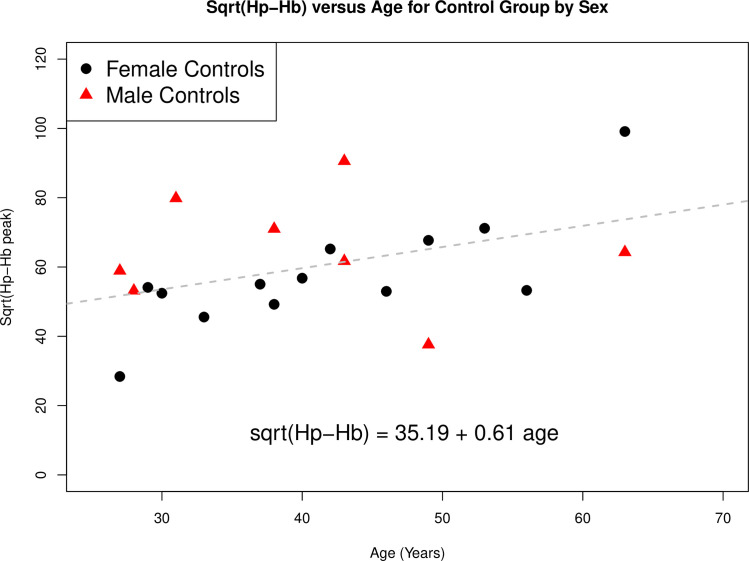
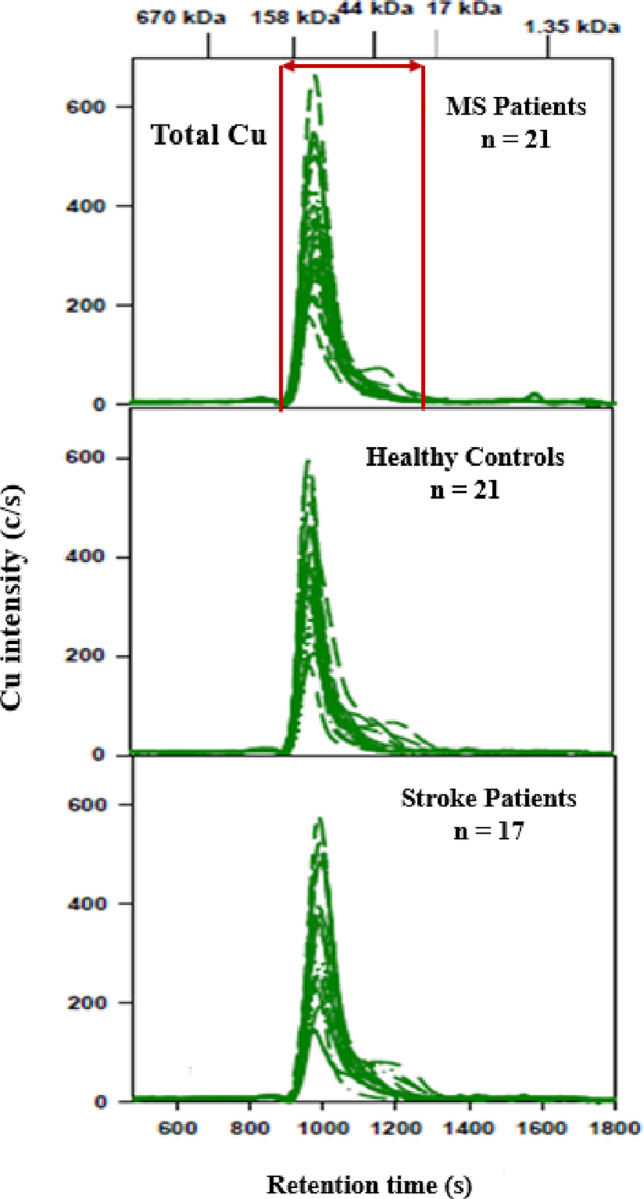
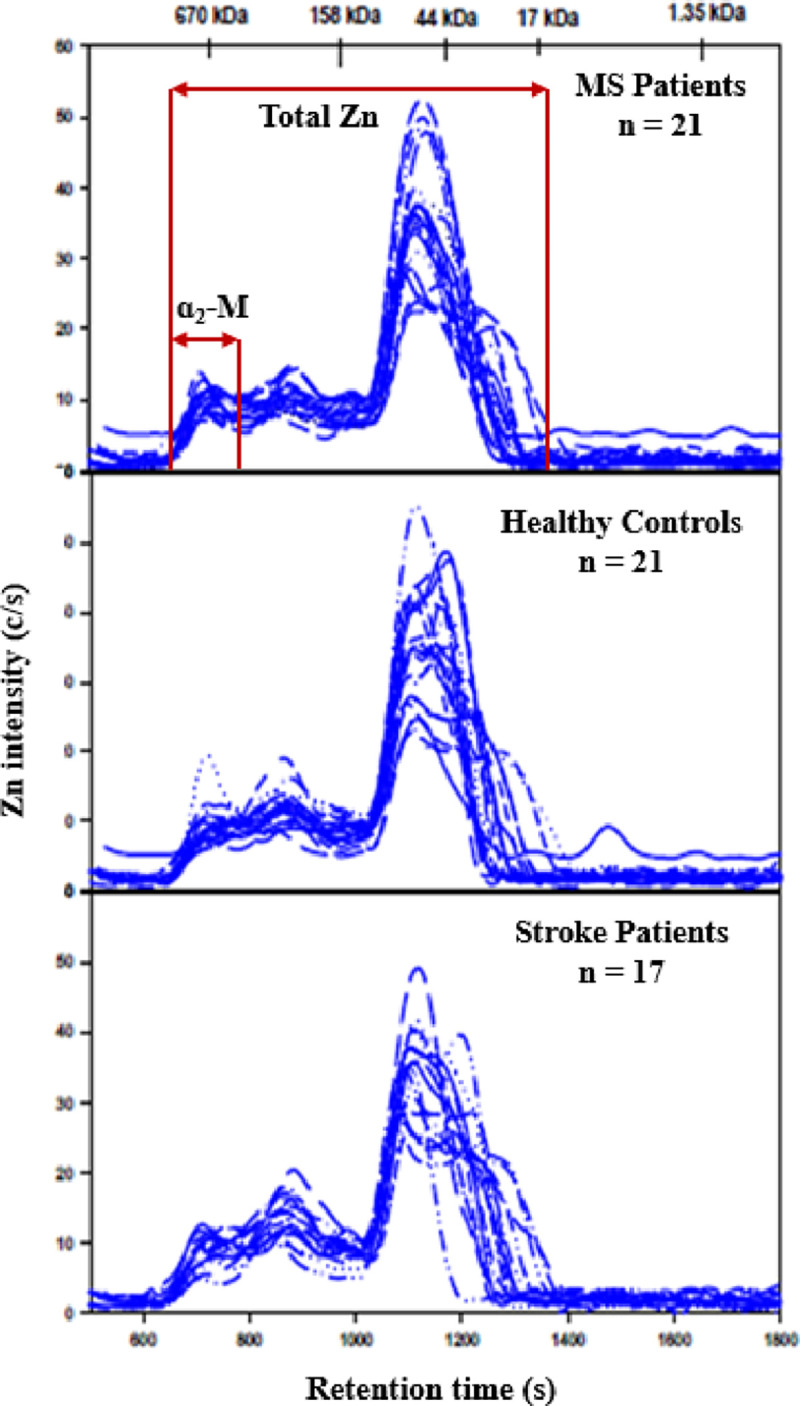
Advanced analytical methods play an important role in quantifying serum disease biomarkers. The problem of separating thousands of proteins can be reduced by analyzing for a 'sub-proteome', such as the 'metalloproteome', defined as all proteins that contain bound metals. We employed size exclusion chromatography (SEC) coupled to an inductively coupled plasma atomic emission spectrometer (ICP-AES) to analyze plasma from multiple sclerosis (MS) participants (n = 21), acute ischemic stroke (AIS) participants (n = 17) and healthy controls (n = 21) for Fe, Cu and Zn-metalloproteins. Using ANOVA analysis to compare the mean peak areas among the groups revealed no statistically significant differences for ceruloplasmin (p = 0.31), α2macroglobulin (p = 0.51) and transferrin (p = 0.31). However, a statistically significant difference was observed for the haptoglobin-hemoglobin (Hp-Hb) complex (p = 0.04), being driven by the difference between the control group and AIS (p = 0.012), but not with the MS group (p = 0.13), based on Dunnes test. A linear regression model for Hp-Hb complex with the groups now adjusted for age found no statistically significant differences between the groups (p = 0.95), but was suggestive for age (p = 0.057). To measure the strength of association between the Hp-Hb complex and age without possible modifications due to disease, we calculated the Spearman rank correlation in the healthy controls. The latter revealed a positive association (r = 0.39, 95% Confidence Interval = (-0.05, 0.83), which suggests that either the removal of Hp-Hb complexes from the blood circulation slows with age or that the release of Hb from red blood cells increases with age. We also observed that the Fe-peak corresponding to the Hp-Hb complex eluted ~100 s later in ~14% of all study samples, which was not correlated with age or disease diagnosis, but is consistent with the presence of the smaller Hp (1-1) isoform in 15% of the population.
Conflict of interest statement
The authors have declared that no competing interests exist.
Figures
Similar articles
-
Sample preparation of blood plasma enables baseline separation of iron metalloproteins by SEC-GFAAS.J Chromatogr B Analyt Technol Biomed Life Sci. 2020 Jun 15;1147:122147. doi: 10.1016/j.jchromb.2020.122147. Epub 2020 May 7. J Chromatogr B Analyt Technol Biomed Life Sci. 2020. PMID: 32416595
-
Identification of a haptoglobin-hemoglobin complex in human blood plasma.J Inorg Biochem. 2019 Dec;201:110802. doi: 10.1016/j.jinorgbio.2019.110802. Epub 2019 Aug 19. J Inorg Biochem. 2019. PMID: 31514091
-
Simultaneous Cu-, Fe-, and Zn-specific detection of metalloproteins contained in rabbit plasma by size-exclusion chromatography-inductively coupled plasma atomic emission spectroscopy.J Biol Inorg Chem. 2009 Jan;14(1):61-74. doi: 10.1007/s00775-008-0424-1. Epub 2008 Sep 10. J Biol Inorg Chem. 2009. PMID: 18781345
-
Analysis of the plasma metalloproteome by SEC-ICP-AES: bridging proteomics and metabolomics.Expert Rev Proteomics. 2009 Jun;6(3):251-65. doi: 10.1586/epr.09.44. Expert Rev Proteomics. 2009. PMID: 19489698 Review.
-
Trapping of human hemoglobin by haptoglobin: molecular mechanisms and clinical applications.Antioxid Redox Signal. 2013 Jun 10;18(17):2364-74. doi: 10.1089/ars.2012.4878. Epub 2012 Oct 18. Antioxid Redox Signal. 2013. PMID: 22900934 Review.
Cited by
-
Oxidant-Based Cytotoxic Agents During Aging: From Disturbed Energy Metabolism to Chronic Inflammation and Disease Progression.Biomolecules. 2025 Apr 9;15(4):547. doi: 10.3390/biom15040547. Biomolecules. 2025. PMID: 40305309 Free PMC article. Review.
-
Recent Advances of Proteomics in Management of Acute Kidney Injury.Diagnostics (Basel). 2023 Aug 11;13(16):2648. doi: 10.3390/diagnostics13162648. Diagnostics (Basel). 2023. PMID: 37627907 Free PMC article. Review.
-
Interaction of carbonic anhydrase I released from red blood cells with human plasma in vitro.Metallomics. 2024 Jun 4;16(6):mfae028. doi: 10.1093/mtomcs/mfae028. Metallomics. 2024. PMID: 38811147 Free PMC article.
-
Structural Characterization of Toxicologically Relevant Cd2+-L-Cysteine Complexes.Toxics. 2023 Mar 23;11(4):294. doi: 10.3390/toxics11040294. Toxics. 2023. PMID: 37112521 Free PMC article.
-
Recent Advances in Metalloproteomics.Biomolecules. 2024 Jan 13;14(1):104. doi: 10.3390/biom14010104. Biomolecules. 2024. PMID: 38254704 Free PMC article. Review.
References
-
- Hood L. A systems approach to medicine will transform healthcare. In: Zewail AH, editor. Physical Biology, from Atoms to Medicine. London: Imperial College Press; 2008. p. 337–66.
MeSH terms
Substances
LinkOut - more resources
Full Text Sources
Research Materials
Miscellaneous
