. 2022 Dec 9;118(15):3112-3125.
doi: 10.1093/cvr/cvab375.

Electrophysiological heterogeneity in large populations of rabbit ventricular cardiomyocytes

Affiliations

Electrophysiological heterogeneity in large populations of rabbit ventricular cardiomyocytes

Quentin Lachaud et al. Cardiovasc Res. .

Abstract

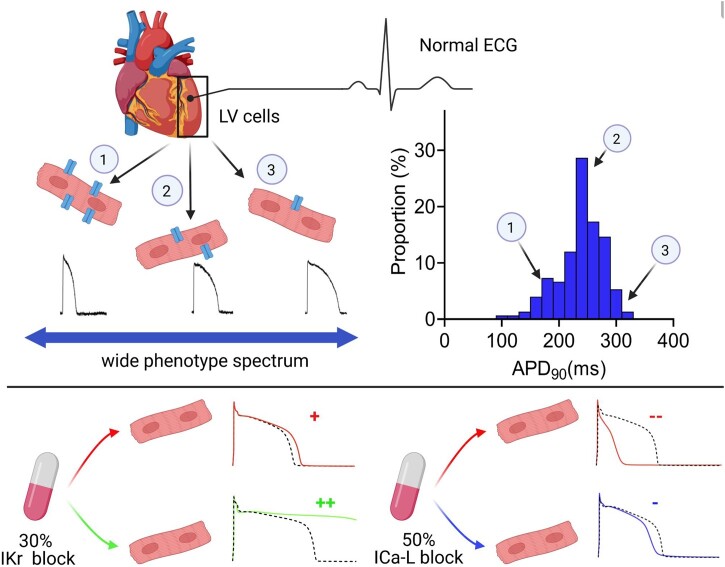
Aims: Cardiac electrophysiological heterogeneity includes: (i) regional differences in action potential (AP) waveform, (ii) AP waveform differences in cells isolated from a single region, (iii) variability of the contribution of individual ion currents in cells with similar AP durations (APDs). The aim of this study is to assess intra-regional AP waveform differences, to quantify the contribution of specific ion channels to the APD via drug responses and to generate a population of mathematical models to investigate the mechanisms underlying heterogeneity in rabbit ventricular cells.

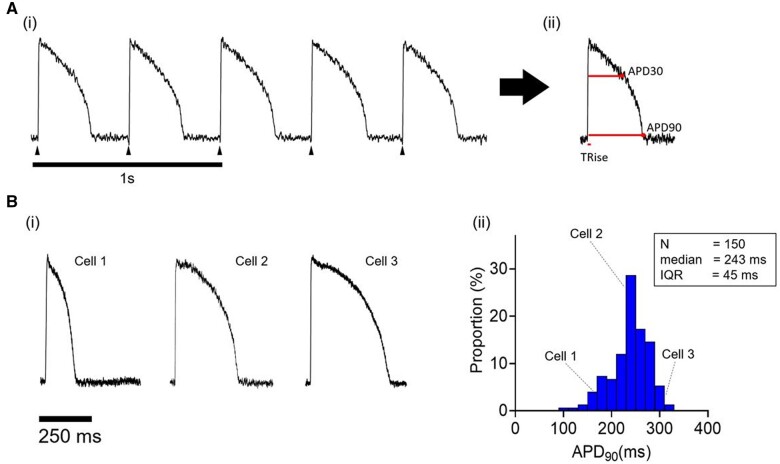
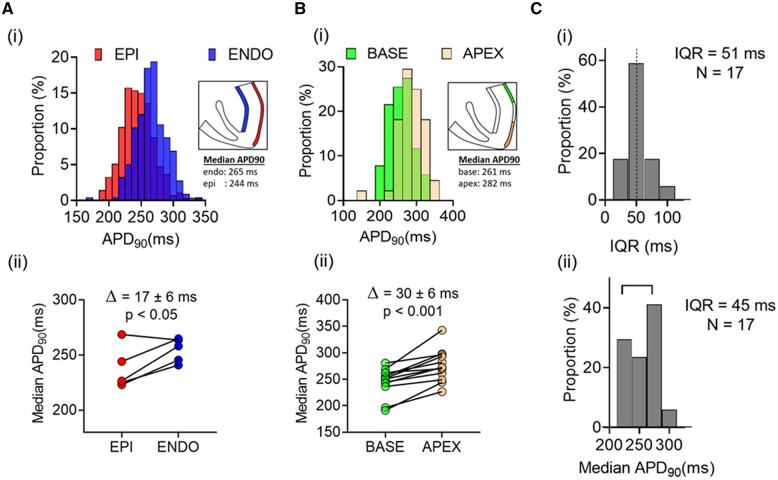
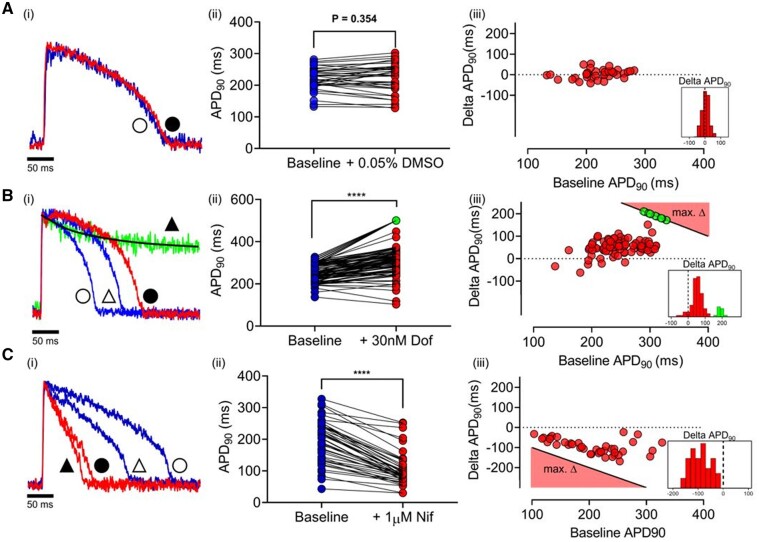
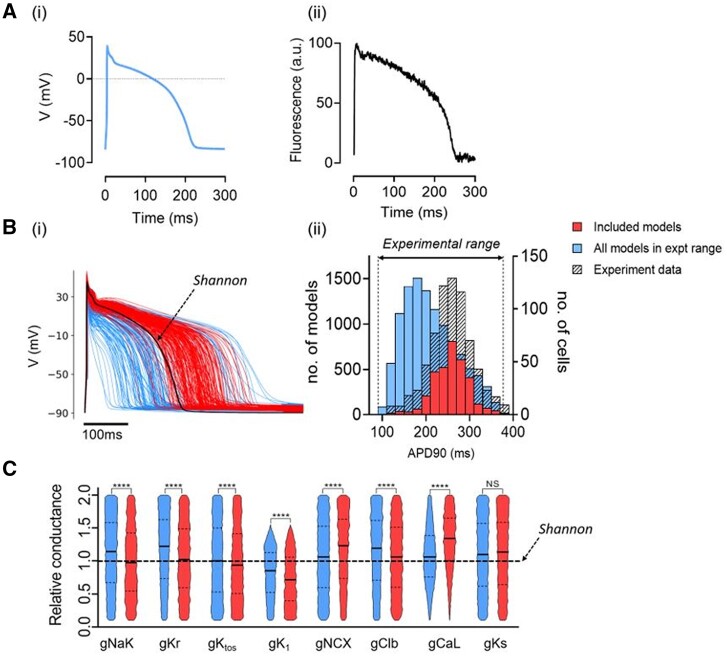
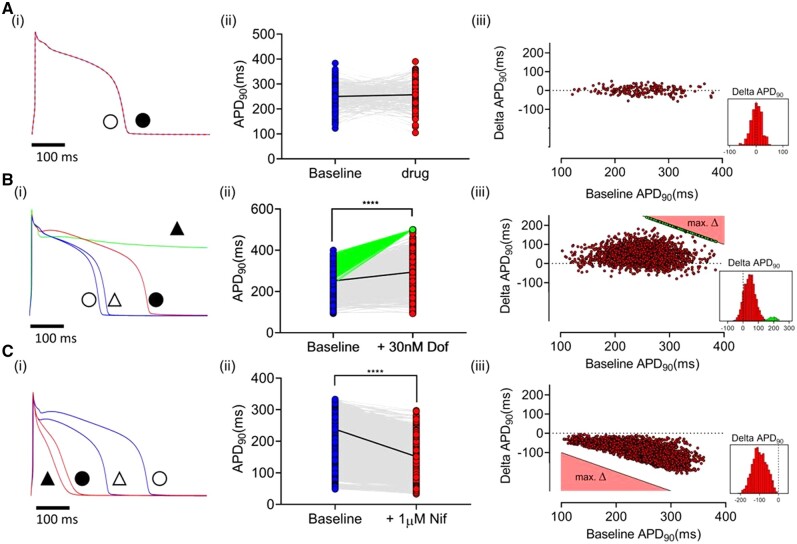
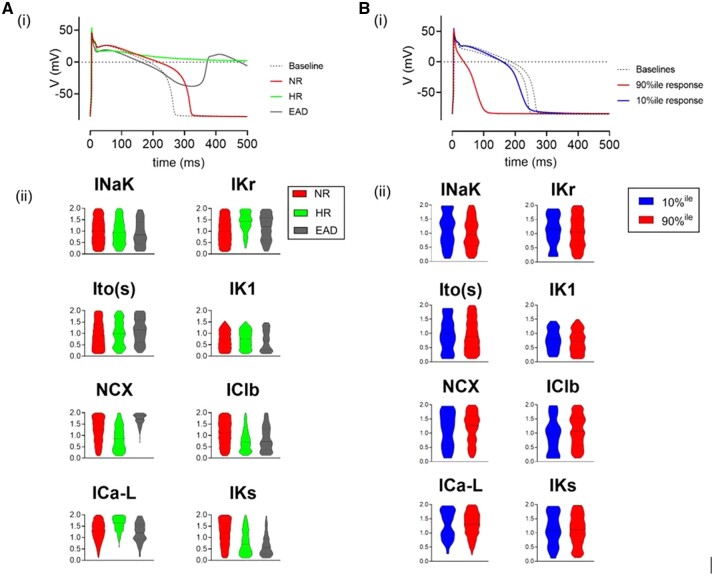
Methods and results: APD in ∼50 isolated cells from subregions of the LV free wall of rabbit hearts were measured using a voltage-sensitive dye. When stimulated at 2 Hz, average APD90 value in cells from the basal epicardial region was 254 ± 25 ms (mean ± standard deviation) in 17 hearts with a mean interquartile range (IQR) of 53 ± 17 ms. Endo-epicardial and apical-basal APD90 differences accounted for ∼10% of the IQR value. Highly variable changes in APD occurred after IK(r) or ICa(L) block that included a sub-population of cells (HR) with an exaggerated (hyper) response to IK(r) inhibition. A set of 4471 AP models matching the experimental APD90 distribution was generated from a larger population of models created by random variation of the maximum conductances (Gmax) of 8 key ion channels/exchangers/pumps. This set reproduced the pattern of cell-specific responses to ICa(L) and IK(r) block, including the HR sub-population. The models exhibited a wide range of Gmax values with constrained relationships linking ICa(L) with IK(r), ICl, INCX, and INaK.

Conclusion: Modelling the measured range of inter-cell APDs required a larger range of key Gmax values indicating that ventricular tissue has considerable inter-cell variation in channel/pump/exchanger activity. AP morphology is retained by relationships linking specific ionic conductances. These interrelationships are necessary for stable repolarization despite large inter-cell variation of individual conductances and this explains the variable sensitivity to ion channel block.

Keywords: Electrophysiology; Heterogeneity; Repolarization; Ventricle.


Conflict of interest statement

Conflict of interest: The authors declare that they have no known competing financial interests or personal relationships that could have appeared to influence the work reported in this paper.

Figures

Graphical Abstract
Graphical Abstract
Figure 1
Figure 1
[A(i)] Optical APs recorded during field stimulation of a single isolated rabbit cardiomyocyte. [A(ii)] Averaged AP of train in [A(i)], including TRise, time from 10% to 90% of upstroke; APD30, time from mid-point of upstroke to 30% repolarization; APD90, time from mid-point of upstroke to 90% repolarization. [B(i)] APs sampled from three cardiomyocytes from a single rabbit LV. [B(ii)] APD90 distribution in 150 cells from the same LV.
Figure 2
Figure 2
[A(i)] Distributions of APD90 in LV endocardial and epicardial cells from a single heart. [A(ii)] Comparison of median endocardial and epicardial APD90 in five hearts. [B(i)] Distributions of APD90 in LV basal and apical cells from a single heart. [B(ii)] Comparison of median apical and basal APD90 in 12 hearts. [C(i)] Distribution of IQRs for APD90 in 17 hearts. [C(ii)] Distribution of median APD90 from basal LV epicardium in 17 hearts. Statistical comparison between the paired data sets shown in [A(ii)] and [B(ii)] was made using a Student’s t-test.
Figure 3
Figure 3
[A(i)] Single-cell AP traces at baseline (blue) and with vehicle (0.05% DMSO; red). [A(ii)] Paired APD90 before and after vehicle (n = 37 cells, 1 heart). [A(iii)] ΔAPD90 on addition of vehicle vs. baseline. [B(i)] Single-cell AP traces showing two typical NRs to 30 nM dofetilide. Baseline APs (blue, triangles) and after dofetilide (red, squares). Green trace shows typical HR. Symbols indicate pairing (unfilled = baseline; filled = drug). [B(ii)] Paired APD90 before and after dofetilide (n = 84 cells, 1 heart). [B(iii)] ΔAPD90 with dofetilide vs. baseline APD90. For HR cells the minimum ΔAPD90 is shown in green. The black line in [A(iii)], [B(iii)] denotes the minimum ΔAPD90 possible (e.g. a 280 ms AP which shows an HR response during 500 ms pacing must have prolonged by at least 220 ms (500–280 ms). Consequently, the equation of the black line is defined as: max ΔAPD90 = 500 − APD90. [C(i)] APs from two cells at baseline (blue) and following 1 µM nifedipine (red). [C(ii)] Paired APD90 before and after nifedipine (n = 44 cells, 1 heart). [C(iii)] ΔAPD90 with nifedipine vs. baseline APD90. The black line in [C(iii)] denotes the maximum ΔAPD90 possible (e.g. a 280 ms AP has a maximum ΔAPD90 of −280 ms). Consequently, the equation of the black line is defined as: max ΔAPD90 = − APD90. Dashed lines in histograms indicate ΔAPD90 = 0. Statistical comparison between the paired data sets shown in [A(ii)], [B(ii)], and [C(ii)] was made using the Wilcoxon matched-pairs signed-rank test; ****P < 0.001.
Figure 4
Figure 4
[A(i)] Calculated steady-state AP using Shannon model. [A(ii)] Optical AP; both stimulated at 2 Hz. [B(i)] APs from a population of models with channel conductances randomly selected from uniform distributions in a range of 10–200% of the standard values. APs with APD90 values within the experimental range are shown in blue and a further calibrated subset that matches the experimental APD value distribution is shown in red. Standard Shannon AP shown in black. [B(ii)] Histograms of APD90 in populations of Shannon models calibrated to experimental range (left axis, blue bars), to experimental range and distribution (left axis, red bars) and of populations of cells (right axis, hashed bars). (C) Violin plot of ion channel conductances between original (blue) and experimentally calibrated Shannon models (red). Statistical comparison between the unpaired data sets shown in (C) was made using the Mann–Whitney test (****P < 0.001).
Figure 5
Figure 5
[A(i)] Model AP at baseline (blue) and post-vehicle (dashed red). [A(ii)] Dot-plot comparison of populations of model APs at baseline and following experimentally derived random effect. Individual cell responses (grey lines) and median behaviour (black line) shown. [A(iii)] Scatter plot of net random APD90 effect applied to model AP population. [B(i)] Two model APs at baseline (blue) and following IKr block. [B(ii)] Individual cell responses (grey), minimum HR (green), and median response (back) are shown. [B(iii)] ΔAPD in individual AP models (red). Minimum theoretical change observed in hyper-responders (cycle length—baseline APD) shown in green. [C(i)] Two models with different baseline APD (blue) and following ICaL block (red). [C(ii)] Individual cell response (grey), median response (black) shown. [C(iii)] ΔAPD in individual AP models. The black line in [A(iii)], [B(iii)] denotes the minimum ΔAPD90 possible (e.g. a 280 ms) AP which shows an HR response during 500 ms pacing must have prolonged by at least 220 ms (500–280 ms). Consequently, the equation of the black line is defined as: max ΔAPD90 = 500 − APD90. [C(iii)] ΔAPD90 with nifedipine vs. baseline APD90. The black line in [C(iii)] denotes the maximum ΔAPD90 possible (e.g. a 280 ms) AP has a maximum ΔAPD90 of −280 ms. Consequently, the equation of the black line is defined as: max ΔAPD90 = − APD90. Dashed lines in histograms indicate ΔAPD90 = 0. Statistical comparison between the paired data sets shown in [A(ii)], [B(ii)], and [C(ii)] was made using the Wilcoxon matched-pairs signed-rank test (****P < 0.001).
Figure 6
Figure 6
[A(i)], Model APs at baseline (dashed line) and typical responses to 30% IKr reduction. NR (red) shows modest AP prolongation, HR (green) shows failure of repolarization. EAD (grey) responses (defined here as positive deflection of membrane potential ≥10% of AP amplitude) are also shown. [A(ii)] Violin plot comparison of mean ion channel conductance for each AP subgroup. [B(i)] Example traces of two typical AP responses to 60% ICa(L) block. Baselines (dashed lines) and 10%ile (blue) and 90%ile (red) responses are shown. [B(ii)] Violin plot comparison of typical ion channel conductance in low (10%ile) and high (90%ile) responders to ICa(L) block.

References

    1. Zhang Y, Post WS, Blasco-Colmenares E, Dalal D, Tomaselli GF, Guallar E.. Electrocardiographic QT interval and mortality: a meta-analysis. Epidemiology 2011;22:660–670. - PMC - PubMed
    1. O’Neal WT, Singleton MJ, Roberts JD, Tereshchenko LG, Sotoodehnia N, Chen LY, Marcus GM, Soliman EZ.. Association between QT-interval components and sudden cardiac death: the ARIC Study (atherosclerosis risk in communities). Circ Arrhythm Electrophysiol 2017;10:e005485. - PMC - PubMed
    1. Arking DE, Pulit SL, Crotti L, van der Harst P, Munroe PB, Koopmann TT, Sotoodehnia N, Rossin EJ, Morley M, Wang X, Johnson AD, Lundby A, Gudbjartsson DF, Noseworthy PA, Eijgelsheim M, Bradford Y, Tarasov KV, Dörr M, Müller-Nurasyid M, Lahtinen AM, Nolte IM, Smith AV, Bis JC, Isaacs A, Newhouse SJ, Evans DS, Post WS, Waggott D, Lyytikäinen L-P, Hicks AA, Eisele L, Ellinghaus D, Hayward C, Navarro P, Ulivi S, Tanaka T, Tester DJ, Chatel S, Gustafsson S, Kumari M, Morris RW, Naluai ÅT, Padmanabhan S, Kluttig A, Strohmer B, Panayiotou AG, Torres M, Knoflach M, Hubacek JA, Slowikowski K, Raychaudhuri S, Kumar RD, Harris TB, Launer LJ, Shuldiner AR, Alonso A, Bader JS, Ehret G, Huang H, Kao WHL, Strait JB, Macfarlane PW, Brown M, Caulfield MJ, Samani NJ, Kronenberg F, Willeit J, Smith JG, Greiser KH, Meyer Zu Schwabedissen H, Werdan K, Carella M, Zelante L, Heckbert SR, Psaty BM, Rotter JI, Kolcic I, Polašek O, Wright AF, Griffin M, Daly MJ, Arnar DO, Hólm H, Thorsteinsdottir U, Denny JC, Roden DM, Zuvich RL, Emilsson V, Plump AS, Larson MG, O’Donnell CJ, Yin X, Bobbo M, D’Adamo AP, Iorio A, Sinagra G, Carracedo A, Cummings SR, Nalls MA, Jula A, Kontula KK, Marjamaa A, Oikarinen L, Perola M, Porthan K, Erbel R, Hoffmann P, Jöckel K-H, Kälsch H, Nöthen MM, den Hoed M, Loos RJF, Thelle DS, Gieger C, Meitinger T, Perz S, Peters A, Prucha H, Sinner MF, Waldenberger M, de Boer RA, Franke L, van der Vleuten PA, Beckmann BM, Martens E, Bardai A, Hofman N, Wilde AAM, Behr ER, Dalageorgou C, Giudicessi JR, Medeiros-Domingo A, Barc J, Kyndt F, Probst V, Ghidoni A, Insolia R, Hamilton RM, Scherer SW, Brandimarto J, Margulies K, Moravec CE, del Greco M F, Fuchsberger C, O’Connell JR, Lee WK, Watt GCM, Campbell H, Wild SH, El Mokhtari NE, Frey N, Asselbergs FW, Mateo Leach I, Navis G, van den Berg MP, van Veldhuisen DJ, Kellis M, Krijthe BP, Franco OH, Hofman A, Kors JA, Uitterlinden AG, Witteman JCM, Kedenko L, Lamina C, Oostra BA, Abecasis GR, Lakatta EG, Mulas A, Orrú M, Schlessinger D, Uda M, Markus MRP, Völker U, Snieder H, Spector TD, Ärnlöv J, Lind L, Sundström J, Syvänen A-C, Kivimaki M, Kähönen M, Mononen N, Raitakari OT, Viikari JS, Adamkova V, Kiechl S, Brion M, Nicolaides AN, Paulweber B, Haerting J, Dominiczak AF, Nyberg F, Whincup PH, Hingorani AD, Schott J-J, Bezzina CR, Ingelsson E, Ferrucci L, Gasparini P, Wilson JF, Rudan I, Franke A, Mühleisen TW, Pramstaller PP, Lehtimäki TJ, Paterson AD, Parsa A, Liu Y, van Duijn CM, Siscovick DS, Gudnason V, Jamshidi Y, Salomaa V, Felix SB, Sanna S, Ritchie MD, Stricker BH, Stefansson K, Boyer LA, Cappola TP, Olsen JV, Lage K, Schwartz PJ, Kääb S, Chakravarti A, Ackerman MJ, Pfeufer A, de Bakker PIW, Newton-Cheh C; HRGEN Consortium . Genetic association study of QT interval highlights role for calcium signaling pathways in myocardial repolarization. Nat Genet 2014;46:826–836. - PMC - PubMed
    1. Giudicessi JR, Wilde AAM, Ackerman MJ.. The genetic architecture of long QT syndrome: a critical reappraisal. Trends Cardiovasc Med 2018;28:453–464. - PMC - PubMed
    1. Muszkiewicz A, Liu X, Bueno-Orovio A, Lawson BAJ, Burrage K, Casadei B, Rodriguez B.. From ionic to cellular variability in human atrial myocytes: an integrative computational and experimental study. Am J Physiol Heart Circ Physiol 2018;314:H895–H916. - PMC - PubMed

Publication types