Clinical Trial
. 2022 Jan 28;207(1):123-139.
doi: 10.1093/cei/uxab011.

Evaluation of a gene expression biomarker to identify operationally tolerant liver transplant recipients: the LITMUS trial

Affiliations
Clinical Trial

Evaluation of a gene expression biomarker to identify operationally tolerant liver transplant recipients: the LITMUS trial

Andrzej Chruscinski et al. Clin Exp Immunol. .

Abstract

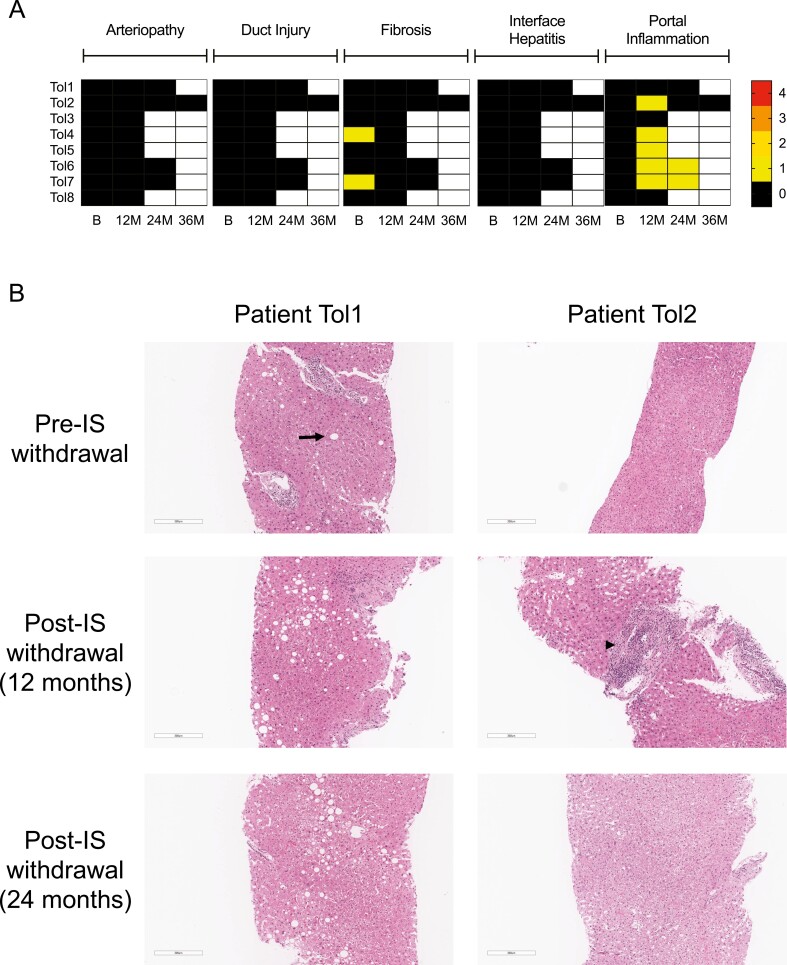
LITMUS was a single-centre, Phase 2a study designed to investigate whether the gene biomarker FGL2/IFNG previously reported for the identification of tolerance in murine models could identify operationally tolerant liver transplant recipients. Multiplex RT-PCR was used to amplify eight immunoregulatory genes in peripheral blood mononuclear cells (PBMC) from 69 adult liver transplant recipients. Patients with PBMC FGL2/IFNG ≥ 1 and a normal liver biopsy underwent immunosuppression (IS) withdrawal. The primary end point was the development of operational tolerance. Secondary end points included correlation of tolerance with allograft gene expression and immune cell markers. Twenty-eight of 69 patients (38%) were positive for the PBMC tolerance biomarker and 23 proceeded to IS withdrawal. Nine of the 23 patients had abnormal baseline liver biopsies and were excluded. Of the 14 patients with normal biopsies, eight (57%) have achieved operational tolerance and are off IS (range 12-57 months). Additional studies revealed that all of the tolerant patients and only one non-tolerant patient had a liver gene ratio of FOXP3/IFNG ≥ 1 prior to IS withdrawal. Increased CD4+ T regulatory T cells were detected both in PBMC and livers of tolerant patients following IS withdrawal. Higher expression of SELE (gene for E-selectin) and lower expression of genes associated with inflammatory responses (GZMB, CIITA, UBD, LSP1, and CXCL9) were observed in the pre-withdrawal liver biopsies of tolerant patients by RNA sequencing. These results suggest that measurement of PBMC FGL2/IFNG may enrich for the identification of operationally tolerant liver transplant patients, especially when combined with intragraft measurement of FOXP3/IFNG. Clinical Trial Registration: ClinicalTrials.gov (LITMUS: NCT02541916).

Keywords: biomarker; gene expression; immunosuppression withdrawal; liver transplantation; tolerance.


Figures

Graphical Abstract
Graphical Abstract
Fig. 1
Fig. 1
Trial design. In Phase 1, eligible patients had blood collected for PBMC gene expression profiling. In Phase 2, patients with a positive tolerance biomarker underwent IS withdrawal, following a baseline liver biopsy. Liver biopsies were performed, and blood was collected at various months post-IS withdrawal as indicated. M, months.
Fig. 2
Fig. 2
Flowchart of patient enrolment.
Fig. 3
Fig. 3
Probability of patients being free of rejection from the initiation of IS withdrawal. Tick marks indicate patients who are operationally tolerant.
Fig. 4
Fig. 4
Liver biopsy histopathology in tolerant patients. (A) Evaluation of liver biopsies for arteriopathy, duct injury, fibrosis, interface hepatitis, and portal inflammation. The absolute score for each of these parameters is represented in the heatmap as shown in the scale. Arteriopathy, duct loss, and portal inflammation were scored from 0 to 3, whereas fibrosis was scored from 0 to 4. Scoring was performed using Banff criteria [21, 22]. All eight tolerant patients had biopsies at baseline (B) and end of trial at 12 months (12M) post-IS withdrawal. Some of the tolerant patients also had biopsies available for evaluation at 24 months (24M) and 36 months (36M) post-IS withdrawal. White spaces in the heatmap represent biopsies that were not available for evaluation. (B) Liver biopsies in two patients (Patient Tol1 and Patient Tol2) pre-IS withdrawal, 12 months post-IS withdrawal, and 24 months post-IS withdrawal. Patient Tol1 was noted to have mild macrovesicular steatosis at baseline (arrow). On post-IS withdrawal biopsies, there was persistent macrovesicular steatosis and no evidence of cellular infiltrates. Patient Tol2 developed a focal portal mononuclear cell infiltrate at 1 year post-IS withdrawal (arrowhead). At 2 years post-IS withdrawal, the infiltrate had largely resolved. Liver biopsies were stained with haematoxylin and eosin (H&E). Scale bars: 300 µm.
Fig. 5
Fig. 5
PBMC gene expression and Treg in the peripheral blood. (A) Change in PBMC target gene expression at 3, 6, 9, and 12 months post-IS withdrawal in operationally tolerant recipients. For each recipient, gene expression was normalized to pre-withdrawal gene expression. Symbols represent median, and bars represent IQR. Significance was determined with the Kruskal–Wallis test followed by Dunn’s multiple comparisons post hoc test. (B) Quantification of Tregs with mass cytometry. Tregs in peripheral blood were identified based on expression of CD3+CD4+CD25+CD127low markers and are shown as a percentage of CD4+ T cells. PBMC were studied pre-IS withdrawal and 3–6 months post-IS withdrawal in operationally tolerant recipients (n = 6). Lines represent individual patients. Significance was determined used a paired t-test. ∗P < 0.05; ∗∗P < 0.01. IQR, interquartile range; M, months.
Fig. 6
Fig. 6
Baseline and longitudinal liver allograft gene expression. (A) Baseline FOXP3/IFNG liver gene ratio in operationally tolerant patients (n = 8) versus unsuccessful (n = 6) IS withdrawal. Symbols represent median, and bars represent IQR. Significance was determined by a Mann–Whitney U test. (B) Baseline FOXP3/IFNG liver gene ratio separated by a FOXP3/IFNG < 1 or FOXP3/IFNG ≥ 1. (C) Change in liver target gene expression at 6 and 12 months post-IS withdrawal in operationally tolerant recipients. For each recipient, gene expression was normalized to pre-withdrawal gene expression. Symbols represent median, and bars represent IQR. Significance was determined with the Kruskal–Wallis test followed by Dunn’s multiple comparisons post hoc test. ∗P < 0.05; ∗∗P < 0.01. IQR, interquartile range; M, months.
Fig. 7
Fig. 7
Immunophenotyping of the T-cell compartment in liver allograft biopsies at pre-withdrawal and 12 and 24 months post-IS withdrawal. (A) Left panel: representative histology from a tolerant patient after successful IS withdrawal. Co-staining for CD4 (red), CD8 (green), and FOXP3 (blue) of intrahepatic T-cell infiltration was performed in liver biopsy sections. Liver sinusoidal epithelial cells weakly express CD4 and can be distinguished from T cells by strength of CD4 expression, shape, and localization of cells. The white line surrounds areas of portal infiltrations and excludes lumen of veins, arteries, and bile ducts. Right panel: higher magnification of portal infiltrates with clear nuclear localization of the FOXP3 in CD4+ Tregs (white arrows). (B) Size of portal infiltrates in liver biopsies before after complete and successful IS weaning. (C) Portal infiltration density of CD4+ T cells. (D) Portal infiltration density of CD8+ T cells. (E) Portal infiltration density of CD4+FOXP3+ Tregs. (F) Portal Tregs/(CD4+ + CD8+) ratio. Symbols represent median, and bars represent IQR for patients at 12M (n = 6) and patients at 24M (n = 4). Significance was determined with the Kruskal–Wallis test followed by Dunn’s multiple comparisons post hoc test. ∗P < 0.05. (G) Mean relative changes of histological parameters during operational tolerance compared to pre-withdrawal biopsies. IQR, interquartile range; M, months.
Fig. 8
Fig. 8
Results of RNA-seq on pre-withdrawal liver biopsies. (A) Volcano plot of genes upregulated and downregulated in tolerant patients (n = 8) versus non-tolerant patients with unsuccessful withdrawal/abnormal biopsy (n = 6 unsuccessful, n = 3 abnormal). (B) Heatmap display of the 16 genes with significant (Padj < 0.05) differences. Rows represent genes, and columns represent different patient samples. Hierarchical clustering was used to sort both rows and columns. A relative colour scheme was used to convert the minimum and maximum values in each row to colours. Higher gene expression is indicated by red, whereas lower gene expression is indicated by blue.

References

    1. Jain A, Reyes J, Kashyap R, et al. . Long-term survival after liver transplantation in 4,000 consecutive patients at a single center. Ann Surg 2000, 232, 490–500. - PMC - PubMed
    1. Lechler RI, Sykes M, Thomson AW, Turka LA.. Organ transplantation—how much of the promise has been realized? Nat Med 2005, 11, 605–13. - PubMed
    1. Thomson AW, Vionnet J, Sanchez-Fueyo A.. Understanding, predicting and achieving liver transplant tolerance: from bench to bedside. Nat Rev Gastroenterol Hepatol 2020, 17, 719–39. - PubMed
    1. Mazariegos GV, Reyes J, Marino IR, et al. . Weaning of immunosuppression in liver transplant recipients. Transplantation 1997, 63, 243–9. - PMC - PubMed
    1. Devlin J, Doherty D, Thomson L, et al. . Defining the outcome of immunosuppression withdrawal after liver transplantation. Hepatology 1998, 27, 926–33. - PubMed

Publication types

Associated data