. 2022 Jan 11;55(1):115-128.e9.
doi: 10.1016/j.immuni.2021.12.007.

TGF-β-mediated silencing of genomic organizer SATB1 promotes Tfh cell differentiation and formation of intra-tumoral tertiary lymphoid structures

Affiliations

TGF-β-mediated silencing of genomic organizer SATB1 promotes Tfh cell differentiation and formation of intra-tumoral tertiary lymphoid structures

Ricardo A Chaurio et al. Immunity. .

Abstract

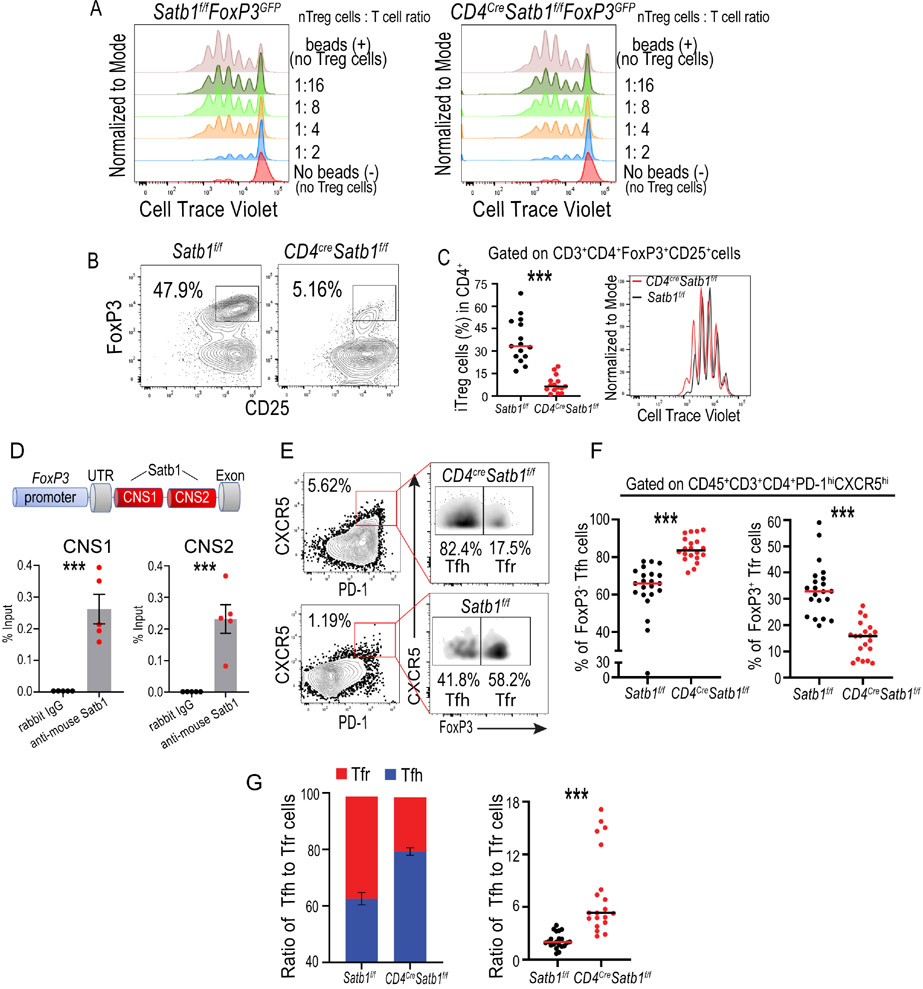
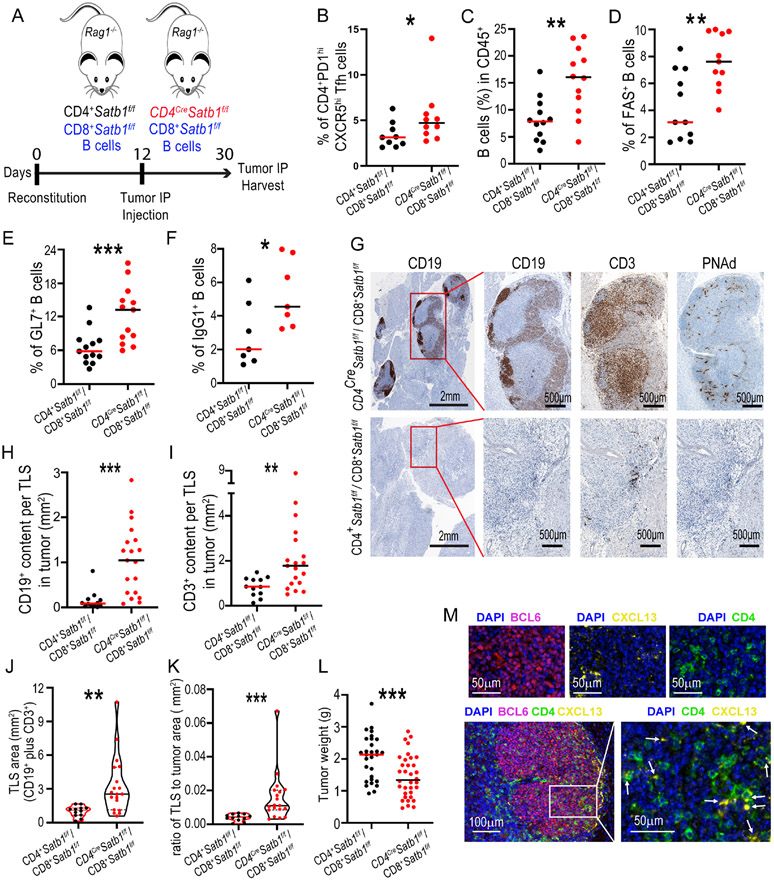
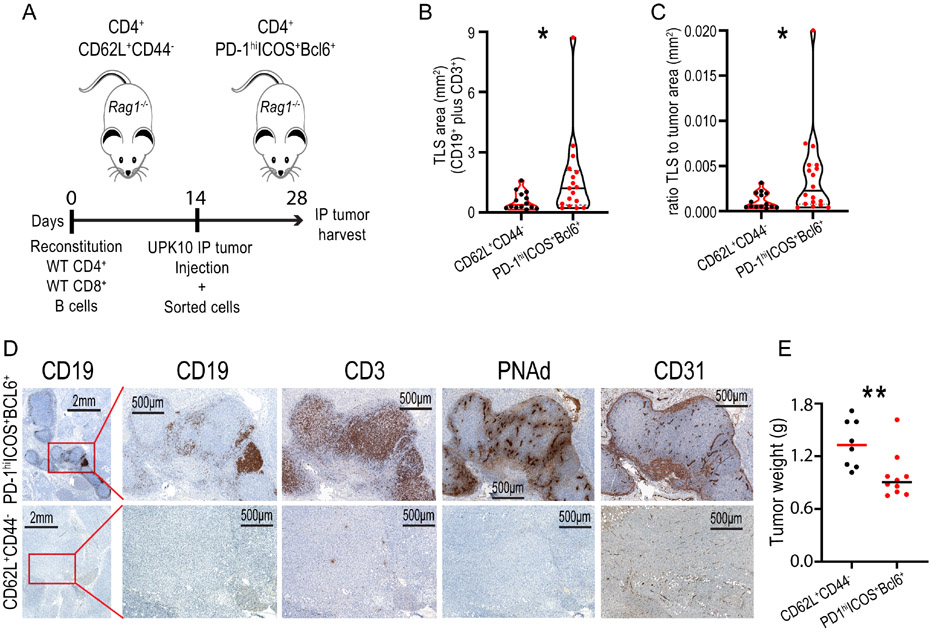
The immune checkpoint receptor PD-1 on T follicular helper (Tfh) cells promotes Tfh:B cell interactions and appropriate positioning within tissues. Here, we examined the impact of regulation of PD-1 expression by the genomic organizer SATB1 on Tfh cell differentiation. Vaccination of CD4CreSatb1f/f mice enriched for antigen-specific Tfh cells, and TGF-β-mediated repression of SATB1 enhanced Tfh differentiation of human T cells. Mechanistically, high Icos expression in Satb1-/- CD4+ T cells promoted Tfh cell differentiation by preventing T follicular regulatory cell skewing and resulted in increased isotype-switched B cell responses in vivo. Ovarian tumors in CD4CreSatb1f/f mice accumulated tumor antigen-specific, LIGHT+CXCL13+IL-21+ Tfh cells and tertiary lymphoid structures (TLS). TLS formation decreased tumor growth in a CD4+ T cell and CXCL13-dependent manner. The transfer of Tfh cells, but not naive CD4+ T cells, induced TLS at tumor beds and decreased tumor growth. Thus, TGF-β-mediated silencing of Satb1 licenses Tfh cell differentiation, providing insight into the genesis of TLS within tumors.

Keywords: B cell cancer; SATB1; T follicular helper cell; immuno-oncology; tertiary lymphoid structure; tumor immunology.


Conflict of interest statement

Declaration of interests J.R.C.-G. has stock options with Compass Therapeutics, Anixa Biosciences, and Alloy Therapeutics, receives honorarium from Anixa Biosciences, Alloy Therapeutics, and Leidos, and has sponsored research with Anixa Biosciences. R.L.: Clinical trial protocol committee–CG oncology; Scientific advisor/consultant–B.M.S., Ferring, Fergene, Arquer Diagnostics. B.A.P. has completed Advisory Board with AstraZeneca and has Research Support from B.M.S. J.R. is currently an employee of STEMCELL Technologies.

Figures

Figure 1.
Figure 1.. Repression of Satb1 licenses activated CD4+ T cells for effective Tfh cell differentiation.
(A, B) Quantification of the proportions of Tfh cells in the spleens (A) and inguinal lymph node (B) of OVA-vaccinated CD4CreSatb1f/f mice and Satb1f/f control littermates (n≥20), after 14 days. (C) Corresponding Satb1-dependent increases in OVA antigen-specific Tfh cells obtained from Ly5.1+ mice after transfer of purified naïve OT-II Satb1f/f (n=14) or OT-II CD4CreSatb1f/f (n=15) T cells, followed by immunization with NP-OVAL and analysis 5 days later. (D, E) Production of IL-21 (n=9) (D) and CXCL13 (n=13) (E) quantified through intracellular flow cytometry staining after stimulation with PMA (100 ng/mL), ionomycin (0.5 μg/mL) and brefeldin A (10 μg/mL) for 6 hours in CD3+CD4+Foxp3CD62LCD44+PD1hiCXCR5+ Tfh and naïve CD3+CD4+Foxp3CD62L+CD44 cells from the spleens of vaccinated mice as in A&B. (F) Serum levels of CXCL13 in OVA-vaccinated mice as in A&B. (G) Production of LIGHT/TNFSF14 quantified as in D&E (n=11). (H) Differential OVA-specific titers of total IgG responses in the serum of Satb1+/Satb1− (n=12) vaccinated mice as in A&B. Serum from naïve mice were used as control (n=6). (I) Quantification by flow cytometry of surface IgG1 and the GL7 and FAS markers of germinal center activity in splenic CD19+B220+ B cells in CD4CreSatb1f/f mice and littermates from A. Data are presented as median. A-E, G and H are pooled from ≥2 independent experiments. F&I are representative of at least three independent experiments. *p<0.05, **p≤0.01, ***p≤0.001.
Figure 2.
Figure 2.. TGF-β-mediated repression of SATB1 expression promotes Tfh cell phenotypes.
Representative dot-plots (left) and histograms (right) of the effect of TGF-β on human Tfh cell differentiation and SATB1 repression, respectively. Increased in vitro expression of human CXCR5+PD-1hi Tfh cells markers from peripheral naïve CD4+ T cells in the presence of TGF-β, under different Tfh cell skewing conditions: (A) (lower panel) hIL-23 plus hIL-10; (upper panel) hIL-23; (B) (lower panel) hIL-12 plus hIL-10; (upper panel) hIL-12. (C) TGF-β-dependent Tfh cell differentiation was associated with lower levels of SATB1 (D), as determined by intracellular staining. A-D data (n=3) are representative of two independent experiments with similar results and represent mean ± SEM. *p<0.05, **p≤0.01, ***p≤0.001.
Figure 3.
Figure 3.. Decreased expression of Satb1 promotes Tfh cell differentiation by derepressing Icos.
(A) Higher expression of Icos in Satb1−/− CD4+ T cells (n=11). (B) Higher proportions of Icos+CD4+ T cells among lymphocytes in the absence of Satb1 (n≥19). (C) Higher proportions of Icos+ Tfh cells after OVA vaccination in the presence of Satb1−/− CD4+ T cells (n=22). (D) (Left) Schematic depiction of Satb1 occupancy at the Icos promoter. Location of primers used for ChIP-PCR is indicated. (Right) Chromatin was immunoprecipitated with anti-Satb1 or control IgG from negatively immunopurified Satb1-competent mouse CD4+ T cells. Percent of input before immunoprecipitation (2.5% input values) was quantified by Real-Time Q-PCR (n=7). (E) anti-Icos / IgG (200 μg/mouse) was administered intraperitoneally in congenic Ly5.1+ mice reconstituted with OT-II-Satb1f/f vs. OT-II-CD4CreSatb1f/f splenocytes followed by immunization with NP-OVAL in alum, and Tfh cell differentiation was quantified in spleens 5 days later (n≥12). Data are presented as median and pooled from ≥2 independent experiments. **p≤0.01, ***p≤0.001.
Figure 4.
Figure 4.. Satb1 is required for the generation of induced regulatory T cells.
(A) Natural CD3+CD4+FoxP3+ Treg from the spleens of adult (week 10) Satb1−/− mice effectively suppressed CD3/CD28-induced T cell splenocyte activation in a dose-dependent manner. Representative of two independent experiments. (B) CD3+CD4+Foxp3CD62L+CD44 naïve T cells sorted from CD4CreSatb1f/fFoxP3GFP mice or control Satb1f/fFoxP3GFP littermates were in vitro differentiated to Treg cells for 3 days. Conversion into FoxP3+ Treg cells was compromised in CD4CreSatb1f/fFoxP3GFP cells. (C) (Left) Satb1-dependent differences in Treg conversion (n=15); (Right) Similar proliferation rates were observed under differentiation conditions for Satb1+/Satb1 populations. (D) ChIP-PCR for the CNS1 (left panel) and CNS2 (right panel) enhancers in Foxp3. Chromatin was immunoprecipitated with anti-Satb1 or control IgG from FoxP3+ Treg cells, in vitro differentiated from naïve Satb1-competent CD4+ T cells. Percent of input before immunoprecipitation (2.5% input values) was quantified by Real-Time Q-PCR (n=5). Mean and SEM are shown. (E) Representative dot plots showing the gating strategy for Tfh and Tfr cells in OVA-vaccinated mice carrying Satb1−/− T cells, compared to Satb1-competent littermates. (F) Reduced generation of PD-1hiCXCR5+Foxp3+ Tfr cells with corresponding increases in FoxP3 Tfh cells (n≥20). (G) Higher ratios Tfh to Tfr cells in Satb1−/− T cells compared to control littermates (n≥20). Data are presented as median and pooled from ≥2 independent experiments. ***p≤0.001.
Figure 5.
Figure 5.. Satb1-dependent Tfh cell differentiation promotes B cell responses and TLS formation in ovarian cancer.
(A, B) CD4CreSatb1f/f mice accumulated more Tfh cells in the spleen (A) and at UPK10 intraperitoneal tumor beds (B), compared to control Satb1f/f mice; (n≥16). (C) Higher ICOS expression in intra-tumoral Satb1−/− Tfh cells (n=17) and controls (n=18). (D) Corresponding increases in the accumulation of ICOS+CD4+ T cells at tumor beds (n=15). (E, F) Increased accumulation of isotype-switched B cells in the spleen (E) and at tumor beds (F) in CD4CreSatb1f/f mice, compared to Satb1-competent controls; (n=12). (G) B cell depletion using anti-B220 antibodies IP (200 μg/mouse; days −2, 0, 2, 4, 6 after tumor challenge) accelerates UPK10 tumor growth in Satb1f/f mice compared to isotype control (n≥9). (H) Spontaneous large PNAd+ TLS formation in intraperitoneal tumors in CD4CreSatb1f/f mice (top), compared to Satb1f/f mice (bottom). Representative of ≥3 independent experiments. (I) Quantification of TLS (defined as adjacent conglomerates of T cells and B-cells at tumor beds), based on the area covered by CD19+ cells plus the area covered by CD3+ cells). (J) Ratio of the area occupied by TLS to the entire tumor section. For I&J: Each point represents a single TLS in the CD4CreSatb1f/f (n=9 mice) and Satb1f/f n=11 mice) groups. (K) TLS assembly was abrogated upon CXCL13 blockade using anti-CXCL13 antibodies IP (150 μg/mouse; days 3, 6, 9 after tumor challenge). (L) Quantification of TLS after CXCL13 blocking as performed in I (2 independent experiments). (M) (Upper panel) Schematic depiction of the experiment. A chunk of IP tumor from a donor mouse was isolated and s.c. transplanted to a naïve recipient. (Lower panel) TLS undergo major changes in the distribution of T and B cells over time. Data are presented as median and pooled from ≥2 independent experiments. *p<0.05, **p≤0.01, ***p≤0.001.
Figure 6.
Figure 6.. Tfh cell-driven, TLS-associated humoral responses are associated with delayed malignant progression in ovarian cancer.
(A) Schematic depiction of the experiment. Rag1−/− mice were reconstituted with a mix of syngeneic wild-type CD8+ T cells, wild-type B-cells and either Satb1-competent or Satb1−/− CD4+ T cells. Mice were subsequently challenged with UPK10 intraperitoneal tumors and followed for malignant progression and humoral responses. (B-F) Flow cytometry quantification of (B) Tfh cells, (C) CD19+ B cells (n=12); (D, E) Germinal center markers FAS (n=11) and GL7 (n=13), and (F) B cell isotype switching at tumor beds in reconstituted Rag1−/− mice (n=7). (G) Spontaneous orchestration of large PNAd+ TLS in intraperitoneal tumors in Rag1−/− mice reconstituted with CD4CreSatb1f/f CD4+ T cells (Upper panel), but not upon reconstitution with Satb1f/f control CD4+ T cells (Lower panel). (H, I) Intra-tumoral TLS, defined as adjacent conglomerates (>0.1mm2) of CD3+ T cells and CD19+ B-cells at tumor beds, were quantified based on the (H) B cell content (CD19+ area) and (I) T cells (CD3+ area) inside the structure. (J) At least 60% of the Satb1−/− CD4+ T cells reconstituted mice, developed large TLS (>2 mm2) quantified as CD19+ plus CD3+ area. (K) Ratio of the area occupied by TLS to the entire tumor section. (L) Differences in IP tumor burden for the mice depicted in A. Each point represents the sum of total tumor content in a single mouse (n≥20). (M) Multiplex immunofluorescence for CD3+CD4+BCL6+CXCL13+ Tfh cells inside intra-tumoral TLS. G&M are representative of ≥3 independent experiments. From graphics H to K (n=10 mice) for both CD4CreSatb1f/f and Satb1f/f experimental groups. For J&K each point represents a single TLS. *p<0.05, **p≤0.01, ***p≤0.001.
Figure 7.
Figure 7.. Satb1-dependent Tfh cells trigger the formation of large TLS at tumor beds.
(A) Scheme of the experiment: Rag1−/− mice were reconstituted with a mix of syngeneic wild-type CD4+ and CD8+ T cells, and wild-type B-cells. Fourteen days later, mice were subsequently challenged with UPK10 intraperitoneal tumors, admixed with either CD3+CD4+PD-1hiICOS+(BCL-6+) Tfh cells or CD4+CD3+CD62L+CD44 naïve T cells, sorted from the tumor-draining inguinal lymph nodes of syngeneic tumor-bearing donor mice. TLS assembly was assessed after 14 days. BCL-6 expression was verified in sorted populations independently. (B) Quantification of total TLS area (TLS defined as adjacent conglomerates of CD3+ T cells and CD19+ B-cells) at tumor beds. (C) Ratio of the area occupied by TLS to the entire tumor section. (D) (Upper panel) Representative IHC of adjacent tumor sections showing large TLSs in Rag1−/− mice reconstituted with Tfh cells, consisting of defined areas of CD19+ and CD3+ aggregations with corresponding PNAd and CD31 positive signal, and its controls (Lower panel). (E) Differences in IP tumor growth for the mice depicted in A. Each point represents the sum of total tumor content in a single mouse (n≥8). Pooled from two independent experiments. For B&C each point represents a single TLS for both Tfh cell (n=4 mice) and naïve T cell (n=4 mice) groups. Data are presented as median and representative of two independent experiments with similar results. *p<0.05, **p≤0.01.

Comment in

References

    1. Allegrezza MJ, Rutkowski MR, Stephen TL, Svoronos N, Perales-Puchalt A, Nguyen JM, Payne KK, Singhal S, Eruslanov EB, Tchou J, and Conejo-Garcia JR (2016). Trametinib Drives T cell-Dependent Control of KRAS-Mutated Tumors by Inhibiting Pathological Myelopoiesis. Cancer Res 76, 6253–6265. - PMC - PubMed
    1. Biswas S, Mandal G, Payne KK, Anadon CM, Gatenbee CD, Chaurio RA, Costich TL, Moran C, Harro CM, Rigolizzo KE, et al. (2021). IgA transcytosis and antigen recognition govern ovarian cancer immunity. Nature 591, 464–470. - PMC - PubMed
    1. Buckley CD, Barone F, Nayar S, Benezech C, and Caamano J (2015). Stromal cells in chronic inflammation and tertiary lymphoid organ formation. Annu Rev Immunol 33, 715–745. - PubMed
    1. Cai S, Lee CC, and Kohwi-Shigematsu T (2006). SATB1 packages densely looped, transcriptionally active chromatin for coordinated expression of cytokine genes. Nat Genet 38, 1278–1288. - PubMed
    1. Cillo AR, Kurten CHL, Tabib T, Qi Z, Onkar S, Wang T, Liu A, Duvvuri U, Kim S, Soose RJ, et al. (2020). Immune Landscape of Viral- and Carcinogen-Driven Head and Neck Cancer. Immunity 52, 183–199 e189. - PMC - PubMed

Publication types

MeSH terms

Substances