

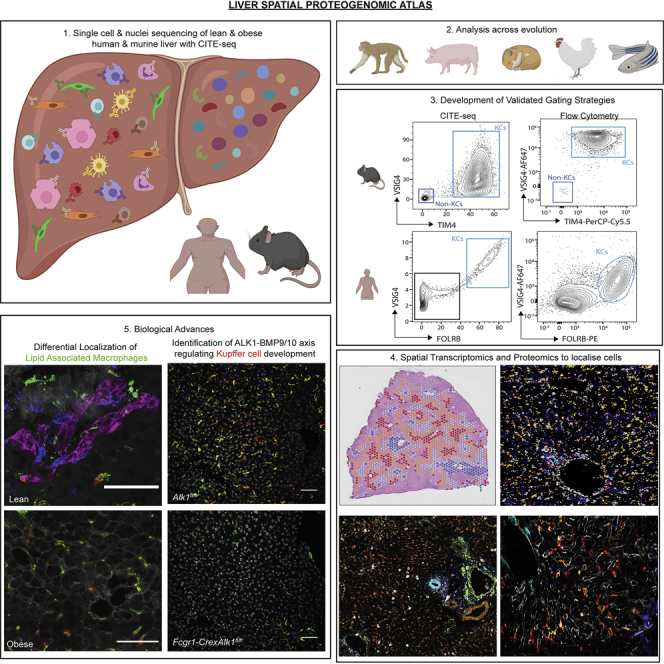
Spatial proteogenomics reveals distinct and evolutionarily conserved hepatic macrophage niches
- PMID: 35021063
- PMCID: PMC8809252
- DOI: 10.1016/j.cell.2021.12.018
Spatial proteogenomics reveals distinct and evolutionarily conserved hepatic macrophage niches
Abstract
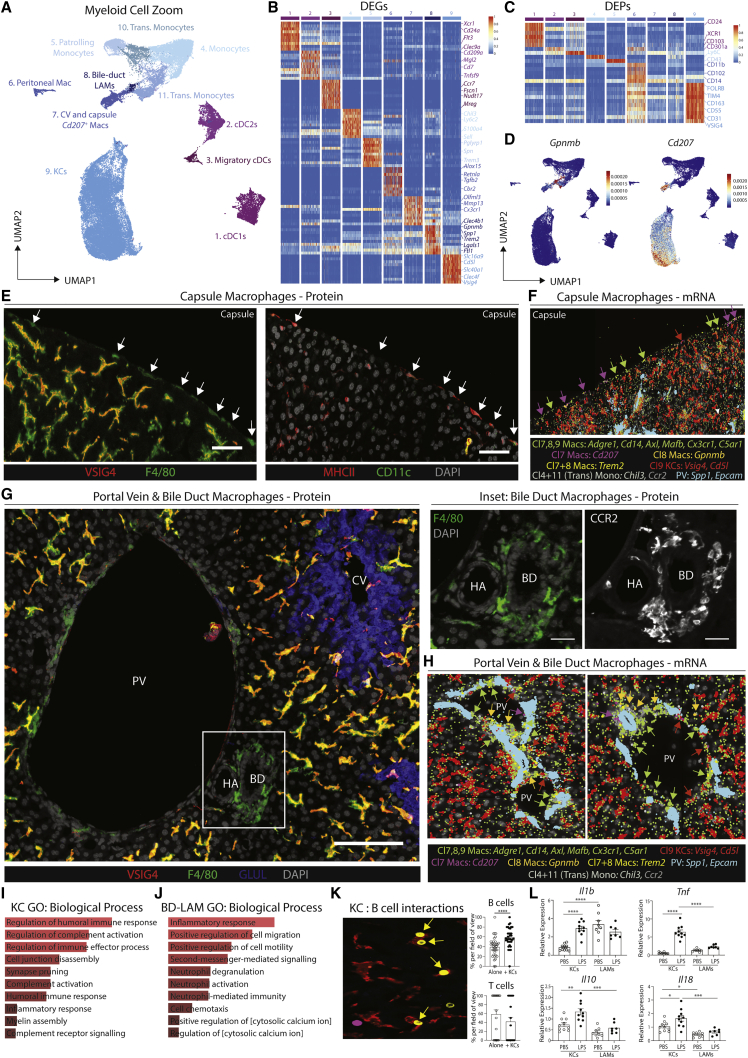
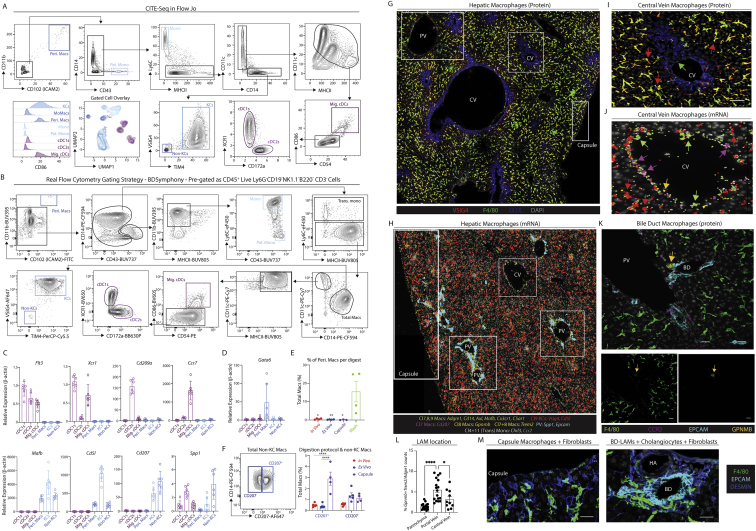
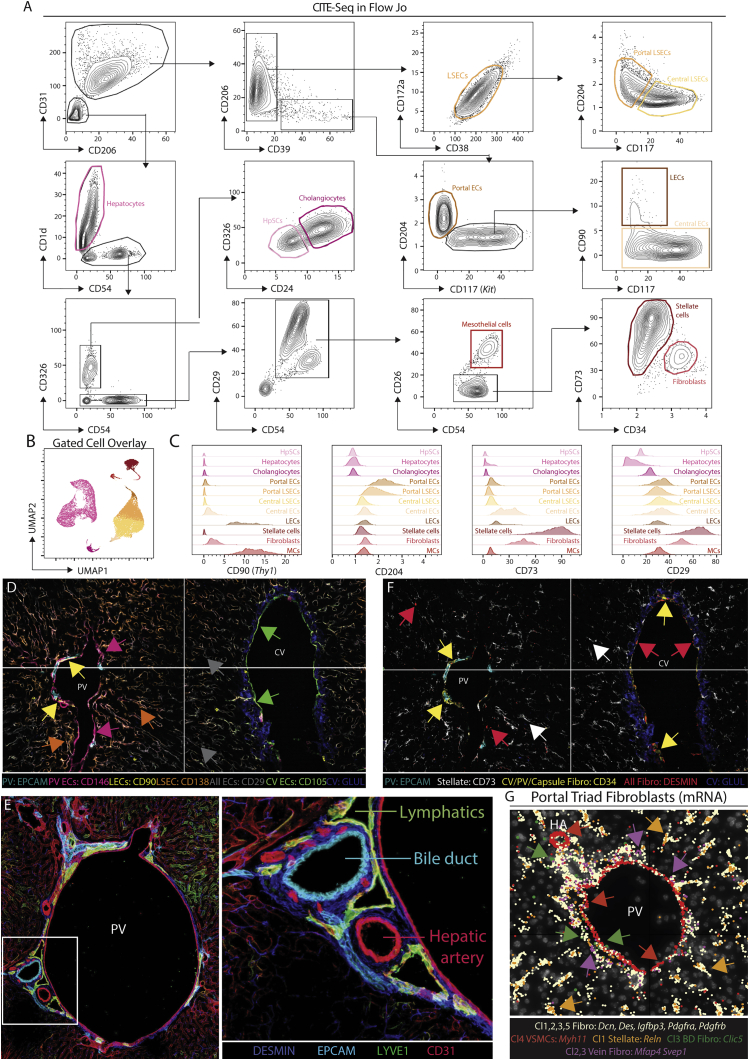
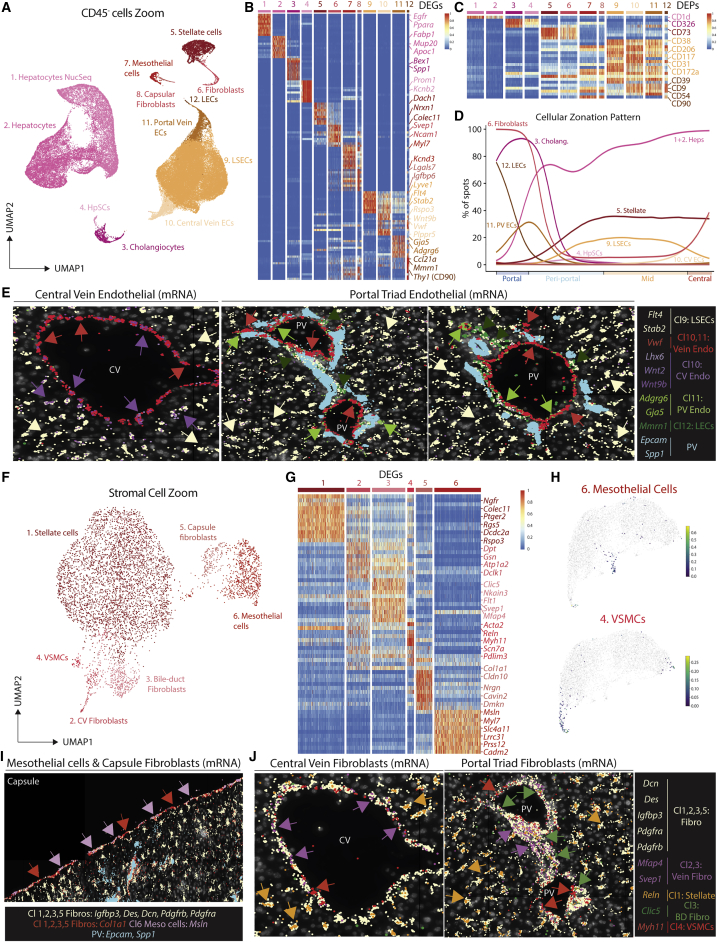
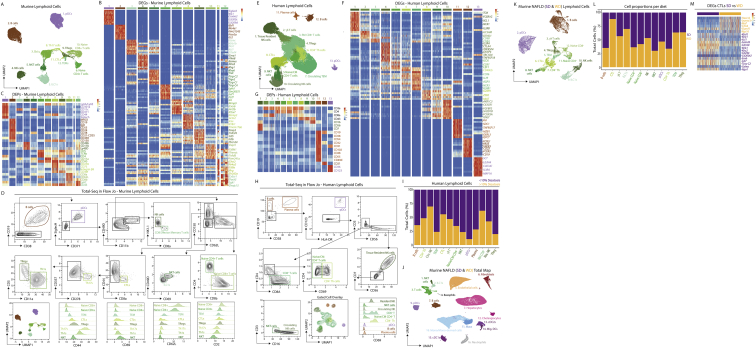
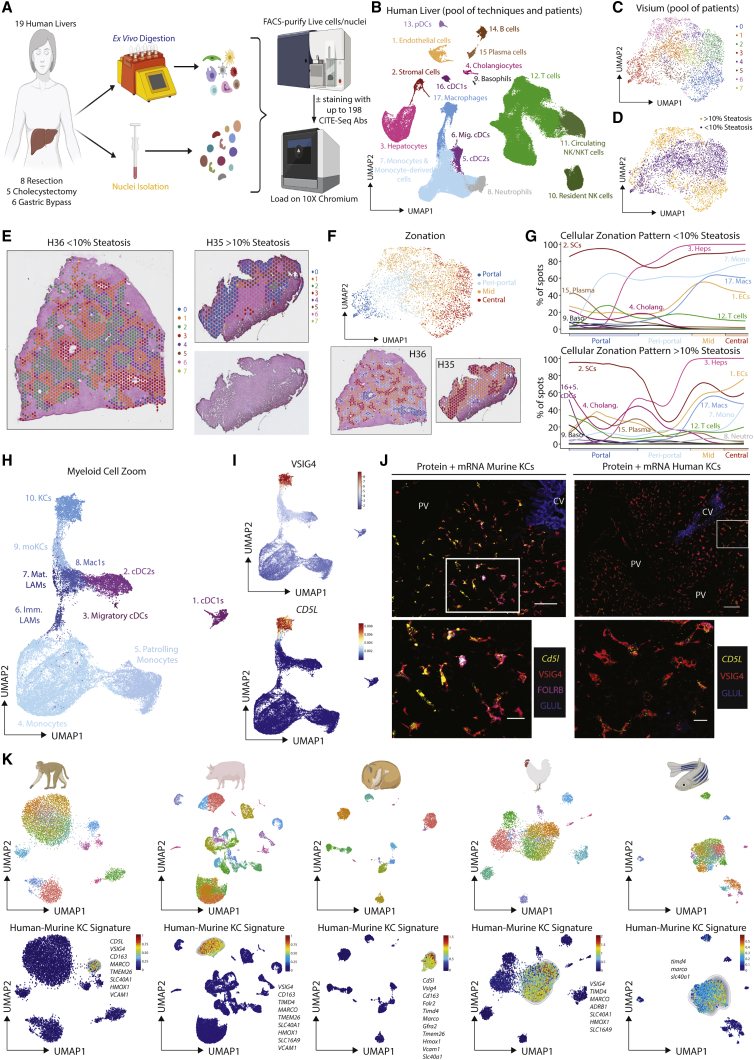
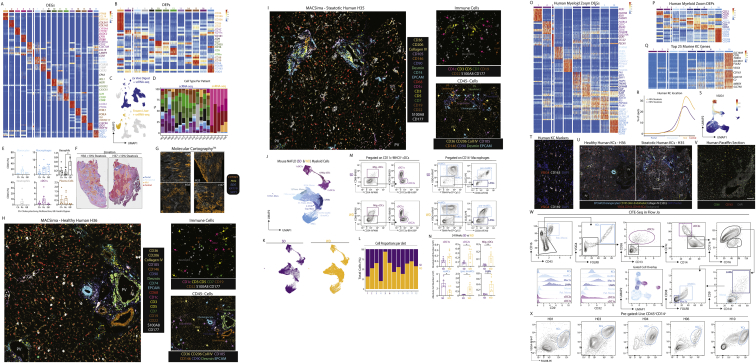
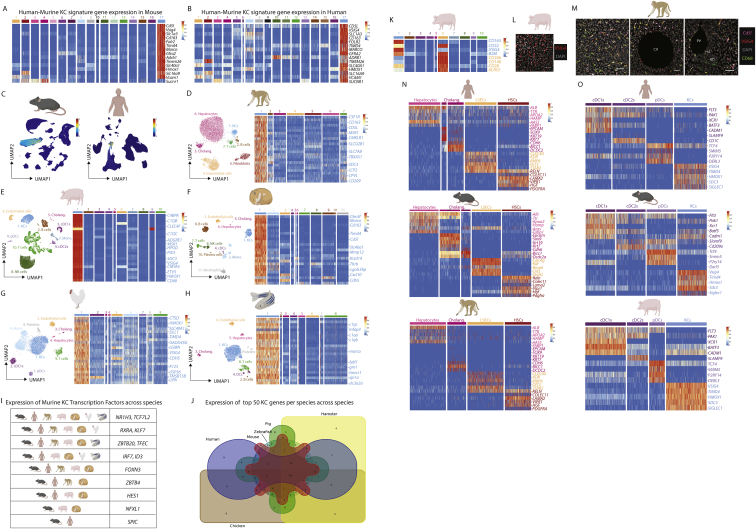
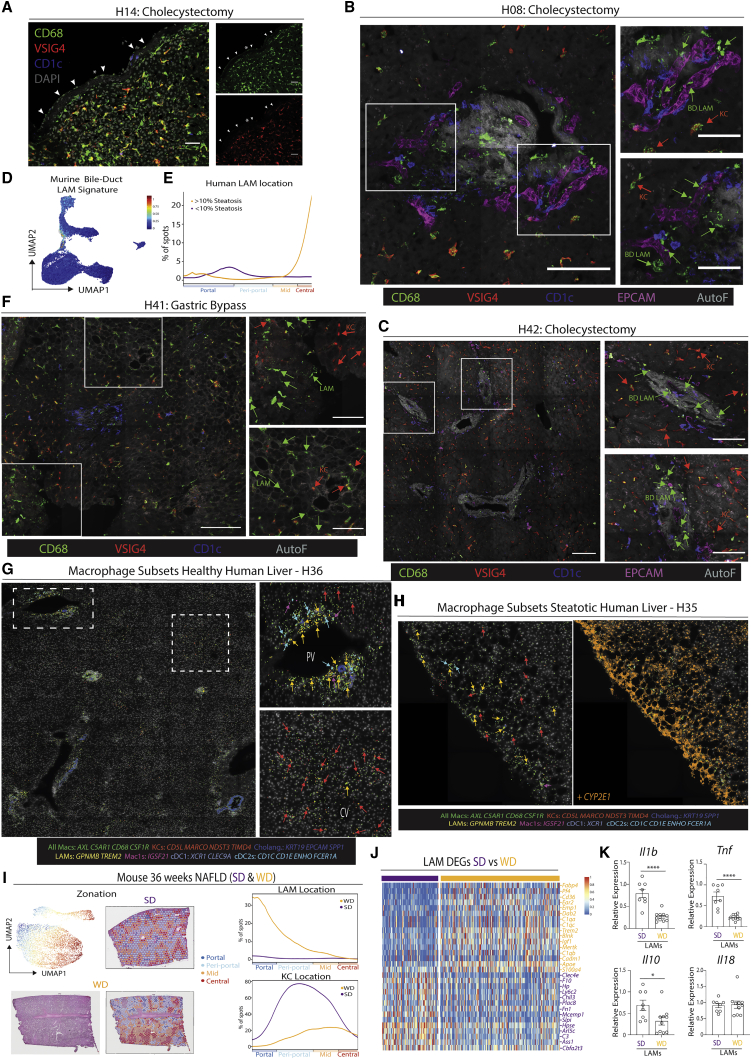
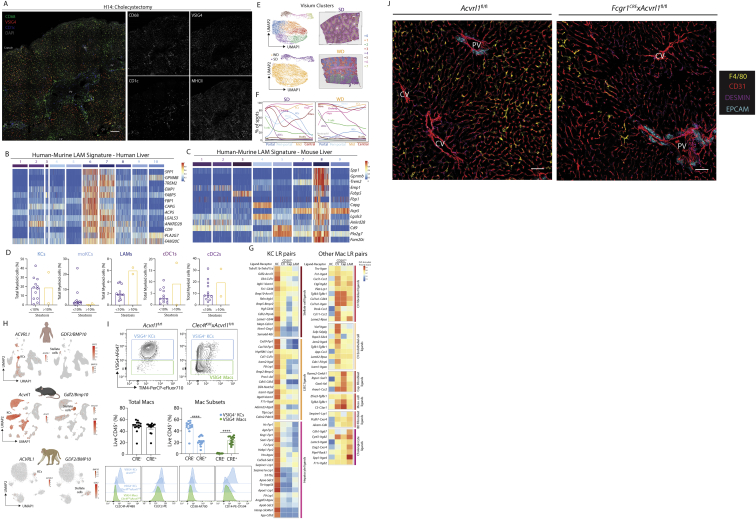
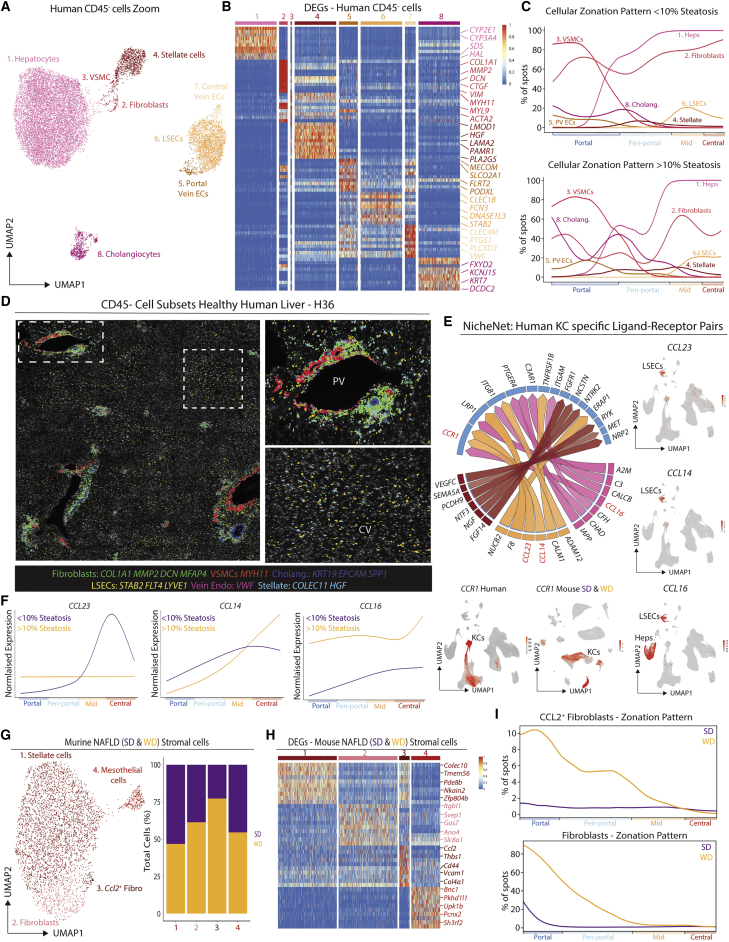
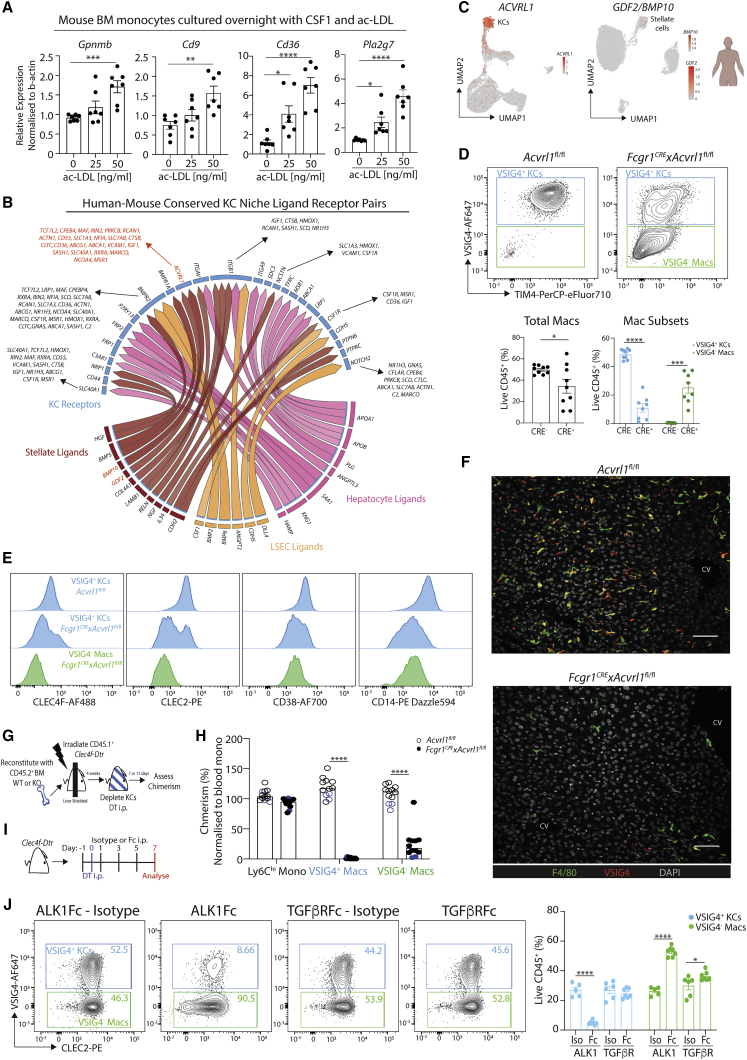
The liver is the largest solid organ in the body, yet it remains incompletely characterized. Here we present a spatial proteogenomic atlas of the healthy and obese human and murine liver combining single-cell CITE-seq, single-nuclei sequencing, spatial transcriptomics, and spatial proteomics. By integrating these multi-omic datasets, we provide validated strategies to reliably discriminate and localize all hepatic cells, including a population of lipid-associated macrophages (LAMs) at the bile ducts. We then align this atlas across seven species, revealing the conserved program of bona fide Kupffer cells and LAMs. We also uncover the respective spatially resolved cellular niches of these macrophages and the microenvironmental circuits driving their unique transcriptomic identities. We demonstrate that LAMs are induced by local lipid exposure, leading to their induction in steatotic regions of the murine and human liver, while Kupffer cell development crucially depends on their cross-talk with hepatic stellate cells via the evolutionarily conserved ALK1-BMP9/10 axis.
Keywords: CITE-seq; Kupffer cell; NAFLD; across species; atlas; lipid-associated macrophage; liver; multi-omic; proteogenomic; spatial transcriptomics.
Copyright © 2021 The Authors. Published by Elsevier Inc. All rights reserved.
Conflict of interest statement
Declaration of interests The authors declare no competing interests.
Figures
Comment in
-
To be or not to be a hepatic niche macrophage.Immunity. 2022 Feb 8;55(2):198-200. doi: 10.1016/j.immuni.2022.01.008. Immunity. 2022. PMID: 35139350
-
Location, location, location - spatial insight into hepatic macrophage populations.Nat Rev Gastroenterol Hepatol. 2022 May;19(5):281-282. doi: 10.1038/s41575-022-00600-2. Nat Rev Gastroenterol Hepatol. 2022. PMID: 35288701 No abstract available.
References
-
- Berg S., Kutra D., Kroeger T., Straehle C.N., Kausler B.X., Haubold C., Schiegg M., Ales J., Beier T., Rudy M., et al. Ilastik: interactive machine learning for (bio)image analysis. Nat. Methods. 2019;16:1226–1232. - PubMed
-
- Bittmann I., Bottino A., Baretton G.B., Gerbes A.L., Zachoval R., Rau H.G., Löhrs U. The role of graft-resident Kupffer cells and lymphocytes of donor type during the time course after liver transplantation—a clinico-pathological study. Virchows Arch. 2003;443:541–548. - PubMed
Publication types
MeSH terms
Substances
LinkOut - more resources
Full Text Sources
Other Literature Sources
Molecular Biology Databases
