. 2022 Jan 20;185(2):250-265.e16.
doi: 10.1016/j.cell.2021.12.021. Epub 2022 Jan 11.

Engineered virus-like particles for efficient in vivo delivery of therapeutic proteins

Affiliations

Engineered virus-like particles for efficient in vivo delivery of therapeutic proteins

Samagya Banskota et al. Cell. .

Abstract

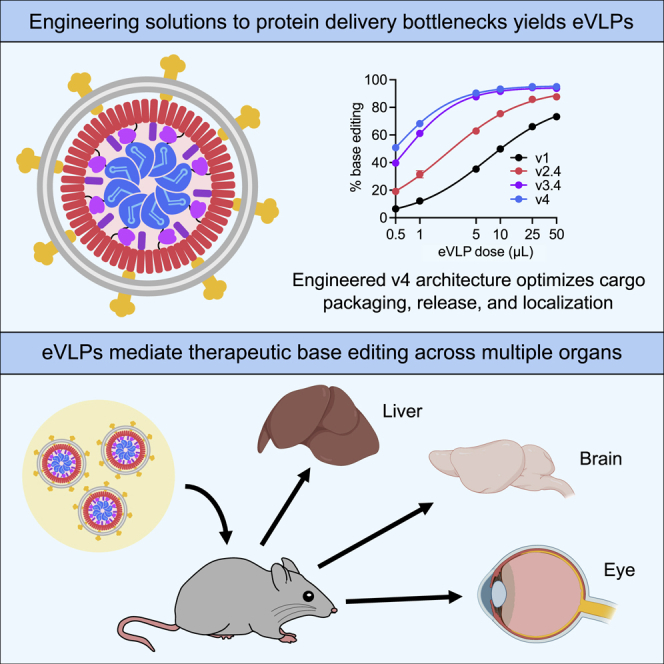
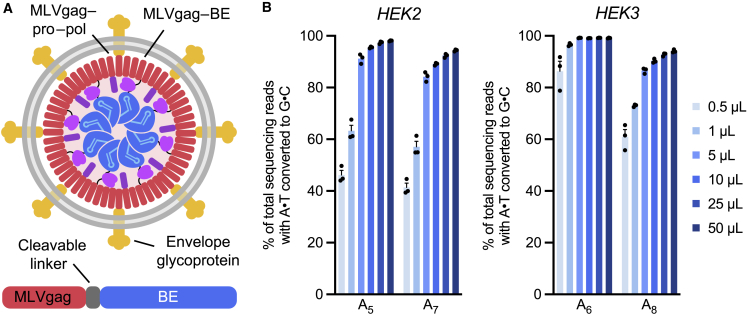
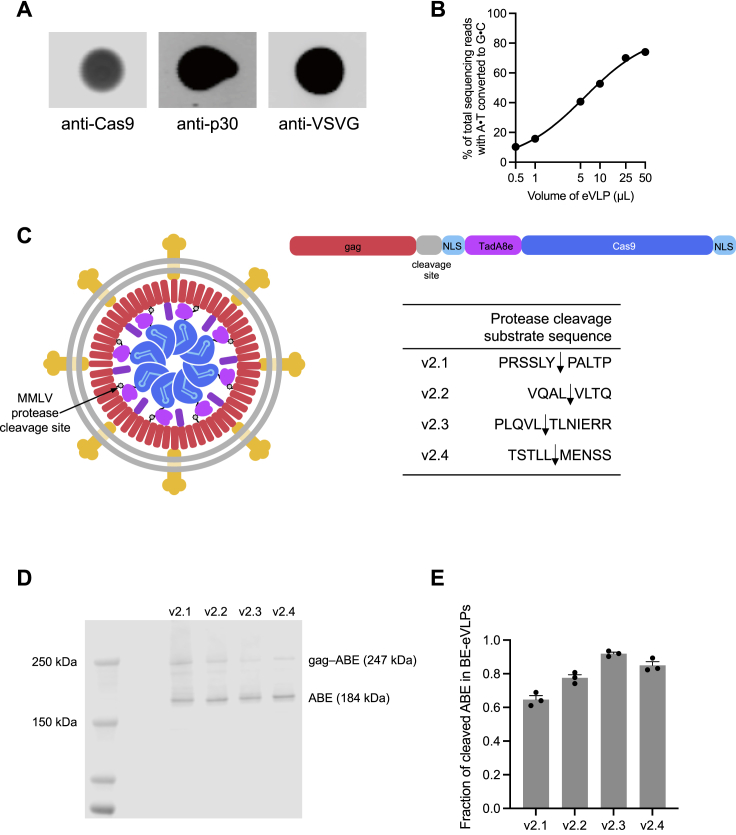
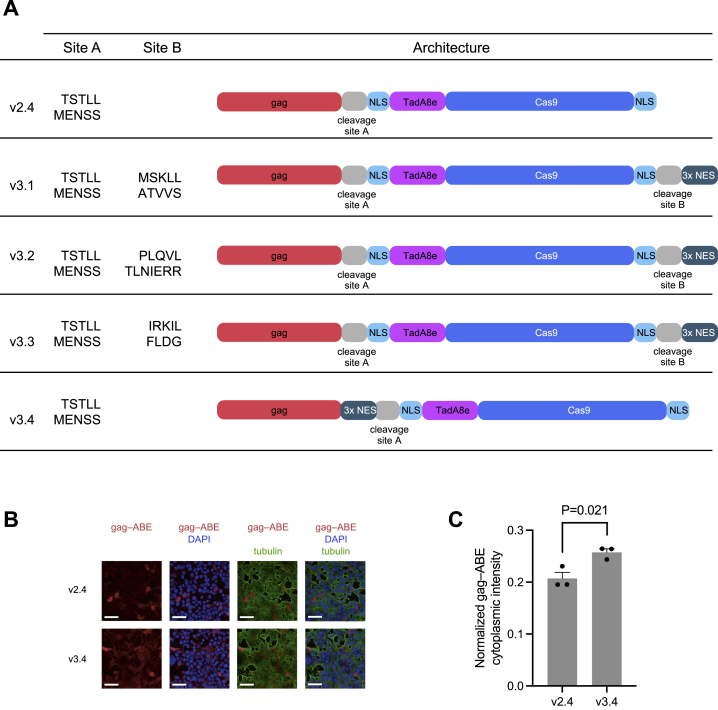
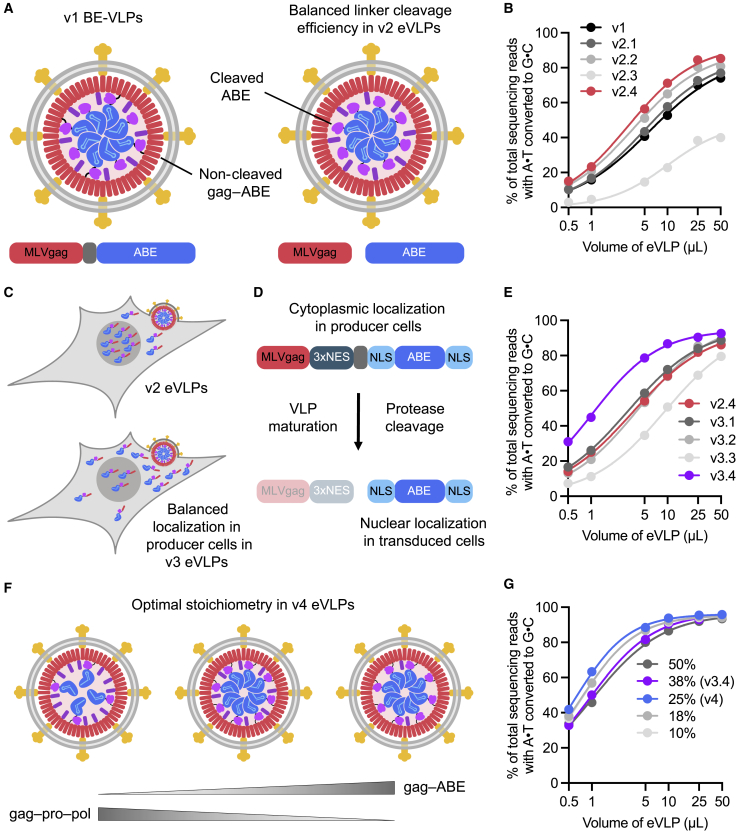
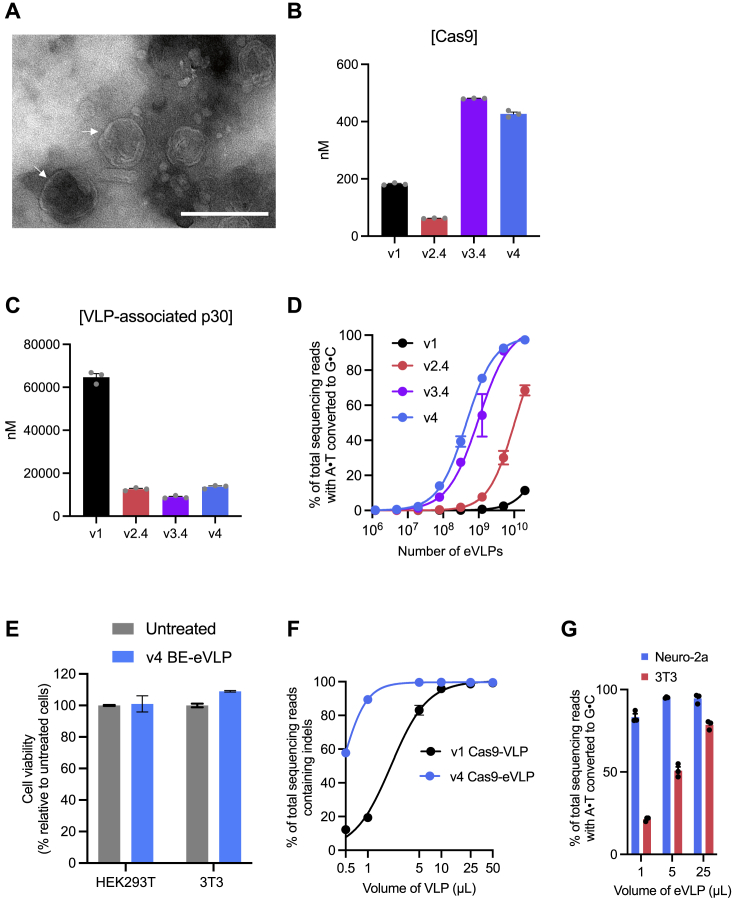
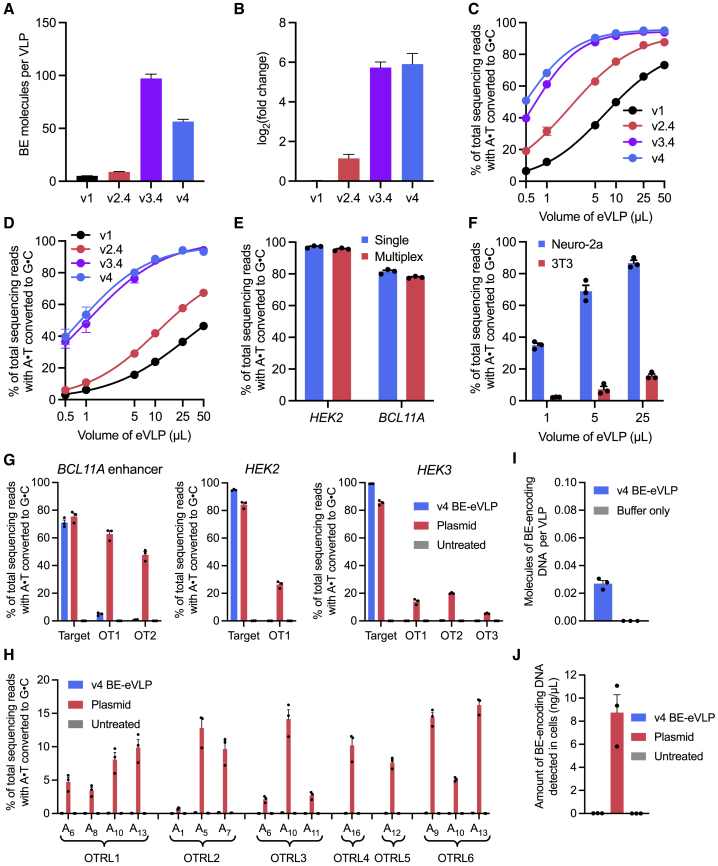
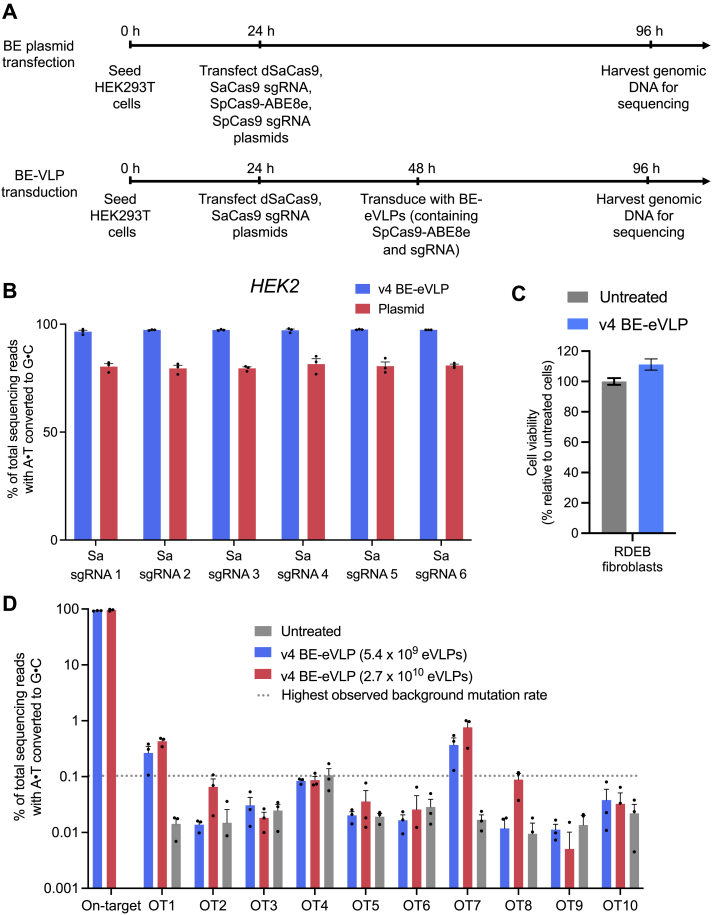
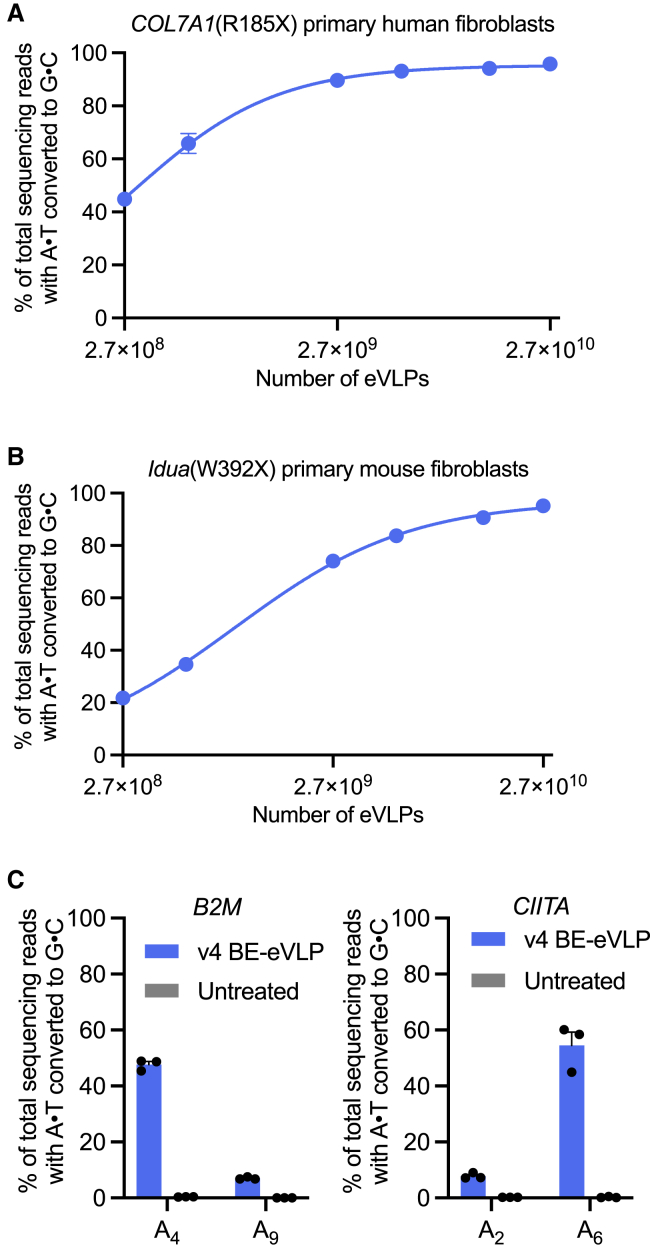
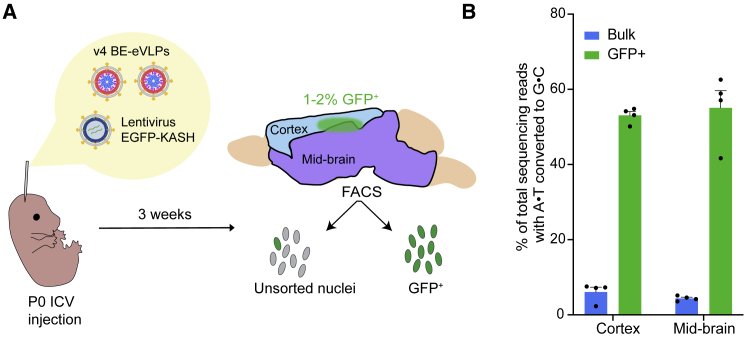
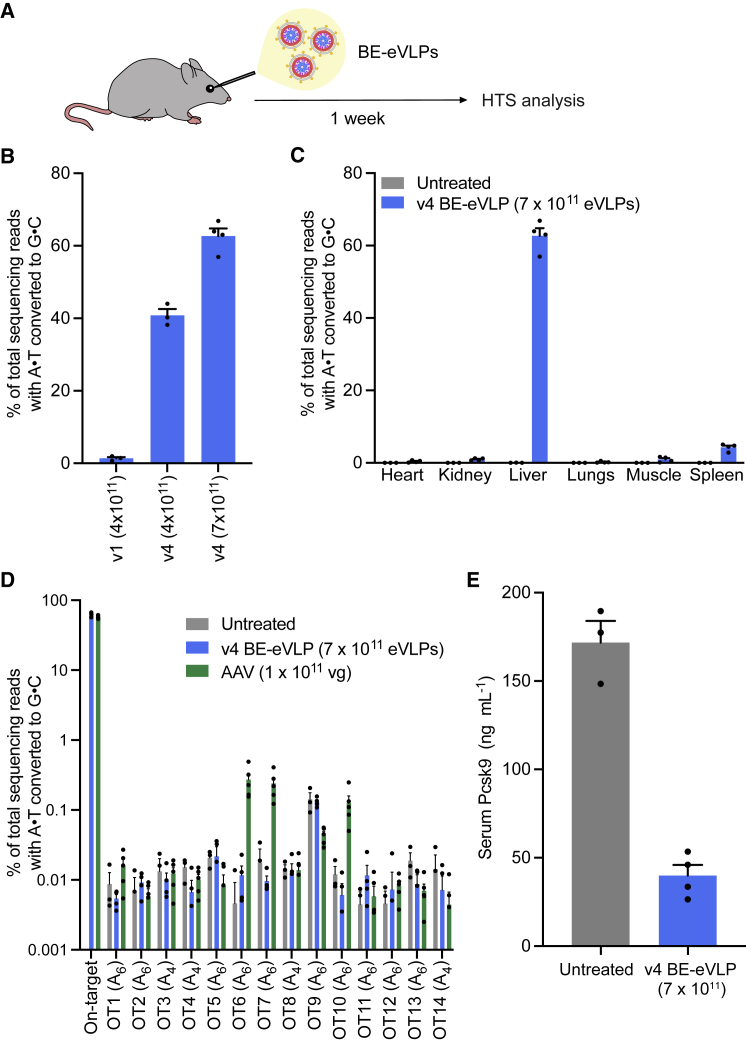
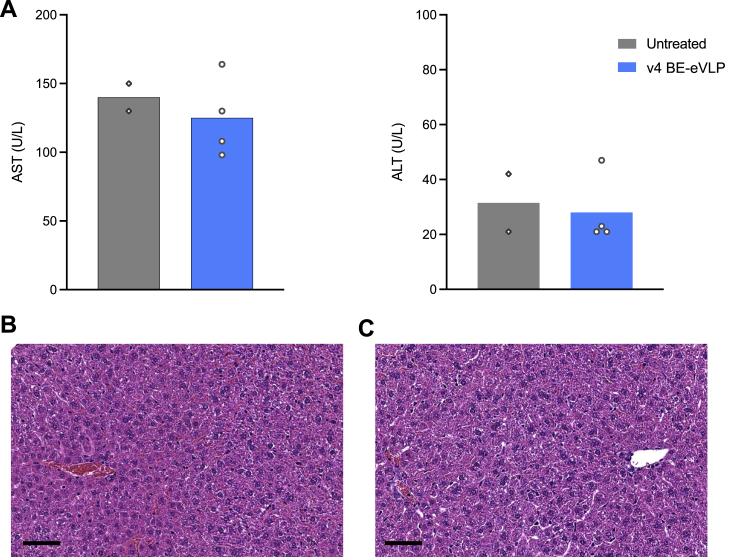
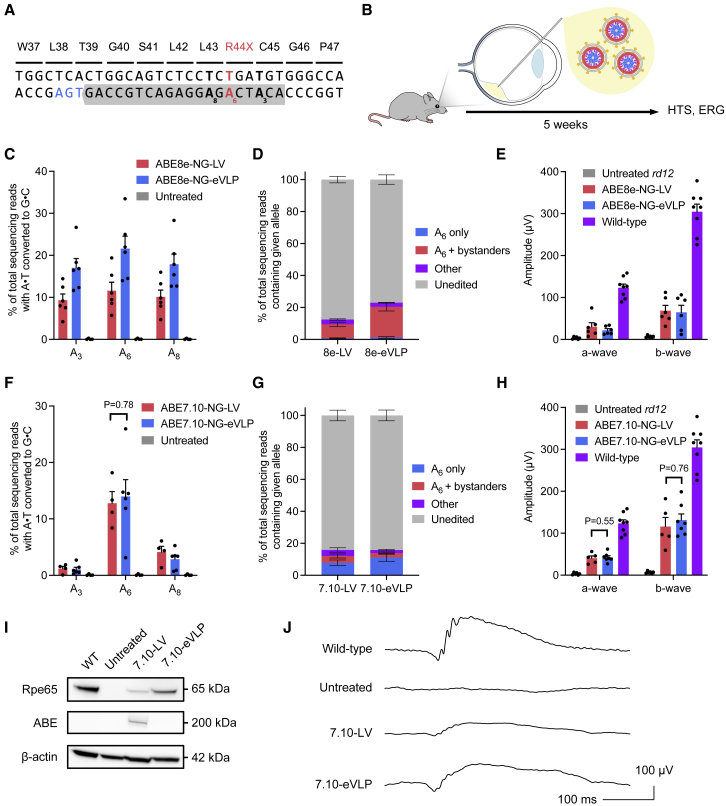
Methods to deliver gene editing agents in vivo as ribonucleoproteins could offer safety advantages over nucleic acid delivery approaches. We report the development and application of engineered DNA-free virus-like particles (eVLPs) that efficiently package and deliver base editor or Cas9 ribonucleoproteins. By engineering VLPs to overcome cargo packaging, release, and localization bottlenecks, we developed fourth-generation eVLPs that mediate efficient base editing in several primary mouse and human cell types. Using different glycoproteins in eVLPs alters their cellular tropism. Single injections of eVLPs into mice support therapeutic levels of base editing in multiple tissues, reducing serum Pcsk9 levels 78% following 63% liver editing, and partially restoring visual function in a mouse model of genetic blindness. In vitro and in vivo off-target editing from eVLPs was virtually undetected, an improvement over AAV or plasmid delivery. These results establish eVLPs as promising vehicles for therapeutic macromolecule delivery that combine key advantages of both viral and nonviral delivery.

Keywords: base editing; genome editing; in vivo delivery; ribonucleoproteins; therapeutic gene editing; virus-like particles.


Conflict of interest statement

Declaration of interests The authors declare competing financial interests: S.B., A.R., and D.R.L. have filed patent applications on this work through the Broad Institute. K.M. is a consultant and equity holder of Verve Therapeutics and Variant Bio. K.P. is chief scientific officer of Polgenix, Inc. D.R.L. is a consultant and equity holder of Prime Medicine, Beam Therapeutics, Pairwise Plants, and Chroma Medicine, companies that use gene editing or genome engineering.

Figures

None
Graphical abstract
Figure 1
Figure 1
BE-VLP architecture and initial (v1) editing efficiencies (A) Schematic of BE-VLPs. Base-editor (BE) protein is fused to the C-terminus of murine leukemia virus (MLV) gag polyprotein via a linker that is cleaved by the MLV protease upon particle maturation. (B) Adenine base editing efficiencies of v1 BE-VLPs at two genomic loci in HEK293T cells. The protospacer positions of the target adenines are denoted by subscripts (i.e., A5, adenine at position 5), where the PAM is positions 21–23. Data are shown as individual data points and mean ± SEM for n = 3 biological replicates.
Figure S1
Figure S1
Engineering and characterization of v1 BE-VLPs and v2 BE-eVLPs, related to Figures 1 and 2 (A) Validation of VLP production. Immunoblot analysis of proteins from purified BE-VLPs using anti-Cas9, anti-p30 and anti-VSV-G antibodies. (B) Adenine base editing efficiencies of v1 BE-VLPs at position A7 of the BCL11A enhancer site in HEK293T cells. Values and error bars reflect mean ± SEM of n = 3 biological replicates. Data were fit to four-parameter logistic curves using nonlinear regression. (C) Schematic of an immature BE-VLP with ABE8e fused to the gag structural protein. Various MMLV protease cleavage sites were inserted between gag and ABE8e to determine the optimal cleavable sequence that promotes liberation of ABE8e from gag during proteolytic virion maturation. Arrows indicate the cleavage site. (D) Representative western blot evaluating cleaved ABE8e versus full-length gag–ABE8e in purified v2 BE-eVLP variants. (E) Densitometry-based quantification of the cleaved ABE8e fraction from western blots. Data are shown as individual data points and mean values ± SEM for n = 3 technical replicates.
Figure S2
Figure S2
Improving gag–ABE localization in producer cells, related to Figure 2 (A) v2.4 and v3 BE-eVLP constructs. Three HIV NESs were fused to either the C-terminus or N-terminus of the gag–ABE fusion. We incorporated a protease-cleavable linker between ABE and the NES sequences such that the final BE cargo would be devoid of NESs following proteolytic virion maturation. (B) Representative immunofluorescence image of producer cells transfected with the v2.4 gag–ABE construct or the v3.4 gag–3xNES–ABE construct. After 48 h post-transfection, cells were fixed in paraformaldehyde and stained with anti-tubulin antibody (green) to stain the cytoskeleton, DAPI (blue) for nuclei staining and anti-Cas9 antibody (red) to visualize the gag–ABE fusion. Scale bars, 50 μm. (C) Automated image analysis-based quantification of cytoplasmic localization of the v2.4 gag–ABE construct or the v3.4 gag–3xNES–ABE construct. Data are shown as individual data points and mean values ± SEM for n = 3 technical replicates. p values were calculated using a two-sided t test.
Figure 2
Figure 2
Identifying and engineering solutions to bottlenecks that limit VLP potency results in v2, v3, and v4 eVLPs (A) More efficient linker cleavage leads to improved cargo release after VLP maturation. (B) Adenine base editing efficiencies of v1 and v2 BE-eVLPs at position A7 of the BCL11A enhancer site in HEK293T cells. (C) Improved localization of cargo in producer cells leads to more efficient incorporation into eVLPs. (D) Installing a 3xNES motif upstream of the cleavable linker encourages cytoplasmic localization of gag–3xNES–cargo in producer cells but nuclear localization of free ABE cargo in transduced cells. (E) Adenine base editing efficiencies of v2.4 and v3 BE-eVLPs at position A7 of the BCL11A enhancer site in HEK293T cells. (F) The optimal gag–cargo:gag–pro–pol stoichiometry balances the amount of cargo protein per particle with the amount of MMLV protease required for efficient particle maturation. (G) Adenine base editing efficiencies of v3.4 eVLPs with different gag–ABE:gag–pro–pol stoichiometries at position A7 of the BCL11A enhancer site in HEK293T cells. Legend denotes % gag–ABE plasmid of the total amount of gag–ABE and gag–pro-pol plasmids. (B, E, and G) Values and error bars reflect mean ± SEM of n = 3 biological replicates. Data were fitted to four-parameter logistic curves using nonlinear regression.
Figure S3
Figure S3
Characterization of BE-eVLPs, related to Figure 3 (A) Representative negative-stain transmission electron micrograph (TEM) of v4 BE-eVLPs. Scale bar, 200 nm. (B and C) Protein content for v1, v2.4, v3.4, and v4 BE-eVLPs was measured by anti-Cas9 or anti-MLV(p30) ELISA. Data are shown as individual data points and mean values ± SEM for n = 3 technical replicates. (D) Comparison of editing efficiencies with particle number-normalized v1, v2.4, v3.4 and v4 BE-VLPs at the BCL11A enhancer site in HEK293T cells. Data are shown as mean values ± SEM for n = 3 biological replicates. (E) Cell viability after v4 BE-eVLP treatment of HEK293T cells and NIH 3T3 fibroblasts. Data are shown as mean values ± SEM for n = 3 biological replicates. (F) Indels frequencies generated by v1 Cas9-VLP and v4 Cas9-eVLPs at the EMX1 locus in HEK293T cells. Data are shown as mean values ± SEM for n = 3 biological replicates. Data were fit to four-parameter logistic curves using nonlinear regression. (G) Adenine base editing efficiencies of VSV-G-pseudotyped v4 BE-eVLPs in Neuro-2a cells or 3T3 fibroblasts. Data are shown as individual data points and mean values ± SEM for n = 3 biological replicates.
Figure 3
Figure 3
Characterization of BE-eVLPs (A) Quantification of BE molecules per eVLP by anti-Cas9 and anti-MLV (p30) ELISA. Values and error bars reflect mean ± SEM of n = 3 replicates. (B) Quantification of relative sgRNA abundance by RT-qPCR using sgRNA-specific primers, normalized relative to v1 sgRNA abundance. Values and error bars reflect mean ± SEM of n = 3 technical replicates. (C and D) Comparison of editing efficiencies with v1, v2.4, v3.4, and v4 BE-eVLPs at the BCL11A enhancer site in HEK293T cells (C) and at the Dnmt1 site in NIH 3T3 cells (D). Values and error bars reflect mean ± SEM of n = 3 biological replicates. Data were fitted to four-parameter logistic curves using nonlinear regression. (E) Adenine base editing efficiencies in HEK293T cells of either single v4 BE-eVLPs targeting the HEK2 or BCL11A enhancer loci separately, or multiplex v4 BE-eVLPs targeting both loci simultaneously. (F) Adenine base editing efficiencies of FuG-B2-pseudotyped v4 BE-eVLPs at the Dnmt1 locus in Neuro-2a cells or 3T3 fibroblasts. (G) Adenine base editing efficiencies at three on-target genomic loci and their corresponding Cas-dependent off-target sites in HEK293T cells treated with v4 BE-eVLPs or ABE8e plasmid. OT1, off-target site 1; OT2, off-target site 2; OT3, off-target site 3. (H) Cas-independent off-target editing frequencies at six off-target R-loops in HEK293T cells treated with v4 BE-eVLPs or ABE8e plasmid. OTRL, off-target R-loop. See also Figure S4A for the experimental timeline and Figure S4B for on-target editing controls. (I) Molecules of BE-encoding DNA per v4 BE-eVLP detected by qPCR of lysed eVLPs or lysis buffer only. (J) Amount of BE-encoding DNA detected by qPCR of lysate from HEK293T cells that were either treated with v4 BE-eVLPs or transfected with BE-encoding plasmids. (E–J) Data are shown as individual data points and mean ± SEM for n = 3 biological replicates.
Figure S4
Figure S4
Off-target editing by v4 BE-eVLPs, related to Figures 3 and 4 (A) Experimental timeline for the orthogonal R-loop assay. (B) On-target editing controls for the orthogonal R-loop experiment. Data are shown as individual data points and mean values ± SEM for n = 3 biological replicates. (C) Cell viability following v4 BE-eVLP treatment of RDEB fibroblasts. Data are shown as mean values ± SEM for n = 3 biological replicates. (D) DNA sequencing reads containing A⋅T-to-G⋅C mutations within protospacer positions 4–10 for ten previously identified off-target loci from the genomic DNA of v4-BE-eVLP-treated RDEB patient-derived fibroblasts. The dotted gray line represents the highest observed background mutation rate of 0.1%. Data are shown as individual data points and mean values ± SEM for n = 3 biological replicates.
Figure 4
Figure 4
Base editing in primary human and mouse cells using v4 BE-eVLPs (A) Correction efficiencies of the COL7A1(R185X) mutation in patient-derived primary human fibroblasts. (B) Correction efficiencies of the Idua(W392X) mutation in primary mouse fibroblasts. (A and B) Values and error bars reflect mean ± SEM of n = 3 biological replicates. Data were fitted to four-parameter logistic curves using nonlinear regression. (C) Adenine base editing efficiencies at the B2M and CIITA loci in primary human T cells. Data are shown as individual data points and mean ± SEM for n = 3 biological replicates.
Figure 5
Figure 5
In vivo base editing in the central nervous system using v4 BE-eVLPs (A) Schematic of P0 ICV injections of v4 BE-eVLPs. Dnmt1-targeting v4 BE-eVLPs were co-injected with a lentivirus encoding EGFP-KASH. Tissue was harvested 3 weeks post-injection, and cortex and mid-brain were separated. Nuclei were dissociated for each tissue and analyzed by high-throughput sequencing as bulk unsorted (all nuclei) or GFP+ nuclei. (B) Adenine base editing efficiencies at the Dnmt1 locus in bulk unsorted (all nuclei) and GFP+ populations. Data are shown as individual data points and mean ± SEM for n = 4 mice.
Figure S5
Figure S5
Flow cytometry analysis for nuclei sorting from the mouse brain after P0 ICV injection, related to Figure 5 (A) Singlet nuclei were gated based on FSC/BSC ratio and DyeCycle Ruby signal. The first row demonstrates the gating strategy on a GFP-negative sample. Bulk nuclei correspond to events that passed gate D for singlet nuclei. (B) Percentage of GFP-positive nuclei measured by flow cytometry following P0 ICV injection. Data are shown as mean values + SEM for n = 3 biological replicates.
Figure 6
Figure 6
In vivo knockdown of Pcsk9 from a single systemic injection of v4 BE-eVLPs (A) Schematic of systemic injections of BE-eVLPs. Pcsk9-targeting BE-eVLPs were injected retro-orbitally into 6- to 7-week-old C57BL/6J mice. Organs were harvested one week after injection and the genomic DNA of unsorted cells was sequenced. (B) Adenine base editing efficiencies at the Pcsk9 exon 1 splice donor in the mouse liver after systemic injection of v1 BE-VLPs or v4 BE-eVLPs. Data are shown as individual data points and mean ± SEM for n = 3 mice (v1 BE-VLP and v4 BE-eVLP at 4 × 1011 VLPs) or n = 4 mice (v4 BE-eVLP at 7 × 1011 eVLPs). (C) Adenine base editing efficiencies at the Pcsk9 exon 1 splice donor in the mouse heart, kidney, liver, lungs, muscle, and spleen after systemic injection of 7 × 1011 v4 BE-eVLPs. Data are shown as individual data points and mean ± SEM for n = 4 mice (treated) or n = 3 mice (untreated). (D) DNA sequencing reads containing A⋅T-to-G⋅C mutations within protospacer positions 4–10 for the 14 CIRCLE-seq-nominated off-target loci from the livers of v4 BE-eVLP-treated, AAV-treated, and untreated mice. Data are shown as individual data points and mean ± SEM for n = 4 mice (BE-eVLP), n = 5 mice (AAV), or n = 3 mice (untreated). vg, viral genomes. (E) Serum Pcsk9 levels as measured by ELISA. Data are shown as individual data points and mean ± SEM for n = 4 mice (treated) or n = 3 mice (untreated).
Figure S6
Figure S6
Assessment of liver toxicity following systemic v4 BE-eVLP injection, related to Figure 6 (A) Plasma aspartate transaminase (AST) and alanine transaminase (ALT) levels one week after v4 BE-eVLP injection. (B and C) Histopathological assessment by hematoxylin and eosin staining of livers at 1 week post-injection of (B) untreated mice and (C) v4 BE-eVLP-treated mice. A representative example of each is shown. Scale bars, 50 μm.
Figure 7
Figure 7
In vivo base editing by v4 BE-eVLPs in a mouse model of genetic blindness (A) Schematic of Rpe65 exon 3 surrounding the R44X mutation (in red), which can be corrected by an A⋅T-to-G⋅C conversion at position A6 in the protospacer (shaded gray, PAM in blue). (B) Schematic of subretinal injections. Five weeks post-injection, phenotypic rescue was assessed via ERG and tissues were subsequently harvested for sequencing. HTS, high-throughput sequencing; ERG, electroretinography. (C) Adenine base editing efficiencies at positions A3, A6, and A8 of the protospacer in genomic DNA harvested from rd12 mice. Data are shown as individual data points and mean ± SEM for n = 6 mice (both treated groups) or n = 4 mice (untreated). (D) Allele frequency distributions of genomic DNA harvested from treated rd12 mice. Data are shown as mean ± SEM for n = 6 mice. 8e-LV, ABE8e-NG-LV; 8e-eVLP, v4 ABE8e-NG-eVLP. (E) Scotopic a- and b-wave amplitudes measured by ERG following overnight dark adaptation. Data are shown as individual data points and mean ± SEM for n = 8 mice (wild-type), n = 6 mice (ABE8e-NG-LV and v4 ABE8e-NG-eVLP) or n = 4 mice (untreated). (F) Adenine base editing efficiencies at positions A3, A6, and A8 of the protospacer in genomic DNA harvested from rd12 mice. Data are shown as individual data points and mean ± SEM for n = 6 mice (v4 ABE7.10-NG-eVLP) or n = 4 mice (ABE7.10-NG-LV and untreated). p values were calculated using a two-sided t test. (G) Allele frequency distributions of genomic DNA harvested from treated rd12 mice. Data are shown as mean ± SEM for n = 6 mice (v4 ABE7.10-NG-eVLP) or n = 4 mice (ABE7.10-NG-LV and untreated). 7.10-LV, ABE7.10-NG-LV; 7.10-eVLP, v4 ABE7.10-NG-eVLP. (H) Scotopic a- and b-wave amplitudes measured by ERG following overnight dark adaptation. Data are shown as individual data points and mean ± SEM for n = 8 mice (wild-type), n = 7 mice (v4 ABE7.10-NG-eVLP), n = 5 mice (ABE7.10-NG-LV), or n = 4 mice (untreated). p values were calculated using a two-sided t test. (I) Western blot of protein extracts from RPE tissues of wild-type, untreated, v4 ABE7.10-NG-eVLP-treated, and ABE7.10-NG-LV-treated mice. (J) Representative ERG waveforms from wild-type, untreated, ABE7.10-NG-LV-treated, and v4 ABE7.10-NG-eVLP-treated mice.
Figure S7
Figure S7
Sequencing analysis of RPE cDNA after v4 BE-eVLP or lentivirus treatment, related to Figure 7 (A) v4 BE-eVLP and lentivirus treatment led to 50%–60% of A⋅T-to-G⋅C conversion at the target adenine (A6) of the Rpe65 transcript. Data are shown as individual data points and mean values ± SEM for n = 6 (ABE8e-NG-LV, ABE8e-NG-eVLP, and ABE7.10-NG-eVLP), or n = 4 (ABE7.10-NG-LV and untreated) mice. (B and C) Off-target A-to-G RNA editing by v4 BE-eVLPs and lentiviruses as measured by high-throughput sequencing of the (B) Mcm3ap and (C) Perp transcripts. Data are shown as individual data points and mean values ± SEM for n = 6 (ABE8e-NG-LV, ABE8e-NG-eVLP, and ABE7.10-NG-eVLP), or n = 4 (ABE7.10-NG-LV and untreated) mice.

Comment in

References

    1. Abifadel M., Varret M., Rabès J.P., Allard D., Ouguerram K., Devillers M., Cruaud C., Benjannet S., Wickham L., Erlich D., et al. Mutations in PCSK9 cause autosomal dominant hypercholesterolemia. Nat. Genet. 2003;34:154–156. - PubMed
    1. Akcakaya P., Bobbin M.L., Guo J.A., Malagon-Lopez J., Clement K., Garcia S.P., Fellows M.D., Porritt M.J., Firth M.A., Carreras A., et al. In vivo CRISPR editing with no detectable genome-wide off-target mutations. Nature. 2018;561:416–419. - PMC - PubMed
    1. Alanis-Lobato G., Zohren J., McCarthy A., Fogarty N.M.E., Kubikova N., Hardman E., Greco M., Wells D., Turner J.M.A., Niakan K.K. Frequent loss of heterozygosity in CRISPR-Cas9-edited early human embryos. Proc. Natl. Acad. Sci. USA. 2021;118 e2004832117. - PMC - PubMed
    1. Anzalone A.V., Koblan L.W., Liu D.R. Genome editing with CRISPR-Cas nucleases, base editors, transposases and prime editors. Nat. Biotechnol. 2020;38:824–844. - PubMed
    1. Campbell L.A., Coke L.M., Richie C.T., Fortuno L.V., Park A.Y., Harvey B.K. Gesicle-mediated delivery of CRISPR/Cas9 ribonucleoprotein complex for inactivating the HIV provirus. Mol. Ther. 2019;27:151–163. - PMC - PubMed

Publication types

MeSH terms