. 2022 Jan 20;185(2):283-298.e17.
doi: 10.1016/j.cell.2021.12.024. Epub 2022 Jan 11.

GSDMB is increased in IBD and regulates epithelial restitution/repair independent of pyroptosis

Affiliations

GSDMB is increased in IBD and regulates epithelial restitution/repair independent of pyroptosis

Nitish Rana et al. Cell. .

Erratum in

Abstract

Gasdermins are a family of structurally related proteins originally described for their role in pyroptosis. Gasdermin B (GSDMB) is currently the least studied, and while its association with genetic susceptibility to chronic mucosal inflammatory disorders is well established, little is known about its functional relevance during active disease states. Herein, we report increased GSDMB in inflammatory bowel disease, with single-cell analysis identifying epithelial specificity to inflamed colonocytes/crypt top colonocytes. Surprisingly, mechanistic experiments and transcriptome profiling reveal lack of inherent GSDMB-dependent pyroptosis in activated epithelial cells and organoids but instead point to increased proliferation and migration during in vitro wound closure, which arrests in GSDMB-deficient cells that display hyper-adhesiveness and enhanced formation of vinculin-based focal adhesions dependent on PDGF-A-mediated FAK phosphorylation. Importantly, carriage of disease-associated GSDMB SNPs confers functional defects, disrupting epithelial restitution/repair, which, altogether, establishes GSDMB as a critical factor for restoration of epithelial barrier function and the resolution of inflammation.

Keywords: FAK; GSDMB; GSDMB genetic polymorphisms; Mtx; PDGFA; epithelial organoids; epithelial restitution and repair; focal adhesion kinase; gasdermin B; gasdermins; inflammatory bowel disease; intestinal epithelial cells; methotrexate; platelet-derived growth factor A; resolution of inflammation; single-cell RNA-seq; single-cell profiling.


Conflict of interest statement

Declaration of interests The authors declare no competing interests.

Figures

Figure 1.
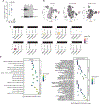
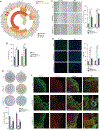
Figure 1.. Increased GSDMB in inflamed lesions of IBD patients vs. healthy controls.
(A) Analysis of 2 different IBD gene array expression datasets (GSE database system) derived from intestinal mucosal biopsies of CD and UC patients, during active disease (act.) and remission (rem.), compared to healthy controls (HC). Data displayed as box plots (25th, 50th, and 75th quantiles shown), with differences expressed as FDR between IBD patients and HC. (B) Relative GSDMB in involved (Inv) and non-involved (NI) gut mucosal biopsies from CD and UC patients, shown as fold-difference vs. healthy controls (Cont., set arbitrarily as 1) (left), and representative Western blot (right) of corresponding full-length (FL) and cleaved GSDMB proteins, with GAPDH used as loading control (n=4). See also Figure S1C. (C) Representative IHC for GSDMB (left), highlighting expression in IEC and single-layer restituting epithelium of IBD patients (arrows), with confocal images (right) co-localizing EpCAM (green) and GSDMB (red) within and at plasma membranes of IECs (arrowheads) (n=4). Scale bar = 100μm. Data presented as mean ± SEM, non-significant (ns) P≥ 0.01; **P<0.01 by paired Student’s t-test and #P<0.05 vs. Cont. by one-way ANOVA with multiple comparisons. All experiments were repeated three times and yielded consistent results.
Figure 2.
Figure 2.. GSDMB is increased and localizes to IECs from IBD patients.
(A) Relative GSDMB in freshly isolated IECs from CD and UC patients shown as fold-difference vs. Cont. (set arbitrarily as 1) (left), and representative Western blot (right) of corresponding GSDMB protein with GAPDH used as loading control (n=4). (B and C) t-SNE plots after scRNA-Seq of colonic IECs depicting expression and distribution of GSDMB mapped to referenced IEC clusters (Figure S1C), with bar plots demonstrating GSDMB in epithelial subpopulations of inflamed/non-inflamed UC patients and healthy control (n=3). (D) Dotplots summarizing selected enriched Gene Ontology biological processes in UC single cell colonocytes (top) and crypt top colonocytes (lower). Dots are colored by number of significantly upregulated genes within each gene set (<1% FDR); dashed lines indicate adjusted P-value threshold of 0.01. Processes are grouped by proliferation- (left) and migration/adhesion- (right) related functions. Data presented as mean ± SEM, ns P≥ 0.01; ****P<0.0001 vs. Cont. by one-way ANOVA with multiple comparisons. DESeq2 R package was used to compute library size factors, normalize data and perform differential expression analysis using negative binomial Wald’s test. For dotplots, Benjamini-Hochberg multiple testing adjustment and FDR cut-off of 0.05 was employed, using all expressed/detected genes as background control. Experiments in (A) were repeated four times and yielded consistent results.
Figure 3.
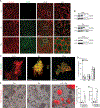
Figure 3.. GSDMB translocates to the plasma membrane after in vitro stimulation with Mtx, but does not induce canonical pyroptosis.
(A) Representative confocal images of HT-29 cells co-localizing E-cadherin (red) and GSDMB (green) to plasma membrane (arrowheads) after methotrexate (Mtx) (middle) or accumulating intracellularly after IFNγ stimulation (lower) (n=3). (B) Representative Western blot showing subcellular fractionation of GSDMB within WCL (whole cell lysate), Cyto (cytoplasmic), M+O (membrane and organelle) and Nuc (nuclear) compartments in HT-29 cells after either Mtx or IFNγ stimulation (n=4). (C) Representative confocal images of 2D monolayers transformed from colonic epithelial organoids co-localizing EpCAM (red) and GSDMB (green) to plasma membrane (yellow, arrowheads) after Mtx (middle) or accumulating intracellularly after IFNγ stimulation (right) (n=3). (D) Supernatants from GSDMB−/− (knockout) vs. WT HT-29 cells +/− Mtx, or IFNγ, analyzed for LDH release (normalized as total % cytotoxicity) (n=3). (E) Representative brightfield and fluorescent images of SYTOX deep red uptake in colonic epithelial organoids after Mtx (middle) or LPS+Ng (nigericin) (positive control) (right) (n=3). (F and G) HEK293T cells transfected with constructs overexpressing either FL or N-terminal fragment (NT) GSDMB, with GSDMD-NT serving as positive control, and analyzed for LDH release and % PI uptake. See also Figure S4D. Scale bar = 20μm. Data presented as mean ± SEM, ns P≥ 0.01; *P<0.05, **P<0.01, ***P<0.001, ****P<0.0001 vs. Cont. (unless otherwise noted) by one-way ANOVA with multiple comparisons. All experiments were repeated three times and yielded consistent results.
Figure 4.
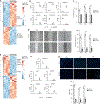
Figure 4.. Epithelial-derived GSDMB regulates cell proliferation and migration.
(A and B) Heatmap of differentially expressed genes related to proliferation from RNA-Seq of GSDMB−/− vs. WT HT-29 cells. Rows are centered for each gene with unit variance scaling applied, gene clustering by correlation distance and average linkage. Comparative expression of top six proliferation-associated genes expressed as FPKM for each replicate. (C and D) GSDMB−/− vs. WT HT-29 cells +/− either Mtx or IFNγ analyzed for proliferation and wound closure (representative scratch assay shown) (n=3). (E and F) Heatmap of differentially expressed genes related to migration from RNA-Seq of GSDMB−/− vs. WT HT-29 cells. Rows are centered for each gene with unit variance scaling applied, gene clustering by correlation distance and average linkage. Comparative expression of top five migration-associated genes expressed as FPKM for each replicate. (G) GSDMB−/− vs. WT HT-29 cells +/− either Mtx or IFNγ analyzed for Boyden chamber migration (stained with DAPI) (n=3). Significance for gene set enrichment analysis was determined using Cuffdiff, with a cutoff of P<0.05 after Benjamini Hochberg correction for multiple testing. Data presented as mean ± SEM, ns P≥ 0.01; **P<0.01, ***P<0.001, ****P<0.0001 vs. Cont. (unless otherwise noted) by Student’s t-test and one-way ANOVA with multiple comparisons. All experiments were repeated three times and yielded consistent results.
Figure 5.
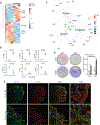
Figure 5.. Lack of GSDMB confers hyper-adhesive phenotype in IECs.
(A and B) Heatmap of differentially expressed genes related to adhesion from RNA-Seq of GSDMB−/− vs. WT HT-29 cells. Rows are centered for each gene with unit variance scaling applied, gene clustering by correlation distance and average linkage. Comparative expression of top six adhesion-associated genes expressed as FPKM for each replicate. (C) Network analysis generated with Enrichplot and ClusterProfiler demonstrating relative relationship among expressed genes with log2(F) > 2 and central nodes of proliferation, migration and adhesion. (D) GSDMB−/− vs. WT HT-29 cells +/− Mtx analyzed for extracellular matrix adhesion (stained with crystal violet) (n=3). (E) Representative confocal images of activated WT and GSDMB−/− cells stained for NM IIA (green) and vinculin (red), highlighting increased formation of vinculin-based focal adhesions (arrows) and actomyosin stress fibers (n=3). Scale bar = 20μm. Significance for gene set enrichment analysis was determined using Cuffdiff, with a cutoff of P<0.05 after Benjamini Hochberg correction for multiple testing. Data presented as mean ± SEM, ns P≥ 0.01; **P<0.01, ***P<0.001, ****P<0.0001 vs. Cont. (unless otherwise noted) by Student’s t-test and one-way ANOVA with multiple comparisons. All experiments were repeated three times and yielded consistent results.
Figure 6.
Figure 6.. IBD-associated GSDMB SNPs (Gly299Arg, Pro306Ser) diminish in vitro IEC wound healing functions.
(A) Circos plot comparing differentially expressed genes by RNA-Seq after rescue of GSDMB−/− HT-29 IECs with either GSDMB WT- or GSDMBΔR299:S306-encoded protein, highlighting molecules related to proliferation, migration and adhesion (FDR adjusted P-value <0.05). (B - E) GSDMB WT vs. GSDMBΔR299:S306 rescued HT-29 IECs were subjected to in vitro functional assays, including proliferation, wound closure (representative scratch assay shown), Boyden chamber migration (stained with DAPI), and extracellular matrix adhesion (stained with crystal violet), with GSDMB−/− IECs transfected with empty vector serving as control (Cont.) (n=3). (F) Representative confocal images of experimental groups stained for NM IIA (green) and vinculin (red), highlighting increased formation of vinculin-based focal adhesions (arrows) and actomyosin stress fibers (n=3). Scale bar = 20μm. Data presented as mean ± SEM, ns P≥ 0.01; *P<0.05, **P<0.01, ***P<0.001, ****P<0.0001 vs. Cont. (unless otherwise noted) by one-way ANOVA with multiple comparisons. All experiments were repeated three times and yielded consistent results.
Figure 7.
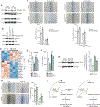
Figure 7.. GSDMB promotes in vitro epithelial wound closure by phosphorylation of FAK via PDGFA.
(A and B) Representative Western blot of lysates from experimental groups probed for phospho, and total FAK, with GAPDH as loading control (n=3). (C) WT HT-29, GSDMB−/−, GSDMB WT, and GSDMBΔR299:S306 rescued cells +/− ZINC40099027, analyzed for in vitro wound closure (representative scratch assay shown) (n=3). (D) Heatmap of differentially expressed genes related to FAK-associated functions from RNA-Seq of GSDMB−/− vs. WT HT-29 cells. Rows are centered for each gene with unit variance scaling applied, gene clustering by correlation distance and average linkage. (E) Comparative expression of PDGFA in experimental groups expressed as FPKM for each replicate. (F) Quantification of PDGF-AA protein in experimental groups (n=3). (G) Representative Western blot of WT HT-29 vs. GSDMB−/− +/− PDGF-AA probed for phospho FAK; GAPDH used as loading control (left), with relative densitometric values (right) (n=3). (H) WT HT-29 vs. GSDMB−/− +/− PDGF-AA analyzed for in vitro wound closure (representative scratch assay shown) (n=3). (I) Schematic representation of mechanism underlying GSDMB-mediated phosphorylation of FAK by PDGF-AA. Significance for gene set enrichment analysis was determined using Cuffdiff, with a cutoff of P<0.05 after Benjamini Hochberg correction for multiple testing. Data presented as mean ± SEM, ns P≥ 0.01; *P<0.05, **P<0.01, ***P<0.001, ****P<0.0001 vs. Cont., #P<0.05, ###P<0.001, ####P<0.0001 vs. GSDMB−/− (unless otherwise noted) by one-way ANOVA with multiple comparisons. All experiments were repeated three times and yielded consistent results.

Comment in

References

    1. Bailey KM, Liu J, 2008. Caveolin-1 Up-regulation during Epithelial to Mesenchymal Transition Is Mediated by Focal Adhesion Kinase. J. Biol. Chem. 283, 13714–13724. 10.1074/jbc.M709329200 - DOI - PMC - PubMed
    1. Bartolomé RA, Barderas R, Torres S, Fernandez-Aceñero MJ, Mendes M, García-Foncillas J, Lopez-Lucendo M, Casal JI, 2014. Cadherin-17 interacts with α2β1 integrin to regulate cell proliferation and adhesion in colorectal cancer cells causing liver metastasis. Oncogene 33, 1658–1669. 10.1038/onc.2013.117 - DOI - PubMed
    1. Bays JL, DeMali KA, 2017. Vinculin in cell–cell and cell–matrix adhesions. Cell. Mol. Life Sci. 74, 2999–3009. 10.1007/s00018-017-2511-3 - DOI - PMC - PubMed
    1. Broz P, Pelegrín P, Shao F, 2020. The gasdermins, a protein family executing cell death and inflammation. Nat. Rev. Immunol. 20, 143–157. 10.1038/s41577-019-0228-2 - DOI - PubMed
    1. Budden KF, Gellatly SL, Wood DLA, Cooper MA, Morrison M, Hugenholtz P, Hansbro PM, 2017. Emerging pathogenic links between microbiota and the gut–lung axis. Nat. Rev. Microbiol. 15, 55–63. 10.1038/nrmicro.2016.142 - DOI - PubMed

Publication types

MeSH terms

Substances