. 2022 Jan 11;38(2):110090.
doi: 10.1016/j.celrep.2021.110090.

Alpha synuclein, the culprit in Parkinson disease, is required for normal immune function

Affiliations

Alpha synuclein, the culprit in Parkinson disease, is required for normal immune function

Md Masud Alam et al. Cell Rep. .

Abstract

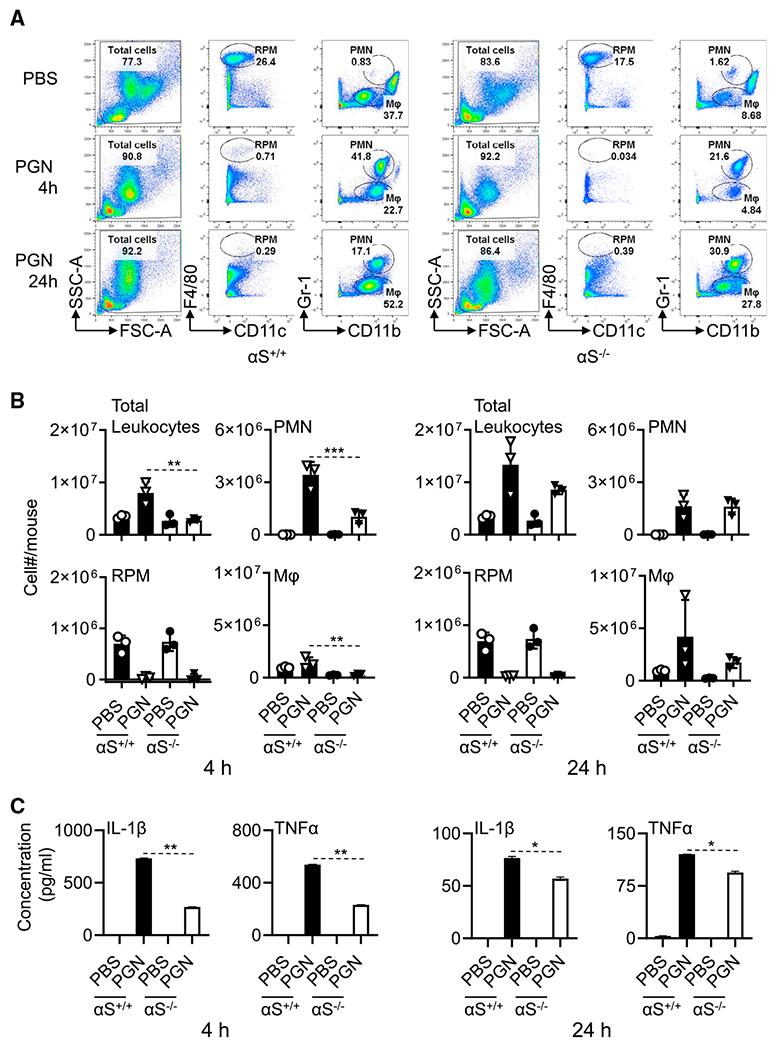
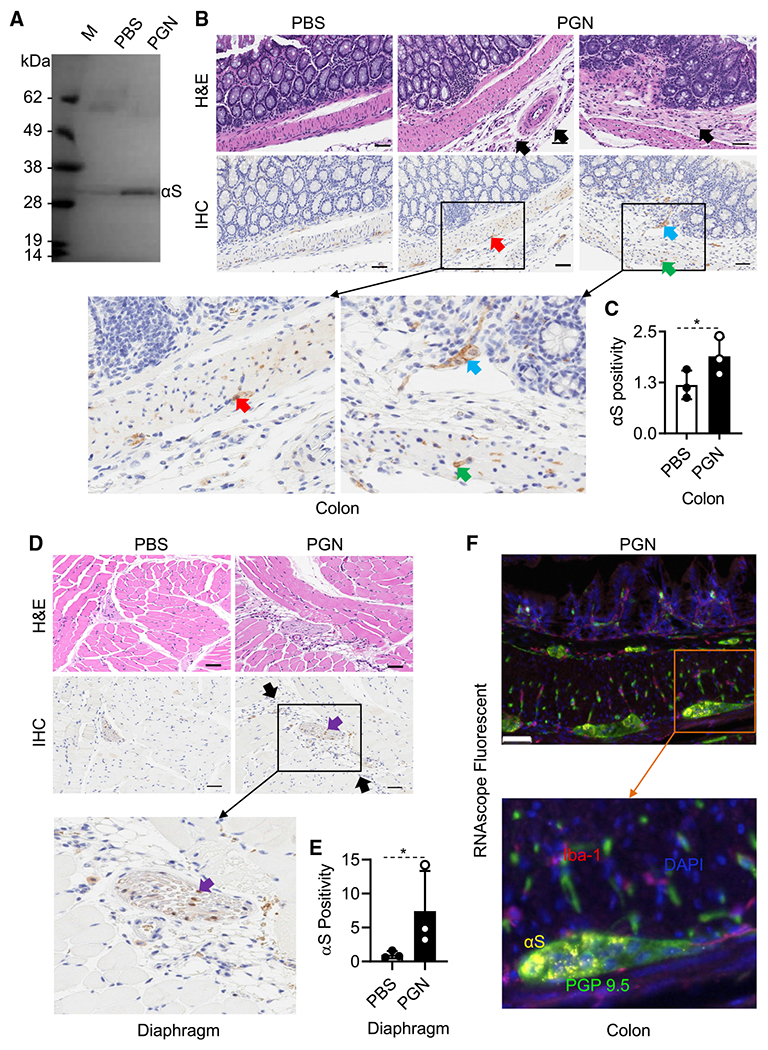
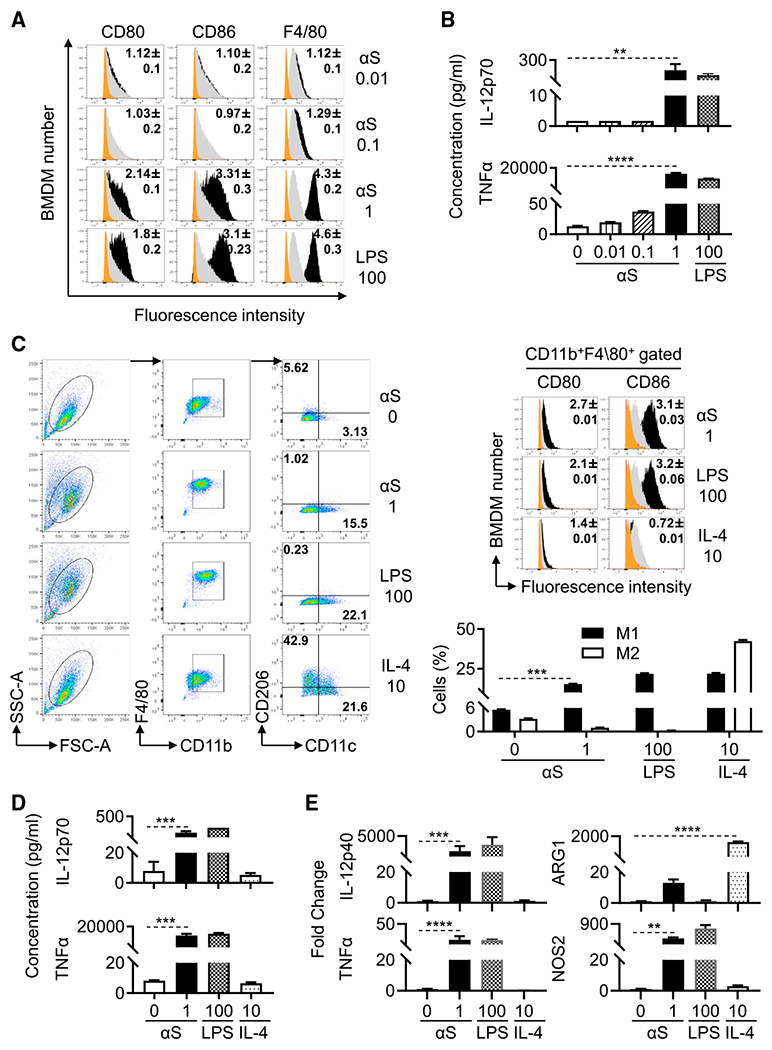
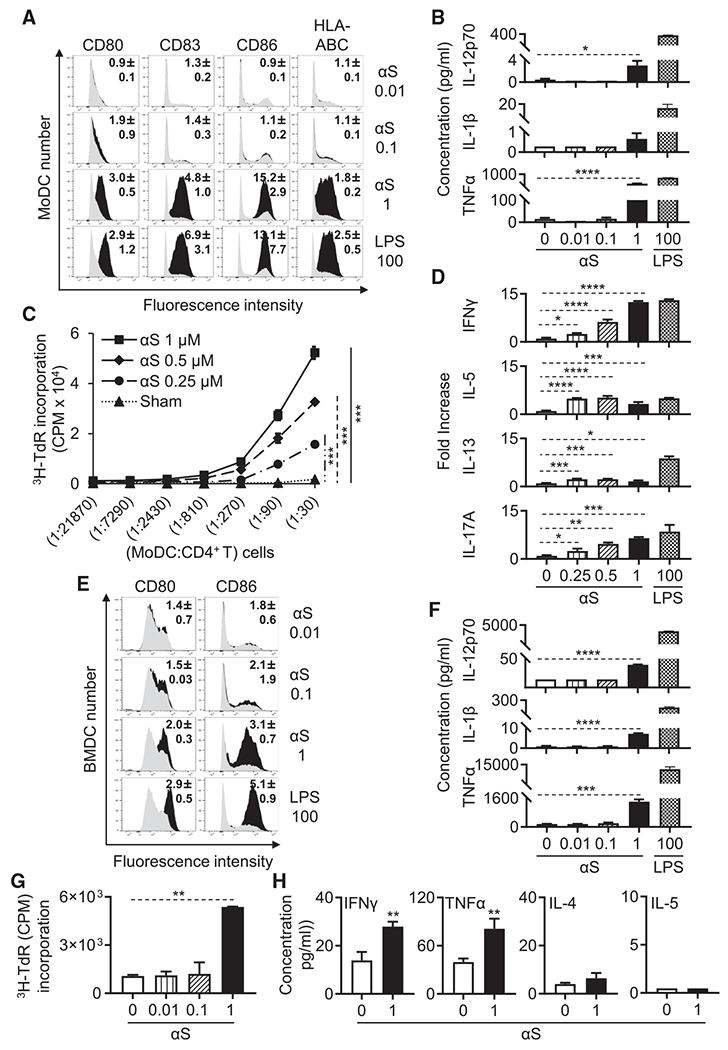
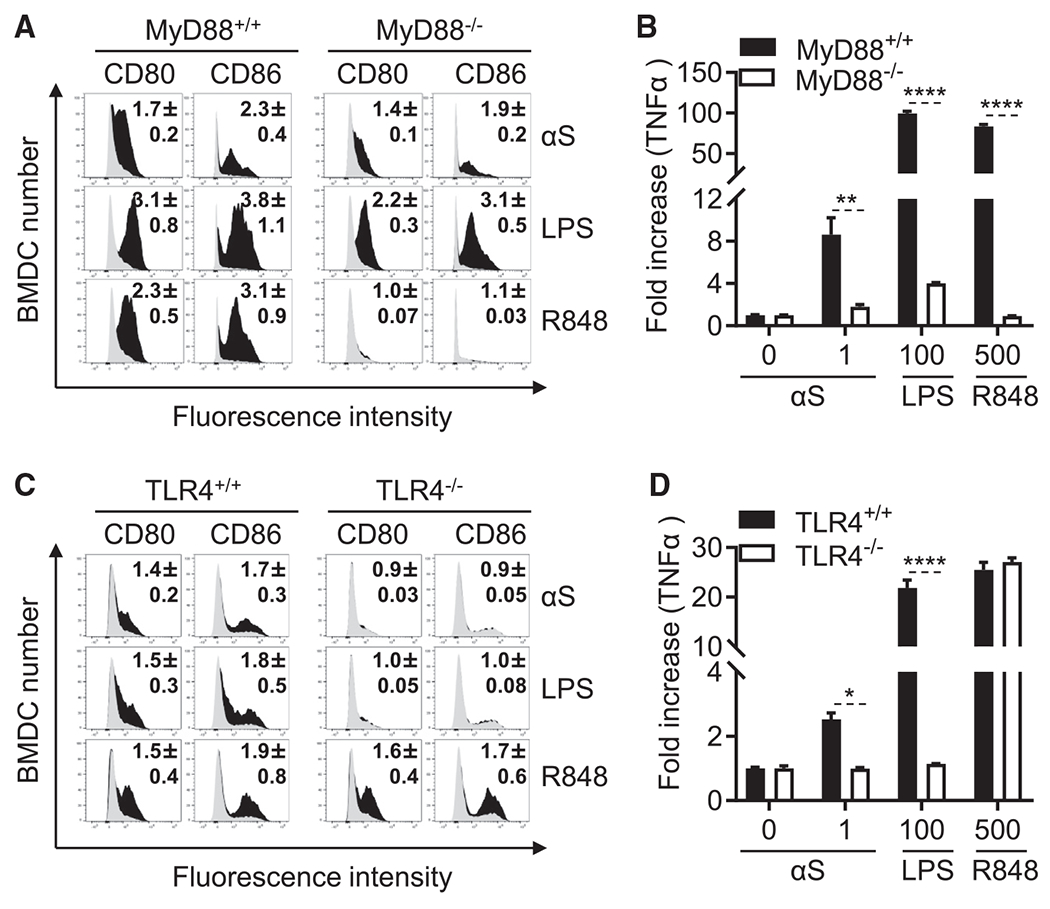
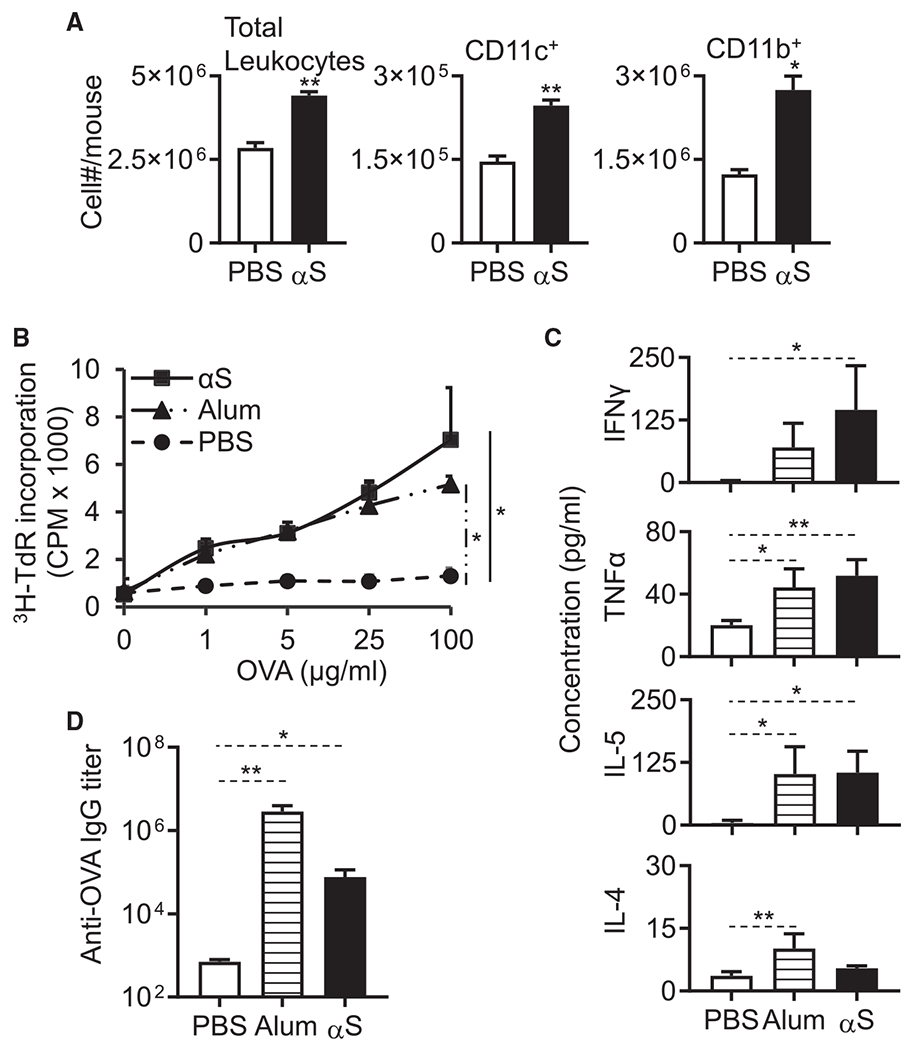
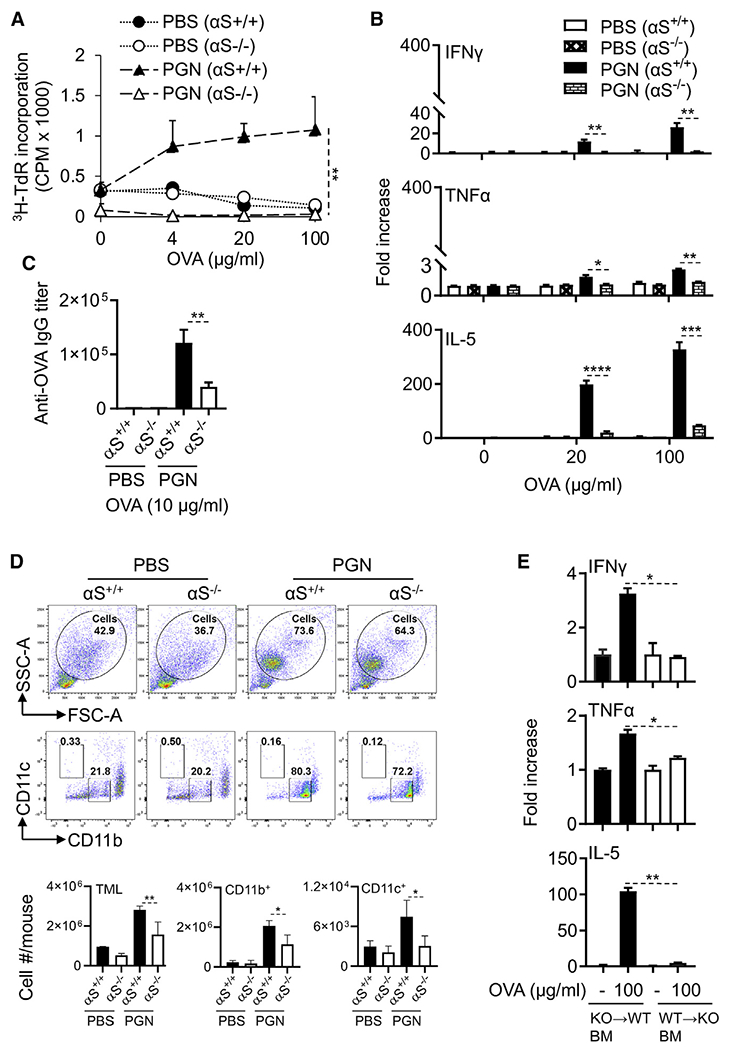
Alpha-synuclein (αS) is causally involved in the development of Parkinson disease (PD); however, its role in normal vertebrate physiology has remained unknown. Recent studies demonstrate that αS is induced by noroviral infection in the enteric nervous system of children and protects mice against lethal neurotropic viral infection. Additionally, αS is a potent chemotactic activator of phagocytes. In this report, using both wild-type and αS knockout mice, we show that αS is a critical mediator of inflammatory and immune responses. αS is required for the development of a normal inflammatory response to bacterial peptidoglycan introduced into the peritoneal cavity as well as antigen-specific and T cell responses following intraperitoneal immunization. Furthermore, we show that neural cells are the sources of αS required for immune competence. Our report supports the hypothesis that αS accumulates within the nervous system of PD individuals because of an inflammatory/immune response.

Keywords: Parkinson disease; alarmins; alpha-synuclein; dendritic cells; immune response; immunization; inflammation; macrophage; peritoneal cavity; αS.


Conflict of interest statement

Declaration of interests The authors declare no competing interests.

Figures

Figure 1.
Figure 1.. αS deletion reduced PGN-induced peritoneal inflammation
6-week old female αS+/+ and αS−/− mice (n = 3) were injected i.p. with PBS or PBS-containing PGN (100 μg/mice) for 4 and 24 h. Leukocytes in the peritoneal lavage were enumerated and immunostained with anti-mouse CD11c, CD11b, F4\80, Gr-1, B220, CD19, and CD14 antibodies. (A) Dot plots of one mouse. (B) The average (mean ± SD) cell number of two experiments. (C) Peritoneal lavage fluid (4 mL/mouse) was concentrated to a final volume 40 μL and used for quantitation of cytokines (n = 3). Shown is the average concentration of cytokines of two experiments. *p < 0.05, **p < 0.01, and ***p < 0.001 using one-way ANOVA followed by Tukey’s post hoc test.
Figure 2.
Figure 2.. αS is produced by neural cells in response to inflammation
Female C57BL/6 mice (8-week-old, n = 3) were i.p. injected with PBS or PBS containing PGN (100 μg/mouse). After 24 h, peritoneal lavage fluid and colonic and diaphragmatic tissues were collected. (A) 1 mL lavage fluid was concentrated to a final volume of 10 μl, separated on an SDS-PAGE gel, and western-blotted with anti-αS antibody. Shown are the results of one experiment representative of two. (B) H&E and IHC of the colon. (C and E) The expression level of αS in colon and diaphragm tissues (mean ± SD, n = 3) was scanned. αS positivity was calculated using the formula: αS positivity = (total pixels – negative pixels)/total pixels. Shown is the result of one experiment. Black-and-white bar: 50 μm; black arrows, infiltrating leukocytes; red arrows, Myenteric plexus; blue arrow, Meissner’s plexus; purple arrows: nerve fibers; green arrows, axons. Epithelial cells are negative. *p < 0.05 by t test (C and E). (D) H&E and IHC of the diaphragm. (F) Representative RNAscope ISH and IHC colon image of mice with PGN-induced peritonitis generated using a specific probe to detect αS (Cy3: yellow) with counter staining for nuclei (DAPI: blue) and immunostaining for macrophages (Iba-1, OPAL690: red) and neuronal marker (PGP 9.5, OPAL520: green). See also Figures S1 and S2.
Figure 3.
Figure 3.. αS polarizes mouse BMDM into M1 type macrophages
Mouse BMDMs were treated without (sham) or with αS (μM), LPS (ng/mL), or IL-4 (ng/mL) for 24 h to assess their activation and polarization. (A) Overlay histogram of treated BMDM (orange area = isotype control; gray area = sham-treated; the number inside the histograms is the average [mean ± SD] fold increase in terms of geometric fluorescent intensity of five experiments). (B) Cytokine levels (production) in the culture supernatant of treated BMDM (the average [mean ± SD] of five experiments). (C) Relative expression of indicated surface markers and percentage of M1 and M2 polarization of treated BMDM.M1 polarized macrophages characteristically are CD11b+F4/80+CD11c+ CD206 cells, whereas M2 macrophages are CD11b+F4/80+CD11cCD206+ cells. (D) IL-12 and TNFα production in the supernatant of treated BMDM. (E) Fold increase of IL-12p40, TNFα, NOS2, and ARG1 of treated BMDM. Shown are the plots of one experiment and the average fold increase in the expression of CD80 and CD86 (mean ± SD) or percentage of M1 and M2 types of macrophages or the fold change of cytokines and in genes products representative of three experiments. *p < 0.05, **p < 0.01, ***p < 0.001, and ****p < 0.0001 between sham- and αS-treated group using one-way ANOVA followed by Tukey’s post hoc test.
Figure 4.
Figure 4.. αS induces phenotypic and functional maturation of human and mouse DCs
(A and B) Human MoDCs treated without or with αS (μM) or LPS (ng/mL) for 24 h were immunostained for measurement by flow cytometry of their expression of indicated surface markers (gray area = sham-treated; number inside the histograms is the average [mean ± SD] fold increase in terms of geometric fluorescent intensity of three experiments) or the cytokine levels (the average [mean ± SD] of three experiments) present in the supernatants. (C) αS-treated human MoDCs were co-cultured with allogenic CD4+ T cells at indicated ratios for 4 days and pulsed with [3H]-TdR for the last 12 h. CD4+ T cell proliferation was measured by [3H]-TdR incorporation. (D) Supernatants from human CD4+ T cells cocultured with LPS (ng/mL) or αS μM)-treated MoDCs (CD4+ T:MoDCs = 50:1) for 3 days were quantitated for cytokine production (the average [mean ± SD] of three separate experiments is shown). (E and F) Mouse BMDCs treated without or with αS (μM) or LPS (ng/mL) for 24 h were assessed for DC expression of indicated surface markers (gray area, sham-treated), and their cytokine production was determined as in (A) and (B). (G) OVA-loaded and αS (μM)-treated mouse BMDCs were co-cultured with naive syngeneic OT-II lymphocytes at a BMDCs:OT-II T cells ratio of 1:10 for 4 days and pulsed with [3H]-TdR (1 μCi/well) for the last 18 h. The OT-II T cell proliferation was measured by [3H]-TdR incorporation. (H) Supernatants of OT-II T cells co-cultured with OVA-loaded BMDCs that were treated without or with αS (μM) for 2 days were assessed for the indicated cytokines (the average [mean ± SD] of three experiments). *p < 0.05, **p < 0.01, ***p < 0.001, and ****p < 0.0001 between sham- and αS-treated group using t test (H), using repeated-measures of ANOVA (C), or one-way ANOVA followed by Tukey’s post hoc test (B, D, F, and G). See also Figure S3.
Figure 5.
Figure 5.. Effect of deletion of MyD88 and TLR4 on response of mouse APCs to αS
(A and C) Mouse BMDCs from MyD88+/+, MyD88−/−, TLR4+/+, and TLR4−/− mice were treated without or with recombinant αS (μM), LPS (ng/mL), or R848 (ng/mL) for 24 h before they were immuno-stained and analyzed by flow cytometry for expression of the indicated surface molecules (gray area = sham-treated; number inside the histograms is the average [mean ± SD] fold increase in terms of relative fluorescent intensity of three experiments). (B and D) Cytokine levels in the culture supernatants of (A) and (C) were quantitated and shown as mean ± SD. One representative experiment of three is shown. *p < 0.05, **p < 0.01, and ****p < 0.0001 by t test. See also Figures S4–S8.
Figure 6.
Figure 6.. αS induces DC recruitment and promotes OVA-specific T cell and antibody responses
(A) 9-week old female C57BL/6 mice (n = 3) were injected i.p. with PBS or PBS containing monomeric αS (1 nmoles/mouse). After 4 h, leukocytes in the peritoneal cavity were enumerated and graphed as the average (mean ± SD) of two experiments. The indicated sub-populations of APCs (CD11c+ and CD11b+) were determined by flow cytometry. 7-week-old female C57BL/6 mice (n = 3) were immunized i.p. with OVA (100 μg/mouse), OVA (100 μg/mouse) + alum (3 mg/mouse), or OVA (100 μg/mouse) + αS (1 nmoles/mouse) on day 1 and boosted with OVA (100 μg/mouse) on day 14. On day 21, the spleens and sera of immunized mice were harvested for analysis. (B) Splenocytes were cultured in the presence of specified concentrations of OVA for 4 days. The culture was pulsed with [3H]-TdR for the last 18 h before harvest for measurement of [3H]-TdR incorporation. (C) Splenocytes were cultured in duplicate in the presence of 100 μg/mL OVA for 3 days, and cytokine levels in the supernatants were quantitated in triplicates. The average (mean ± SD) of two experiments is shown. (D) Serum IgG specific for OVA was quantitated by anti-OVA ELISA and shown as the average (mean ± SD) of two experiments. *p < 0.05 and **p < 0.01 between sham (PBS)- and αS-treated group using one-way ANOVA followed by Tukey’s post hoc test (A, C, and D) or repeated-measures of ANOVA (B). See also Figure S9.
Figure 7.
Figure 7.. Endogenous αS is essential for the development of OVA-specific immune responses and APC recruitment
7-week old female αS−/− and littermate-matched αS+/+ mice (n = 3) were immunized i.p. with OVA (100 μg/mouse) in the presence or absence of PGN (100 μg/mouse) on day 1 and boosted with OVA on day 14. On day 21, the spleens and sera of immunized mice were harvested for measurement of OVA-specific immune responses. (A) Splenocytes were cultured in triplicate in the presence of specified concentrations of OVA for 4 days and pulsed with [3H]-TdR for the last 12 h before harvest for the measurement of [3H]-TdR incorporation. Shown is the average counts per minute (CPM, mean ± SD) of each group. The result of one experiment out of two is shown. (B) Splenocytes from αS−/− and αS+/+ were cultured in duplicate in the presence indicated concentration of OVA for 2 days, and cytokine levels in the supernatants were quantitated. Shown is the average (mean ± SD) of two experiments. (C) Sera were measured for OVA-specific IgG by anti-OVA ELISA, and the average (mean ± SD) of two experiments is shown. (D) αS+/+ and αS−/− male mice (n = 3) were injected i.p. with OVA (100 μg/mouse) with or without PGN (100 μg/mouse). Four hours later, peritoneal lavage was collected to determine the TML (total number of peritoneal myeloid leukocytes as a percentage of total cells) and the CD11b+ or CD11c+ DCs of TML by flow cytometry. Shown is the average (mean ± SD) of two experiments. (E) Bone-marrow chimeric mice were generated by reconstituting lethally irradiated αS+/+ mice with littermate matched αS−/− bone-marrow mononuclear cells (KO→WT) or vice versa (WT→KO). After 7 weeks, the chimeric αS+/+ and αS−/− mice were immunized with PGN (100 μg/mouse) containing OVA (100 μg/mouse) on day 1 and boosted with OVA (100 μg/mouse) on day 14. On day 21, splenocytes from bone marrow of chimeric mice were cultured in the presence or absence of indicated concentration of OVA for 2 days in vitro, and the cytokines levels in the culture supernatants were measured and shown as the average (mean ± SD) of two experiments. *p < 0.05 and **p < 0.01 using repeated-measure of ANOVA (A) or one-way ANOVA followed by Tukey’s post hoc test (B–E). See also Figures S10–S12.

References

    1. Akira S, and Takeda K (2004). Toll-like receptor signalling. Nat. Rev. Immunol 4, 499–511. - PubMed
    1. Alam MM, Yang D, Trivett A, Meyer TJ, and Oppenheim JJ (2018). HMGN1 and R848 Synergistically Activate Dendritic Cells Using Multiple Signaling Pathways. Front. Immunol 9, 2982. - PMC - PubMed
    1. Barbour R, Kling K, Anderson JP, Banducci K, Cole T, Diep L, Fox M, Goldstein JM, Soriano F, Seubert P, and Chilcote TJ (2008). Red blood cells are the major source of alpha-synuclein in blood. Neurodegener. Dis 5, 55–59. - PubMed
    1. Barbut D, Stolzenberg E, and Zasloff M (2019). Gastrointestinal Immunity and Alpha-Synuclein. J. Parkinsons Dis 9 (s2), S313–S322. - PMC - PubMed
    1. Bartels T, Choi JG, and Selkoe DJ (2011). α-Synuclein occurs physiologically as a helically folded tetramer that resists aggregation. Nature 477, 107–110. - PMC - PubMed

Publication types

LinkOut - more resources