. 2022 Jan 11;38(2):110216.
doi: 10.1016/j.celrep.2021.110216.

ATRX loss in glioma results in dysregulation of cell-cycle phase transition and ATM inhibitor radio-sensitization

Affiliations

ATRX loss in glioma results in dysregulation of cell-cycle phase transition and ATM inhibitor radio-sensitization

Tingting Qin et al. Cell Rep. .

Abstract

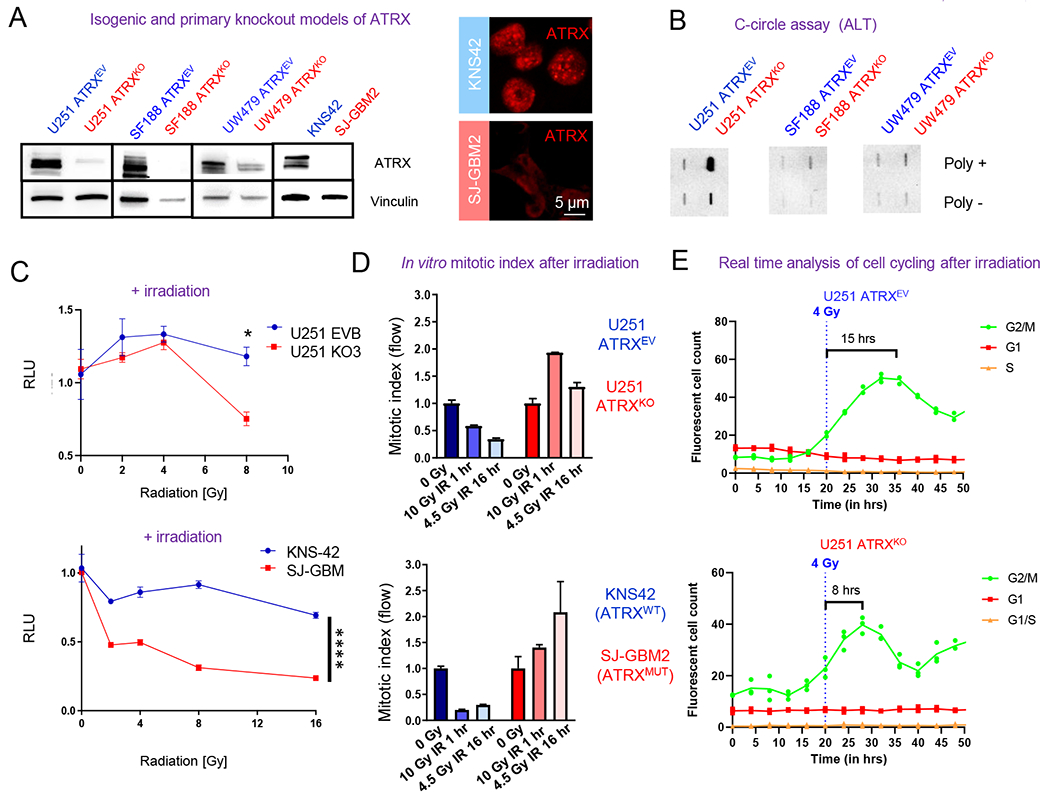
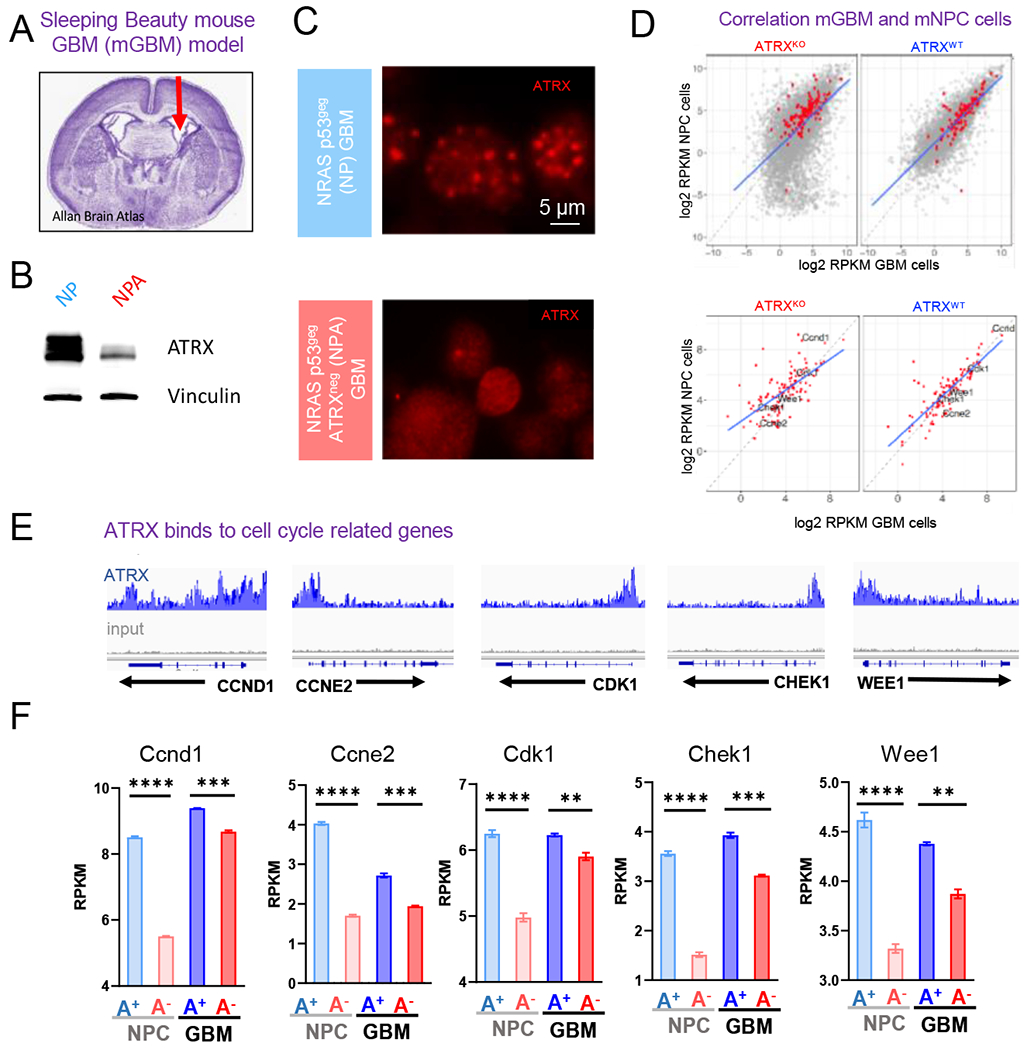
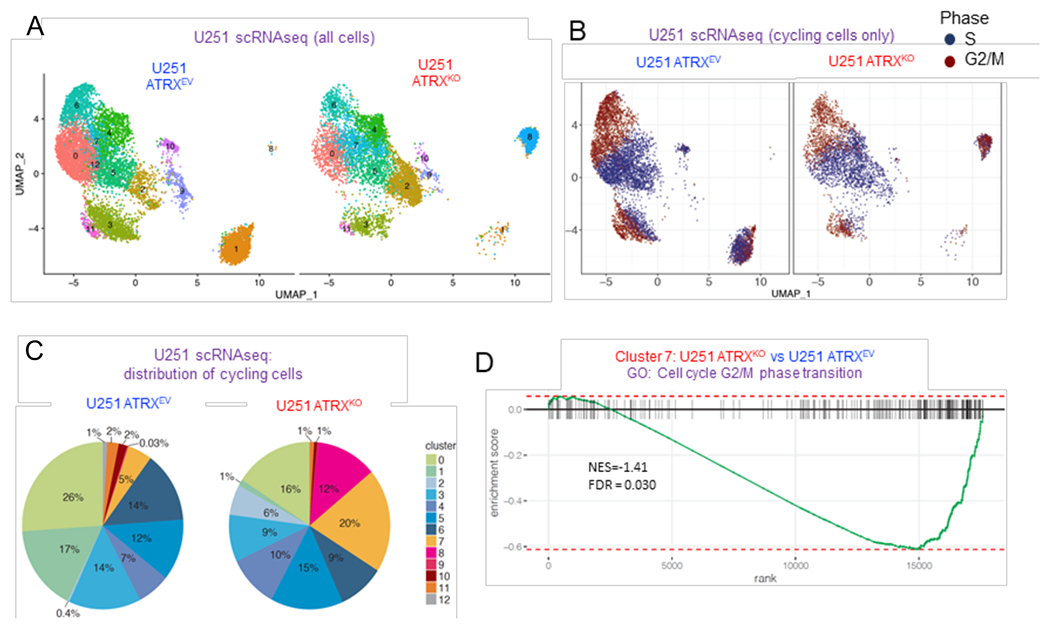
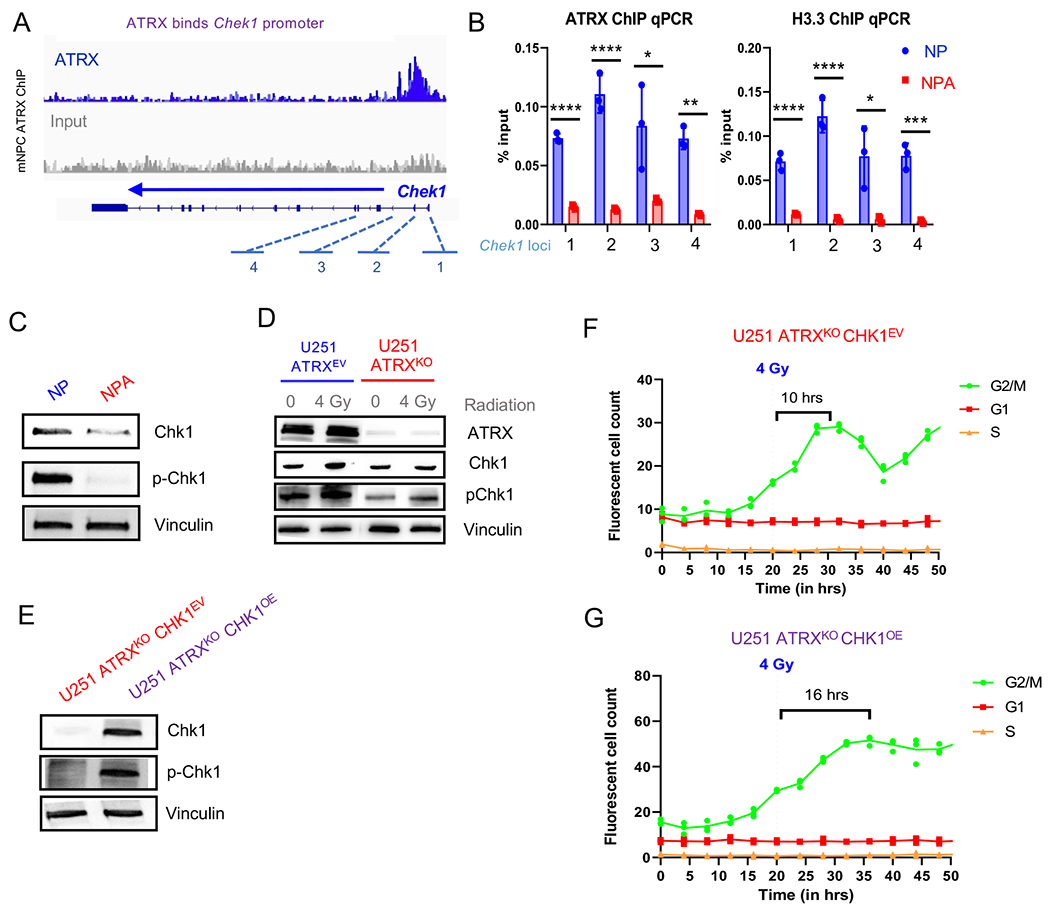
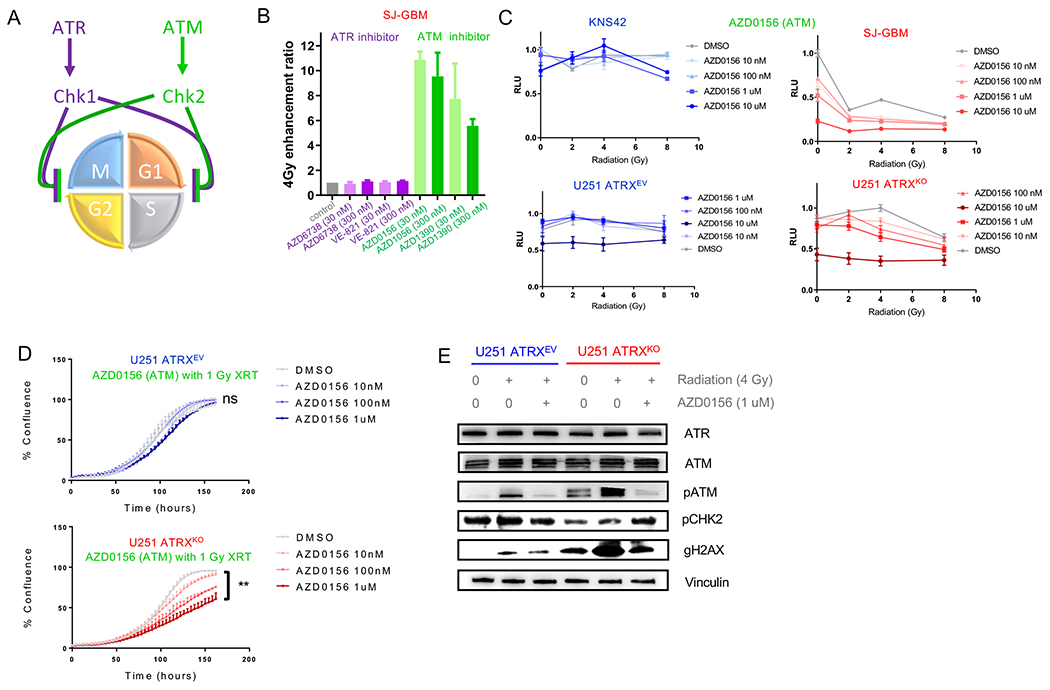
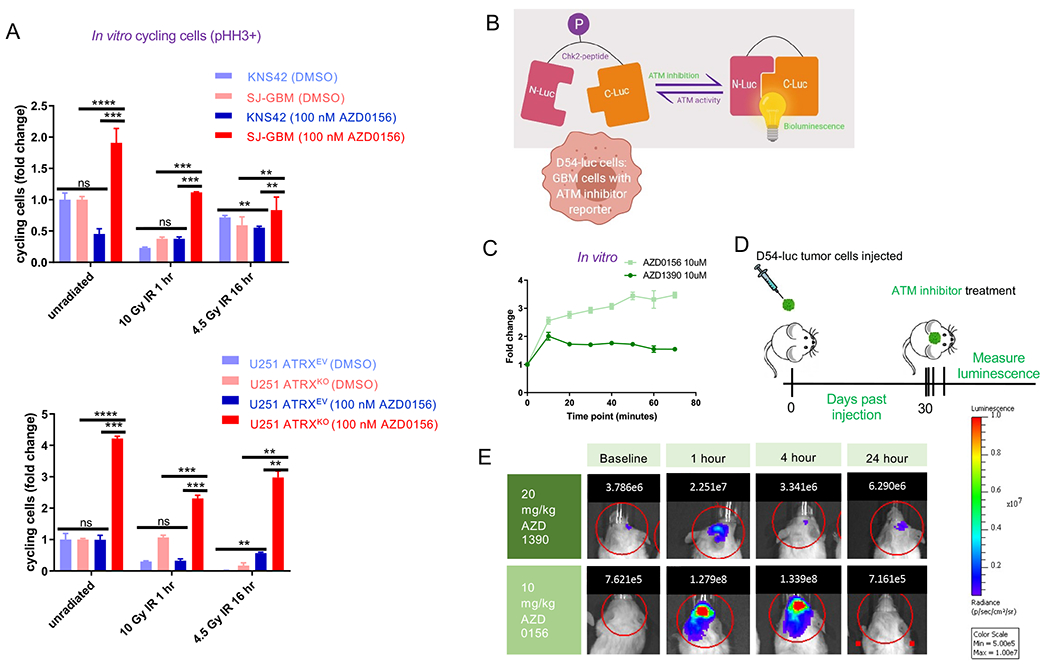
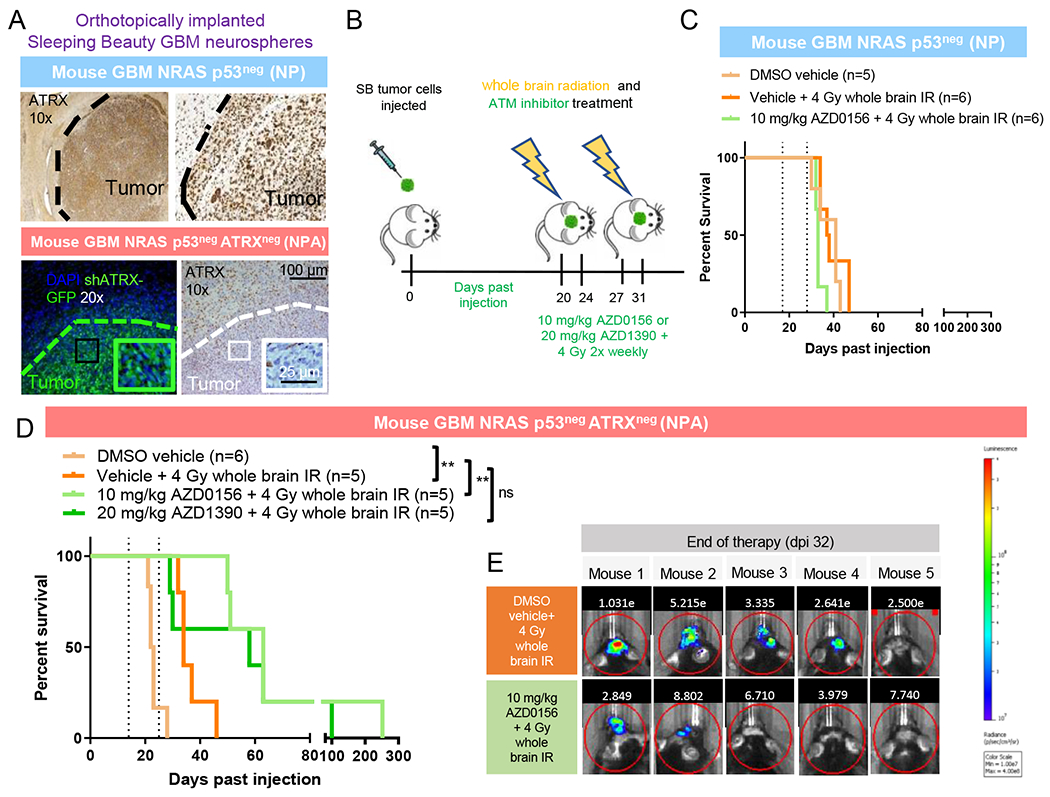
ATRX, a chromatin remodeler protein, is recurrently mutated in H3F3A-mutant pediatric glioblastoma (GBM) and isocitrate dehydrogenase (IDH)-mutant grade 2/3 adult glioma. Previous work has shown that ATRX-deficient GBM cells show enhanced sensitivity to irradiation, but the etiology remains unclear. We find that ATRX binds the regulatory elements of cell-cycle phase transition genes in GBM cells, and there is a marked reduction in Checkpoint Kinase 1 (CHEK1) expression with ATRX loss, leading to the early release of G2/M entry after irradiation. ATRX-deficient cells exhibit enhanced activation of master cell-cycle regulator ATM with irradiation. Addition of the ATM inhibitor AZD0156 doubles median survival in mice intracranially implanted with ATRX-deficient GBM cells, which is not seen in ATRX-wild-type controls. This study demonstrates that ATRX-deficient high-grade gliomas (HGGs) display Chk1-mediated dysregulation of cell-cycle phase transitions, which opens a window for therapies targeting this phenotype.

Keywords: ATM inhibitor; ATRX; CHEK1; cell-cycle; epigenetics; glioma.


Conflict of interest statement

Declaration of interests The authors declare no competing interests.

Figures

Figure 1.
Figure 1.. ATRX-deficient human glioma cells demonstrate inappropriate cell cycling after treatment with irradiation.
(A) Western blot of U251, SF188 and UW479 isogenic ARTXKO cells illustrating ATRX reduction. Immunoblots of KNS42 and SJ-GBM2 are also included (right two columns) illustrating ATRX reduction in ATRX-mutant SJ-GBM2 cells and immunocytochemistry images (right image) demonstrating their punctate nuclear staining of ATRX only in ATRX-wildtype KNS42 cells. (B) C-circle assay results demonstrating DNA from each sample in the presence (+) or absence (−) of Φ29 polymerase; positive staining demonstrates ALT in U251-ATRXKO cells only. (C) In vitro data showing proliferation of U251 ATRXKO cells and its isogenic control, as well as KNS42 (ATRX wildtype) and SJ-GBM2 (ATRX mutant), after exposure to increasing doses of irradiation (IR). (D) In vitro mitotic index assay at 1 hour after 10 Gy IR and 16 hours after 4.5 Gy IR demonstrates that U251 (ATRXKO) and SJ-GBM2 (ATRX mutant) cells display increased proliferation following treatment with IR. All values normalized to respective 0 Gy value. 0 Gy is normalized to 1.0. (E) Real-time analysis of cell cycle transitions using the Incucyte imaging system and the FastFUCCI reporter plasmid shows the U251 ATRXKO cells return to active cycling 2X faster after 4 Gy IR. [Mean ± SEM for triplicate experiments are shown. *P≤0.05, **P≤ 0.01, ***P≤0.001, and ****P≤0.0001 using 2-Way ANOVA.] For additional data, see also Figure S1.
Figure 2.
Figure 2.. ATRX preferentially binds to genes involved in cell cycle processes in mNPCs and mGBMs
(A) Mouse GBM neurospheres (“NP” and “NPA”) are generated from tumors harvested from mice who underwent neonatal implantation of plasmids injected in the lateral ventricle, denoted by the arrow in the H&E stained section of a mouse brain. (B-C) Western blot (B) and Immunocytochemistry (C) analysis of NP and NPA mGBM neurospheres illustrating the loss of ATRX. (D) Correlation of average gene expression (log2 RPKM) between mGBM cells and mNPC cells (TP53−/− ATRXpos and TP53−/− ATRXneg) stratified by ATRX status (ATRXKO vs. ATRXWT). Top: the correlation of genome-wide genes with KEGG cell cycle genes denoted in red; bottom: the correlation of KEGG Cell cycle genes. (E) ATRX ChIP-seq tracks (n=3) in mNPC cells demonstrate ATRX promoter binding (gray track is input). (F) Expression levels (RPKM) of select cell cycle regulatory genes (Ccnd1, Ccne2, Cdk1, Chek1 and Wee1) with isogenic loss of ATRX in mNPC and mGBM cells. [Mean ± SEM for triplicate experiments are shown. *P≤0.05, ****p≤0 0001 using Welch’s t-test.] For additional data, see also Figure S2 and Tables S1–4, 7)
Figure 3.
Figure 3.. ATRX-deficient human glioma cells display changes in cell-cycle associated gene expression and an increase in S and G2/M cycling phase.
(A) UMAP visualization of cell clusters in U251-ARTXKO and U251-ARTXEV cells (number of PCs = 24). (B) UMAP visualization of cycling cells annotated by S (dark blue) or G2M (dark red) cycling phase. (C) Distribution of cycling cell proportion within each cluster in U251-ARTXKO and U251-ARTXEV cells respectively. (D) GSEA enrichment plot of GO term cell cycle G2/M phase transition that was significantly down-regulated in cluster 7 with the loss of ATRX. For additional data, see also Figure S3 and Tables S5–6.
Figure 4.
Figure 4.. Loss of ATRX in murine neuronal precursor cells (mNPC) and murine GBM cells (mGBM) results in down-regulation of Chk1.
(A) ATRX promotor binding at Chek1 loci in mNPC cells (ChIP-seq, n=3 from Danussi et al., 2018). (B) mGBM cells with ATRXKO (“NPA”) show reduced ATRX and H3.3 binding at Chek1 gene loci (“1” through “4” from A) compared to mGBM cell controls without ATRXKO (“NP”), n=3. (C) Chek1 expression is downregulated in mNPC cells with ATRX loss. (D) Western blot of U251 ATRXEV and U251 ATRXKO cells with and without 4 Gy IR. ATR pathway proteins are marked in purple. (E) Western blot of U251 ATRXKO cells with isogenic Chk1 overexpression or empty vector (n=3 replicates for C and D). (F-G) Incucyte live cell imaging analysis of U251 ATRXKOChk1OE cells incorporated with the FastFUCCI reporter plasmid show a gradual return (more than 1.5X slower) to cycling after 4 Gy IR. (Mean ± SEM for triplicate experiments are shown. *P≤ 0.05, **P≤ 0.01, and ***P≤0.001 using Welch’s t-test). For additional data, see also Figure S4.
Figure 5.
Figure 5.. ATRX-deficient human glioma cells demonstrate selective radio-sensitization with ATM inhibition
(A) Illustration of mechanism by which ATR and ATM proteins enforce cell cycle checkpoints. (B) Enhancement ratio after 4 Gy IR (clonogenic assay) performed on SJGBM2 cells against ATR (purple) and ATM (green) inhibitors. (C) In vitro proliferation assay plot of various radiation doses of ATM inhibitor AZD0156 for KNS42 and SJGBM2 (above) and ATRX isogenic U251 cells (below). (D) Plot of tumor cell confluence over time for U251 isogenic ATRXKO cell cultures treated with increasing concentrations of AZD0156 at 1 Gy XRT. (E) Immunoblots for ATR (purple) and ATM pathway (green) at baseline, by IR with DMSO and IR with 1 uM AZD0156 in U251 isogenic ATRXKO cells. [Mean ± SEM for triplicate experiments are shown. **p≤ 0.01 using Welch’s t-test] For additional data, see also Figures S5 and S6.
Figure 6.
Figure 6.. ATM inhibition results in selective increase in cell cycling in ATRX-deficient glioma cells and ATM-specific inhibition in vitro and in vivo
(A) Flow cytometric cell cycle analysis [y-axis represents fold change in cycling cells, or percentage phospho-histone H3 (“pHH3”) positive] demonstrating selective increase in cycling cells with ATM inhibitor treatment in ATRX-deficient cells only. (B) Schematic of ATM inhibition reporter assay. (C) Graph depicting bioluminescence change compared to baseline after treatment with ATM inhibitor in D54 cells expressing ATM-Luciferase inhibition reporter in vitro (higher value represents more inhibition). Line represents mean ± SEM for triplicate experiments. (D) Schematic of in vivo D54-ATMR assay to assess in vivo intra-cranial on target changes with ATM inhibition. (E) Representative mice showing bioluminescence (photons) at various time points before and after treatment with ATM inhibitors. [Mean ± SEM for triplicate experiments are shown. *P≤0.05, **P≤ 0.01, ***P≤0.001, ****P≤0.0001 using Welch’s t-test.] For additional data, see also Figure S7.
Figure 7.
Figure 7.. Treatment of implanted ATRX-deficient mouse GBM cells with ATM inhibitors
(A) Immunofluorescence and IHC staining of tumors of mice implanted with mouse GBM neurospheres with (NPA) and without (NP) ATRX knockdown (GFP stains for shATRX plasmid). Tumor shows robust ATRX loss which is not seen in surrounding normal cortex. Boundary between tumor and non-tumor tissue is denoted by dotted line. (B) Schematic of treatment with whole brain IR and ATM inhibitor for mice implanted with tumor cells. (C) Kaplan-Meier survival curves of C57BL/6 mice bearing SB implanted NP tumors with no response to irradiation +/− ATM inhibition. (D) Kaplan-Meier survival curves of C57BL/6 mice bearing SB implanted NPA tumors show significant radio-sensitization with AZD0156. **P≤ 0.01 using Log-rank (Mantel-Cox) test. (E) Tumor bioluminescence for tumor-bearing NPA mice treated with 4 Gy whole brain irradiation with and without AZD0156. For additional data, see also Figure S7.

References

    1. Anders S, Pyl PT, and Huber W (2015). HTSeq--a Python framework to work with high-throughput sequencing data. Bioinformatics 31, 166–169. 10.1093/bioinformatics/btu638. - DOI - PMC - PubMed
    1. Andersson R, Gebhard C, Miguel-Escalada I, Hoof I, Bornholdt J, Boyd M, Chen Y, Zhao X, Andrews S (2010). FastQC: a quality control tool for high throughput sequence data. Version 0.11. 2 Website: http://www.bioinformatics.babraham.ac.uk/projects/fastqc.
    1. Schmidl C, Suzuki T, et al. (2014). An atlas of active enhancers across human cell types and tissues. Nature 507, 455–461. 10.1038/nature12787. - DOI - PMC - PubMed
    1. Bender S, Tang Y, Lindroth AM, Hovestadt V, Jones DT, Kool M, Zapatka M, Northcott PA, Sturm D, Wang W, et al. (2013). Reduced H3K27me3 and DNA hypomethylation are major drivers of gene expression in K27M mutant pediatric high-grade gliomas. Cancer Cell 24, 660–672. 10.1016/j.ccr.2013.10.006. - DOI - PubMed
    1. Berube NG, Mangelsdorf M, Jagla M, Vanderluit J, Garrick D, Gibbons RJ, Higgs DR, Slack RS, and Picketts DJ (2005). The chromatin-remodeling protein ATRX is critical for neuronal survival during corticogenesis. J Clin Invest 115, 258–267. 10.1172/JCI22329. - DOI - PMC - PubMed

Publication types

MeSH terms