. 2022 May:112:108122.
doi: 10.1016/j.jmgm.2022.108122. Epub 2022 Jan 5.

Molecular dynamics simulations of the flexibility and inhibition of SARS-CoV-2 NSP 13 helicase

Affiliations

Molecular dynamics simulations of the flexibility and inhibition of SARS-CoV-2 NSP 13 helicase

Bryan A Raubenolt et al. J Mol Graph Model. 2022 May.

Abstract

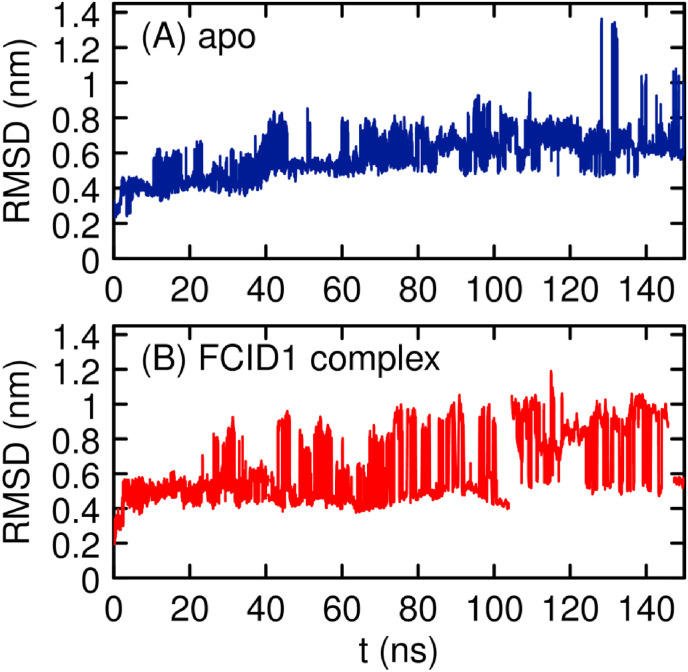
The helicase protein of the Severe Acute Respiratory Syndrome Coronavirus 2 (SARS-CoV-2) is both a good potential drug target and very flexible. The flexibility, and therefore its function, could be reduced through knowledge of these motions and identification of allosteric pockets. Using molecular dynamics simulations with enhanced sampling, we determined key modes of motion and sites on the protein that are at the interface between flexible domains of the proteins. We developed an approach to map the principal components of motion onto the surface of a potential binding pocket to help in the identification of allosteric sites.


Conflict of interest statement

The authors declare that they have no known competing financial interests or personal relationships that could have appeared to influence the work reported in this paper.

Figures

Image 1
Graphical abstract
Fig. 1
Fig. 1
SWISS-MODEL structure of SARS-CoV-2 helicase, showing domain 1A in green, domain 1B in blue, domain 2A in orange, the stalk domain in grey, the ZBD in red, and a potential inhibitor in grey near the bottom. (For interpretation of the references to colour in this figure legend, the reader is referred to the Web version of this article.)
Fig. 2
Fig. 2
Docked pose of FC1D1 in the ATP site, showing the major interactions with the protein side chains. The IUPAC name of FCID1 is (2R)-3-[(4-chloro-1H-pyrrol-2-yl)formamido]methyl-1-methyl-2-(pyridin-3-yl)pyrrolidin-1-ium.
Fig. 3
Fig. 3
Cα RMSD for the apo protein (A) and the protein/FCID1 complex as a function of time at 310 K.
Fig. 4
Fig. 4
Distance between the domains as a function of time (A,C,D) and the distributions of the distances from the last 100 ns (B,D,F). The blue lines are for the apo protein and the red lines are for the complex. (For interpretation of the references to colour in this figure legend, the reader is referred to the Web version of this article.)
Fig. 5
Fig. 5
Root mean square fluctuations of Ca atoms for the apo protein (blue line) and complex (red line). (For interpretation of the references to colour in this figure legend, the reader is referred to the Web version of this article.)
Fig. 6
Fig. 6
Structures of selected clusters from the apo and cluster simulations, with domain 1A in green, domain 1B in blue, domain 2A in orange, the stalk domain in grey, and the ZBD in red. (For interpretation of the references to colour in this figure legend, the reader is referred to the Web version of this article.)
Fig. 7
Fig. 7
(A) D374 Cγ - N20 (blue line) and G538 Cα - C3 (red line) distances. (B) E375Cδ - N18 (green line) and K288 Nζ - O (orange line) distances. (For interpretation of the references to colour in this figure legend, the reader is referred to the Web version of this article.)
Fig. 8
Fig. 8
Correlation matrix between positions of Cα atoms for the apo protein (upper left of the diagonal) and the complex (lower right of the diagonal), on left.
Fig. 9
Fig. 9
Projection of the trajectory for the apo protien (blue dots) and the complex (red dots) onto the first and second principle components. The structures on the left correspond to negative values of the PC, so that negative values of PC1 correspond to a larger distance between domains 1B and 2A and positive values represents a rotation of the C-terminus part of domain 1B towards domain 2A. (For interpretation of the references to colour in this figure legend, the reader is referred to the Web version of this article.)
Fig. 10
Fig. 10
(A) Four potential binding sites at the interface between domains 1A and 2A. Map for the movement of principal component 1 (B) and 2 (C) onto the surface of the binding sites, with blue denotes a positive values and red negative dα(i) values. (For interpretation of the references to colour in this figure legend, the reader is referred to the Web version of this article.)

References

    1. Helmy Y.A., Fawzy M., Elaswad A., Sobieh A., Kenney S.P., Shehata A.A. The COVID-19 pandemic: a comprehensive review of taxonomy, genetics, epidemiology, diagnosis, treatment, and control. J. Clin. Med. 2020;9:1225. - PMC - PubMed
    1. Nicola M., Alsafi Z., Sohrabi C., Kerwan A., Al-Jabir A., Iosifidis C., Agha M., Agha R. The socio-economic implications of the coronavirus pandemic (COVID-19): a review. Int. J. Surg. 2020;78:185–193. - PMC - PubMed
    1. Ioannidis J.P.A. Global perspective of COVID-19 epidemiology for a full-cycle pandemic. Eur. J. Clin. Invest. 2020;50 - PMC - PubMed
    1. Woolf S.H., Chapman D.A., Lee J.H. COVID-19 as the leading cause of death in the United States. JAMA. 2021;325:123–124. - PMC - PubMed
    1. Mishra S.K., Tripathi T. One year update on the COVID-19 pandemic: where are we now? Acta Trop. 2021;214:105778. - PMC - PubMed

Publication types