. 2022 Jan 13;20(1):25.
doi: 10.1186/s12916-021-02220-0.

Modelling upper respiratory viral load dynamics of SARS-CoV-2

Affiliations

Modelling upper respiratory viral load dynamics of SARS-CoV-2

Joseph D Challenger et al. BMC Med. .

Abstract

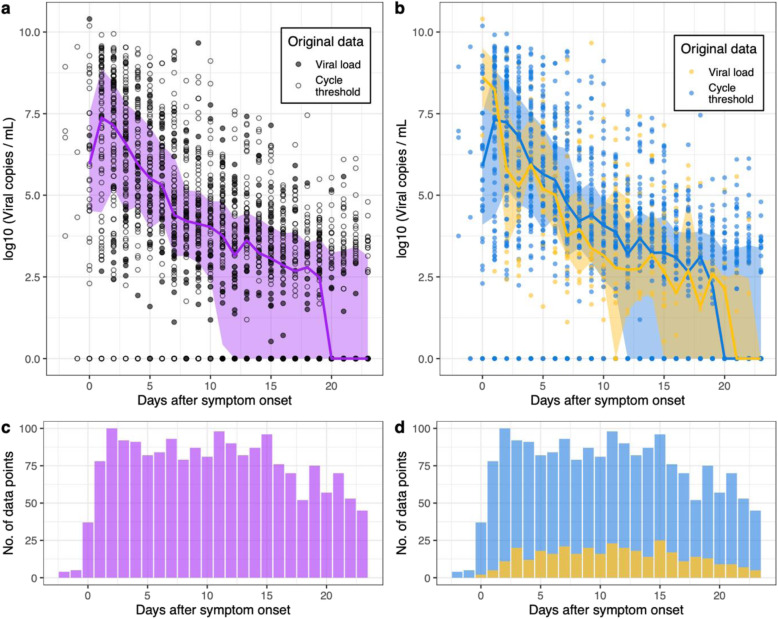
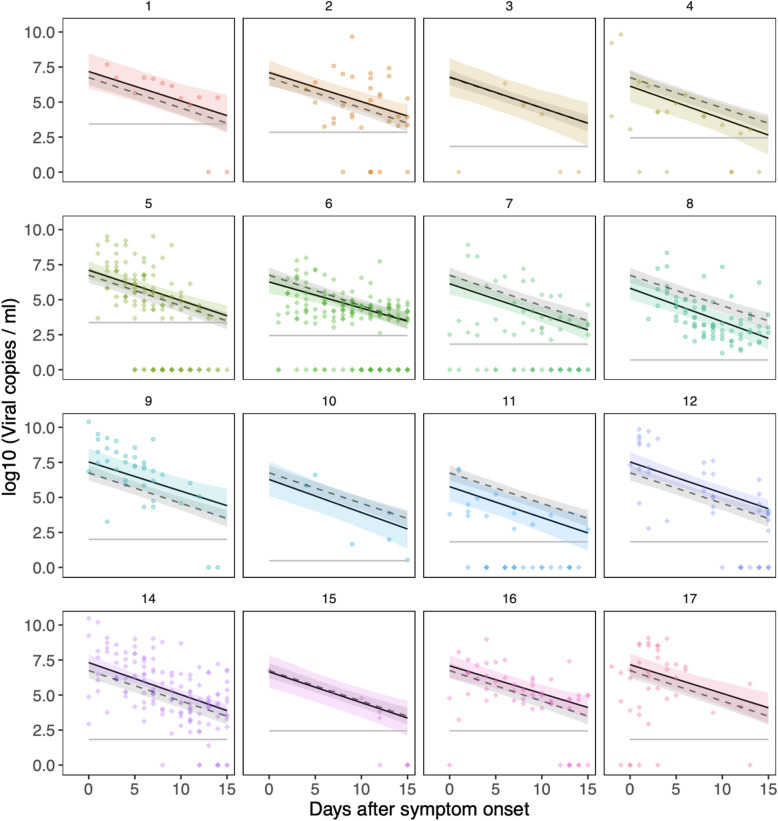
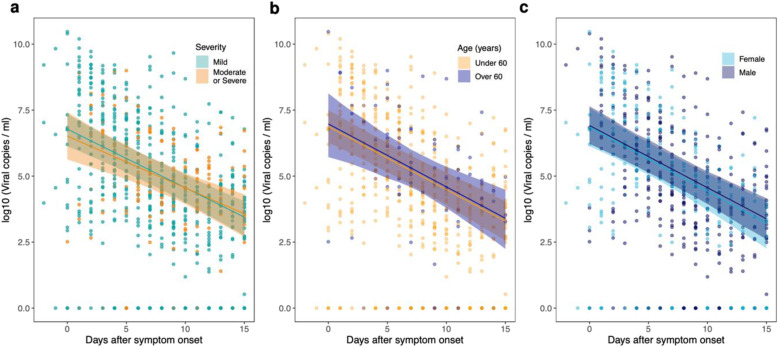
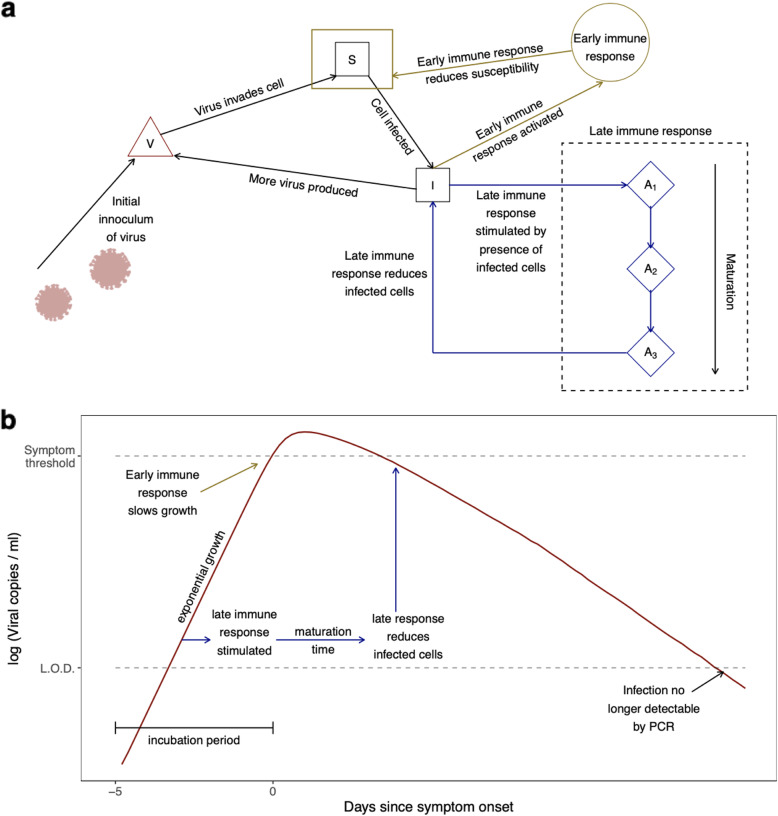
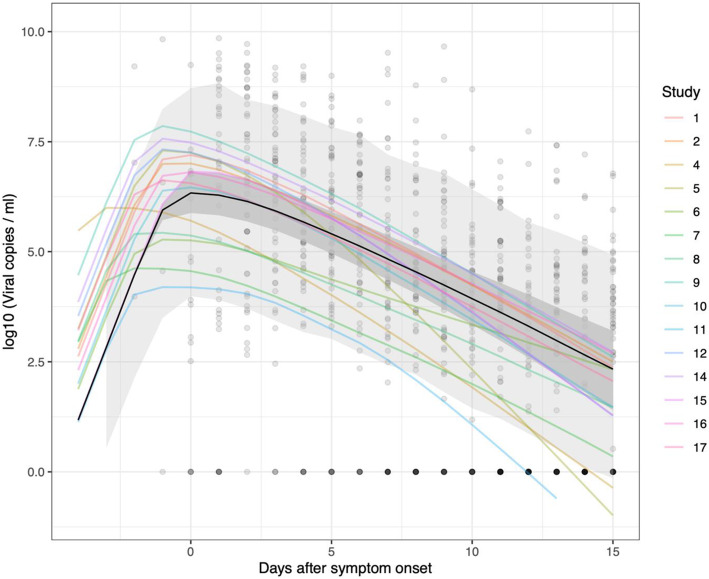
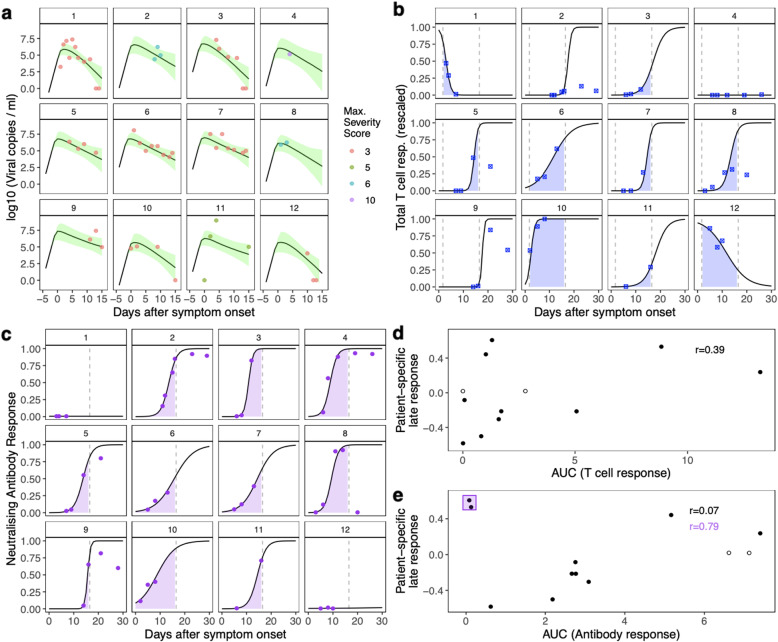
Relationships between viral load, severity of illness, and transmissibility of virus are fundamental to understanding pathogenesis and devising better therapeutic and prevention strategies for COVID-19. Here we present within-host modelling of viral load dynamics observed in the upper respiratory tract (URT), drawing upon 2172 serial measurements from 605 subjects, collected from 17 different studies. We developed a mechanistic model to describe viral load dynamics and host response and contrast this with simpler mixed-effects regression analysis of peak viral load and its subsequent decline. We observed wide variation in URT viral load between individuals, over 5 orders of magnitude, at any given point in time since symptom onset. This variation was not explained by age, sex, or severity of illness, and these variables were not associated with the modelled early or late phases of immune-mediated control of viral load. We explored the application of the mechanistic model to identify measured immune responses associated with the control of the viral load. Neutralising antibodies correlated strongly with modelled immune-mediated control of viral load amongst subjects who produced neutralising antibodies. Our models can be used to identify host and viral factors which control URT viral load dynamics, informing future treatment and transmission blocking interventions.


Conflict of interest statement

LCO declares grant funding from the Bill and Melinda Gates Foundation.

Figures

Fig. 1
Fig. 1
Declining viral loads after symptom onset. a Data from all 17 studies used in our analysis (circles). For illustrative purposes, viral samples that were negative for the virus are set to 1 viral copy per ml. The median viral load is calculated for each day (purple line), as well as the interquartile range (purple shaded region). From day 20 onwards, over half the samples recorded on each of these days were below the limit of detection. b Here we show the quantified PCR data (yellow) separately from the data for which viral loads were estimated (blue) using an averaged standard curve (Materials and methods). In the lower panels (c, d), we display the number of data points available on each day for this analysis
Fig. 2
Fig. 2
Viral load data and mixed-effects regression model. Data from all 16 studies used in the regression modelling (numbered as in Table 1), showing samples taken within the first 15 days of symptom onset. We fitted a regression model to the data, with study-specific random-effects for the peak viral load and rate of decline (slope). The solid lines show the posterior mean behaviour for each study, with the shaded areas showing the 95% credible intervals. The dashed line, which is the same in each panel, is the average trajectory across the 16 studies. The 95% credible interval for the averaged trajectory is shown by the grey shaded region. Population-level parameters for this model are shown in Supplementary Table 3
Fig. 3
Fig. 3
Inclusion of fixed effects in the regression models. All regression models included study- and patient-specific random effects for the peak and slope (i.e. rate of decline) of the viral load. We then added fixed effects, both separately and in combination, to see if the model fit could be improved (Table 2). These fixed effects were: age, sex, and severity of disease. Here we show results for the three models containing one fixed effect (left: severity; middle: age; right: sex). The inclusion of severity, age, or sex did not improve the goodness of fit (Table 2). In the modelling here, age was included as a binary variable (under or over 60 years of age)
Fig. 4
Fig. 4
Schematic of the mechanistic model. a Illustration of the components of the model. The infection is triggered by an initial inoculum of virus in the upper respiratory tract. The virus invades susceptible cells (S): once cells are infected (I) they can produce more of the virus (V). In this manner, the infection grows exponentially. The presence of infectious cells triggers the immune response. In the model, we capture this using an early immune response and a late immune response (A). Activated by a high density of infected cells, the effect of the early immune response is to reduce susceptibility of cells to the virus, thereby slowing the rate of growth of the infection. The late immune response, which requires a maturation phase before becoming effective, reduces the infectious cell reservoir, eventually resolving the infection. These two mechanisms represent a simplification of a much broader response, involving innate and adaptive mechanisms. The early response, the activation of which coincides with symptom onset, is more representative of the innate immune response, whilst the late response is more representative of the adaptive response. However, we do not attempt to fully distinguish between innate and adaptive responses in this model, due to their complex interplay. b Linking the model’s mechanisms to the observed viral load dynamics. Prior to the activation of the immune responses, viral load grows exponentially. Activation of the early immune response, which causes febrile symptoms, slows the growth rate. After a maturation phase, the late immune response starts clearing the infectious cells, leading to a decline in the circulating virus. Eventually, the infection becomes undetectable when the viral load passes below the limit of detection (LOD)
Fig. 5
Fig. 5
Averaged trajectories obtained from the fitted mechanistic model. In this plot, we show the average trajectory predicted for each study (coloured lines), generated using the median value used for the initial viral load at t=0 in each case. We also show the average trajectory across all the studies, indicated by the black line. The dark grey shaded area indicates the 95% credible interval for this average trajectory. The light grey area accounts for the variation observed around the average trajectory (generated using samples from σ, as defined in in Eq. 8, and calculating the 95% prediction interval for the population-level dynamics). The fit to data from Study 3 is not shown, as this study only contained one patient, which means one cannot distinguish between study- and patient-specific random effects. The opaque black circles are the data points from the 16 studies used to fit the model. For illustrative purposes, viral samples that were negative for the virus are set to 1 viral copy per ml (i.e. 0 on the log-scale). The results from the mechanistic model presented here were obtained using 1500 samples from the posterior distribution, with the median trajectories plotted
Fig. 6
Fig. 6
Paired viral load and immune response dynamics. These panels show data from 12 patients, reported by Tan et al. [7]. a Viral load measurements (points) and modelled viral load trajectories from the mechanistic model (black lines show the posterior means, shaded areas are the 95% credible intervals). The coloured symbols indicate the severity score recorded for each subject (on the WHO severity scale). b Measured total T cell response (blue symbols), rescaled by the largest observed measurement. A logistic curve was fitted through the points for each patient, to facilitate the area under the curve (AUC, blue shaded area) calculation. To calculate both AUCs (antibody and T cell) we used only the first 15 days after symptom onset, as this was the time period used to fit our models. c Neutralising antibody response (purple dots). A logistic curve was fitted through the points for each patient, to facilitate the area under the curve (AUC, purple shaded area) calculation. d Relationship between the calculated AUCs of the T cell responses and modelled patient-specific immune responses (p value = 0.208). e Relationship between the calculated AUCs of the antibody responses and modelled patient-specific immune responses. Two patients failed to mount an antibody response which neutralised virus. The correlation between the patient-specific response and the AUC is much stronger when these patients are not included (p value = 0.006, compared to p value = 0.831 when all 12 subjects are considered). We note that for subjects 4 and 8 (open circles in d and e), fewer than 3 viral load measurements were available, meaning their fitted parameters may shrink to the study mean

References

    1. Knight SR, Ho A, Pius R, Buchan I, Carson G, Drake TM, et al. Risk stratification of patients admitted to hospital with COVID-19 using the ISARIC WHO Clinical Characterisation Protocol: development and validation of the 4C Mortality Score. BMJ. 2020;9. - PMC - PubMed
    1. Docherty AB, Harrison EM, Green CA, Hardwick HE, Pius R, Norman L, et al. Features of 20 133 UK patients in hospital with COVID-19 using the ISARIC WHO Clinical Characterisation Protocol: prospective observational cohort study. BMJ. 2020;22. - PMC - PubMed
    1. Pujadas E, Chaudhry F, McBride R, Richter F, Zhao S, Wajnberg A, et al. SARS-CoV-2 viral load predicts COVID-19 mortality. Lancet Respir. 2020;5:1. - PMC - PubMed
    1. Fajnzylber J, Regan J, Coxen K, Corry H, Wong C, Rosenthal A, et al. SARS-CoV-2 viral load is associated with increased disease severity and mortality. Nat Commun. 2020;11(1):5493. doi: 10.1038/s41467-020-19057-5. - DOI - PMC - PubMed
    1. Marks M, Millat-Martinez P, Ouchi D, Roberts CH, Alemany A, Corbacho-Monné M, et al. Transmission of COVID-19 in 282 clusters in Catalonia, Spain: a cohort study. Lancet Infect Dis. 2021;1:1–8. - PMC - PubMed

Publication types

Substances