. 2022 Jan 18;119(3):e2110196119.
doi: 10.1073/pnas.2110196119.

LRRTM3 regulates activity-dependent synchronization of synapse properties in topographically connected hippocampal neural circuits

Affiliations

LRRTM3 regulates activity-dependent synchronization of synapse properties in topographically connected hippocampal neural circuits

Jinhu Kim et al. Proc Natl Acad Sci U S A. .

Abstract

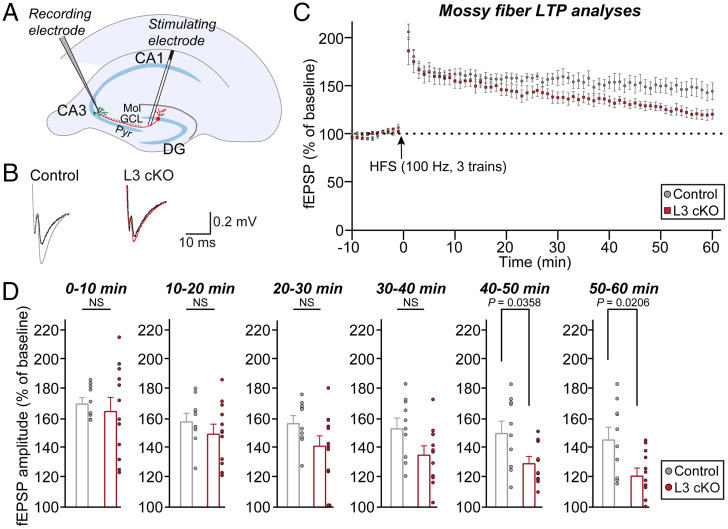
Synaptic cell-adhesion molecules (CAMs) organize the architecture and properties of neural circuits. However, whether synaptic CAMs are involved in activity-dependent remodeling of specific neural circuits is incompletely understood. Leucine-rich repeat transmembrane protein 3 (LRRTM3) is required for the excitatory synapse development of hippocampal dentate gyrus (DG) granule neurons. Here, we report that Lrrtm3-deficient mice exhibit selective reductions in excitatory synapse density and synaptic strength in projections involving the medial entorhinal cortex (MEC) and DG granule neurons, accompanied by increased neurotransmitter release and decreased excitability of granule neurons. LRRTM3 deletion significantly reduced excitatory synaptic innervation of hippocampal mossy fibers (Mf) of DG granule neurons onto thorny excrescences in hippocampal CA3 neurons. Moreover, LRRTM3 loss in DG neurons significantly decreased mossy fiber long-term potentiation (Mf-LTP). Remarkably, silencing MEC-DG circuits protected against the decrease in the excitatory synaptic inputs onto DG and CA3 neurons, excitability of DG granule neurons, and Mf-LTP in Lrrtm3-deficient mice. These results suggest that LRRTM3 may be a critical factor in activity-dependent synchronization of the topography of MEC-DG-CA3 excitatory synaptic connections. Collectively, our data propose that LRRTM3 shapes the target-specific structural and functional properties of specific hippocampal circuits.

Keywords: LRRTM3; dentate gyrus; excitatory synapse; long-term plasticity; medial entorhinal cortex.


Conflict of interest statement

The authors declare no competing interest.

Figures

Fig. 1.
Fig. 1.
Reduced excitatory synaptic density and strength at MPP–DG synapses of LRRTM3-deficient mice. (A) Representative EM images of synapses on dendritic shafts or spines in the MML and OML of the DG in WT and Lrrtm3-KO mice. Areas marked in light sky blue and yellow indicate presynaptic and postsynaptic sites, respectively (Scale bar, 1 μm). (B and C) Mean number of synapses per unit volume of MML (B) and OML (C) in WT (gray bar) and Lrrtm3-KO (orange or blue bar) mice. Data represent means ± SEMs (n = 12 dissector volumes from two mice per genotype per layer; Student’s t test). (D and E) Cumulative distribution plots for the longest PSD lengths of individual spines in the MML (D) and OML (E) in WT (gray line) and Lrrtm3-KO (orange or blue line) mice. Data represent means ± SEMs (WT [MML], n = 485; KO [MML], n = 385 spines; WT [OML], n = 527; KO [OML], n = 466 spines; Kolmogorov–Smirnov test). (FH) Measurements of excitatory synaptic strength via I-O curves of control and L3 cKO mice, showing representative AMPAR-EPSC traces (F), summary plotting of the EPSC amplitudes as a function of MPP stimulation current (G), and summary graphs of fitted linear I-O slopes (H). Data represent means ± SEMs (n denotes the number of recorded neurons; control, n = 21; L3 cKO, n = 23; Mann–Whitney U test). (I and J) Measurements of NMDAR/AMPAR-EPSC ratios at MPP–DG synapses of control and L3 cKO mice. AMPAR-EPSCs were recorded at −70 mV in the presence of picrotoxins, and NMDAR-EPSCs were then recorded at +40 mV (I, representative traces; J, summary graphs). (KM) Same as FH, except that AMPAR-EPSCs were recorded in the same neurons as in FH as a function of LPP stimulation. Data represent means ± SEMs (n denotes the number of recorded neurons; control, n = 19; L3 cKO, n = 13; Mann–Whitney U test). (N and O) Same as I and J, except that NMDAR/AMPAR-EPSC ratios were measured in the same neurons as in I and J as a function of LPP stimulation. Data represent means ± SEMs (n denotes the number of recorded neurons; control, n = 8; L3 cKO, n = 6; Mann–Whitney U test). (P and R) Representative traces of PPRs of EPSCs at MPP–DG synapses (P) or LPP–DG synapses (R) at two different interstimulus intervals (50 and 100 ms). (Q and S) EPSC-PPRs at MPP–DG synapses (Q) and LPP–DG synapses (S) as a function of the indicated interstimulus intervals (50, 100, 150, and 200 ms). Data represent means ± SEMs (n denotes the number of recorded neurons; control [MPP], n = 12; L3 cKO [MPP], n = 14; control [LPP], n = 11; L3 cKO [LPP], n = 10; Mann–Whitney U test). NS, not significant.
Fig. 2.
Fig. 2.
Marked reduction of MfBs and CA3 TEs in LRRTM3-deficient mice. (A) Representative SBF-SEM images of Mf–CA3 synapses. CA3 dendritic segment innervated by MfBs is shown with manually segmented contours. Note the decreased number of MfBs in the Lrrtm3-KO mice. (Scale bar, 2 μm.) (B) MfBs at every 10th percentile in order of increasing MfB volume (Scale bar, 2 μm). Light sky blue, main MfB; blue, axonal fiber; orange, Mf filopodia. (C) Quantitation of MfB density (number of MfBs per micrometer dendrite length). Data represent means ± SEMs (n = 4 dendritic segments per group; Student’s t test). (D) Mean of MfB volumes (WT, n = 66; KO, n = 43 MfBs; Student’s t test). (E) Quantification of mean synapse numbers per MfB normalized by MfB volume (WT, n = 65; KO, n = 42 MfBs; Mann–Whitney U test). (F) Quantitation of TE density (number of TEs per MfB) normalized by MfB volume. Data represent means ± SEMs (WT, n = 64; KO, n = 42 MfBs; Mann–Whitney U test). (G) Representative 3D reconstruction of DG–CA3 synapses in WT and Lrrtm3-KO mice. The complex structures of individual TEs are displayed by showing the same dendritic segments with and without corresponding MfBs (Scale bar, 2 μm). (H) TEs at every 10th percentile in order of increasing TE volume. (Scale bar, 1 μm.) (I) Quantitation of TE density (number of TEs per micrometer dendrite length). Data are presented as means ± SEMs (n = 4 dendritic segments per group; Student’s t test). (J) The mean value of TE volumes (WT, n = 164; KO, n = 114 TEs; Mann–Whitney U test). (K) Quantification of mean synapse numbers per TE normalized by TE volume (WT, n = 164; KO, n = 114 TEs; Mann–Whitney U test). (L) Quantitation of MfB ratio (number of MfBs per TE). Data are presented as means ± SEMs (WT, n = 65; KO, n = 42 MfBs; Mann–Whitney U test). (M) Representative TEM images of Mf–CA3 synapses. Areas marked in red/yellow/green and light sky-blue indicate presynaptic and postsynaptic sites, respectively (Scale bar, 2 μm). (N) Quantification of Mf–CA3 synaptic density (expressed as the number of Mf–CA3 synapses per square micrometer). Data represent means ± SEMs (n = 60 images from three mice per group; Mann–Whitney U test). (O) Mean of MfB areas (WT, n = 139; L3 cKO, n = 98; Mann–Whitney U test).
Fig. 3.
Fig. 3.
Reduced maintenance of Mf-LTP in LRRTM3-deficient mice. (A) Schematic of an electrophysiological recording configuration showing stimulating sites in hippocampal DG and recording sites in hippocampal CA3 SR fields. (B) Representative average traces of field excitatory postsynaptic potentials (fEPSPs) evoked by stimulation of Mf before LTP induction by high-frequency stimulation (HFS) (black) and 50 to 60 min after LTP induction from control and Lrrtm3-cKO mice (light gray, control; red, L3 cKO). (C) fEPSP amplitudes plotted against Mf-LTP experiments as a function of recording time. An HFS (100 Hz, 1 s, three trains with a 10-s interval between trains) is given at the time indicated by the arrow. Data represent means ± SEMs (Mann–Whitney U test). (D) Quantification of fEPSP amplitudes in the Mf-LTP recording experiments. Data represent means ± SEMs (n denotes the number of analyzed slices; control, n = 10; L3 cKO, n = 12; Mann–Whitney U test).
Fig. 4.
Fig. 4.
Impaired excitatory synapse refinement and Mf-LTP in LRRTM3-deficient mice are rescued by blocking synaptic transmission at MPP–DG synapses. (A) Design of AAVs used to inactivate neurotransmitter release from MEC neurons to DG granule neurons. Double-floxed inverted TeNT-AAV (2xFlx-TeNT-AAV) encodes a bicistronic expression encoding EGFP (for visualizing infected MEC neurons) and TeNT (to block synaptic transmission). The coding region of the double-floxed inverted TeNT-AAV is not translated until Flpo recombinase flips the inverted coding region into the correct orientation. WGA-Flpo AAV mediates bicistronic expression of mCherry and WGA-Flpo. When this AAV infects DG neurons, WGA-Flpo is trans-neuronally transferred to connected MEC neurons, whereas mCherry is only expressed in the infected DG neurons. (Scale bar, 100 μm.) (B and C) Measurements of excitatory synaptic strength via I-O curves of control- and TeNT-expressing WT mice, presenting representative AMPAR-EPSC traces (B), summary plotting of the EPSC amplitudes as a function of MPP stimulation current (C, Left), and summary graph of fitted linear I-O slopes (C, Right). Data represent means ± SEMs (n denotes the number of recorded neurons; control, n = 10; TeNT, n = 11; Mann–Whitney U test). (D and E) Same as B and C, except that AMPAR-EPSCs were recorded in the same neurons as in B and C as a function of LPP stimulation. Data represent means ± SEMs (n denotes the number of recorded neurons; control, n = 8; TeNT, n = 9; Mann–Whitney U test). (F and G) Representative immunofluorescence images (F) and quantification (G) of VGLUT1 puncta density. Data shown are means ± SEMs (n denotes the number of analyzed mice; ΔCre [Ctrl], n = 4; Cre [Ctrl], n = 4; ΔCre [TeNT], n = 4; Cre [TeNT], n = 4 mice; ANOVA followed by Shapiro–Wilk normality test). (Scale bar, 20 μm.) IHC, immunohistochemistry. (H) Representative average traces of fEPSPs, evoked in WT and Lrrtm3-cKO mice injected with either control or TeNT by stimulation of Mf before LTP induction by HFS (black) and 50 to 60 min after LTP induction (light gray, control [Ctrl]; red, L3 cKO [Ctrl]; blue, control [TeNT]; green, L3 cKO [TeNT]). (I) fEPSP amplitudes plotted against Mf-LTP experiments as a function of recording time. An HFS (100 Hz, three 1-s trains at 10-s intervals) is given at the time indicated by the arrow. Data represent means ± SEMs. (J) Quantification of fEPSP amplitudes in the Mf-LTP recording experiments. Data represent means ± SEMs (n denotes the number of analyzed slices; WT [Ctrl], n = 6; WT [TeNT], n = 8; L3 cKO [Ctrl], n = 11; L3 cKO [TeNT], n = 7; nonparametric ANOVA with post hoc Tukey’s multiple-comparison test).
Fig. 5.
Fig. 5.
Action of LRRTM3 in regulating excitatory synaptic transmission at MPP–DG synapses is a prerequisite for synchronized activity-dependent circuit properties. (A) Design of AAVs used to inactivate neurotransmitter release from MEC neurons to DG granule neurons. Double-floxed inverted TeNT-AAV (2xFlx-TeNT-AAV) encodes a bicistronic expression construct encoding EGFP (for visualizing infected MEC neurons) and TeNT (to block synaptic transmission). The coding region of the double-floxed inverted TeNT-AAV is not translated until the Flpo recombinase flips the inverted coding region into the correct orientation. WGA-Flpo AAV mediates bicistronic expression of mCherry and WGA-Flpo. Upon infection of DG neurons with this AAV, WGA-Flpo is trans-neuronally transferred to connected MEC neurons, whereas mCherry is only expressed in the infected DG neurons. (B and C) Representative traces (B), summary graphs (C, Top), and average (C, Bottom) of intrinsic excitability measured as firing rates in response to step depolarizing currents (duration, 500 ms) in DG granule neurons. Individual points represent means ± SEMs (n denotes the number of recorded neurons; control, n = 16; control [+TeNT], n = 16; L3 cKO, n = 26; L3 cKO [+TeNT], n = 16; ANOVA followed by Tukey’s post hoc test after Shapiro–Wilk normality test). (D) Schematic of an electrophysiological recording configuration showing stimulating and recording sites in hippocampal CA3. (E) Representative traces of PPRs of EPSCs at MPP–DG synapses at two different interstimulus intervals (50 and 100 ms). (F) Average of EPSC-PPRs at MPP–DG synapses at four different interstimulus intervals (25, 50, 100, and 200 ms). Data represent means ± SEMs (n denotes the number of recorded neurons; control, n = 20; L3 cKO+hM3Dq [vehicle], n = 16; L3 cKO+hM3Dq [CNO], n = 12; nonparametric ANOVA with Kruskal–Wallis test followed by post hoc Dunn’s multiple-comparison test).

References

    1. Condomitti G., de Wit J., Heparan sulfate proteoglycans as emerging players in synaptic specificity. Front. Mol. Neurosci. 11, 14 (2018). - PMC - PubMed
    1. Park D., Bae S., Yoon T. H., Ko J., Molecular mechanisms of synaptic specificity: Spotlight on hippocampal and cerebellar synapse organizers. Mol. Cells 41, 373–380 (2018). - PMC - PubMed
    1. Südhof T. C., Towards an understanding of synapse formation. Neuron 100, 276–293 (2018). - PMC - PubMed
    1. Biederer T., Kaeser P. S., Blanpied T. A., Transcellular nanoalignment of synaptic function. Neuron 96, 680–696 (2017). - PMC - PubMed
    1. Südhof T. C., Synaptic neurexin complexes: A molecular code for the logic of neural circuits. Cell 171, 745–769 (2017). - PMC - PubMed

Publication types

MeSH terms