. 2022 Jan 18;119(3):e2114928118.
doi: 10.1073/pnas.2114928118.

Functional communication between IP3R and STIM2 at subthreshold stimuli is a critical checkpoint for initiation of SOCE

Affiliations

Functional communication between IP3R and STIM2 at subthreshold stimuli is a critical checkpoint for initiation of SOCE

Moaz Ahmad et al. Proc Natl Acad Sci U S A. .

Abstract

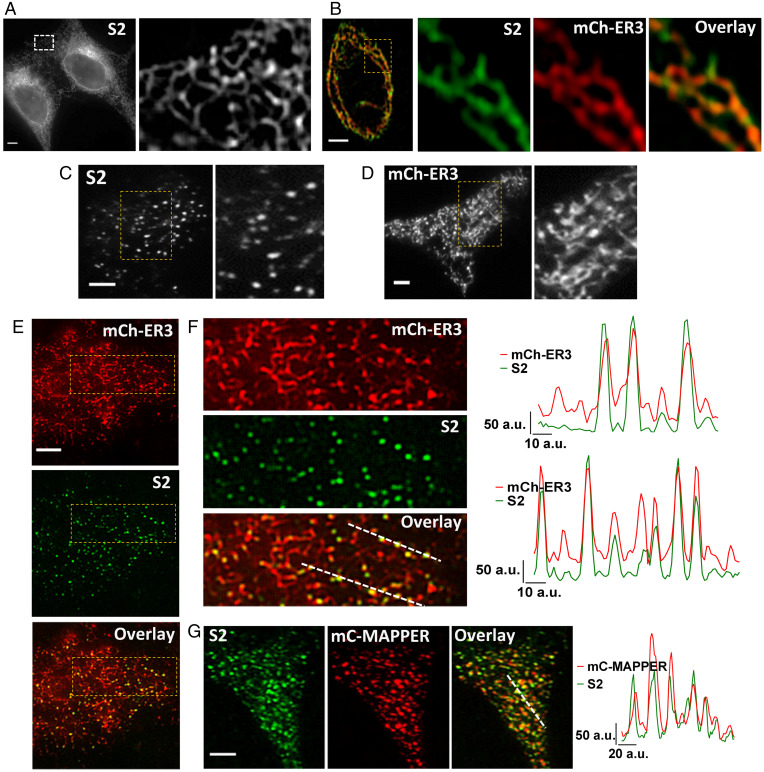
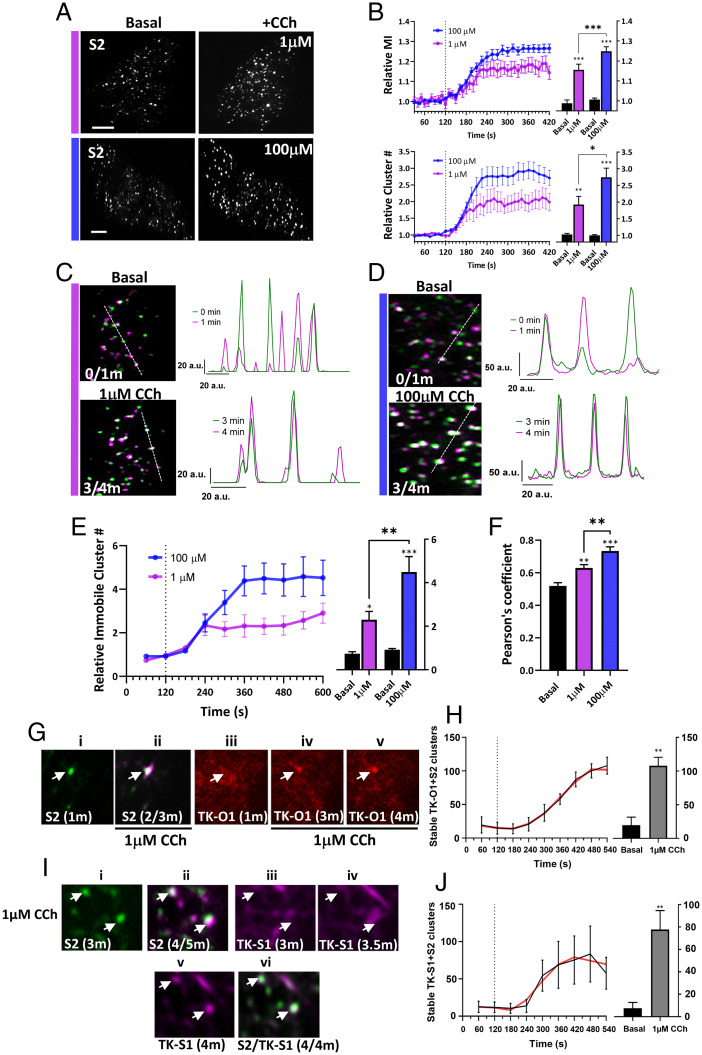
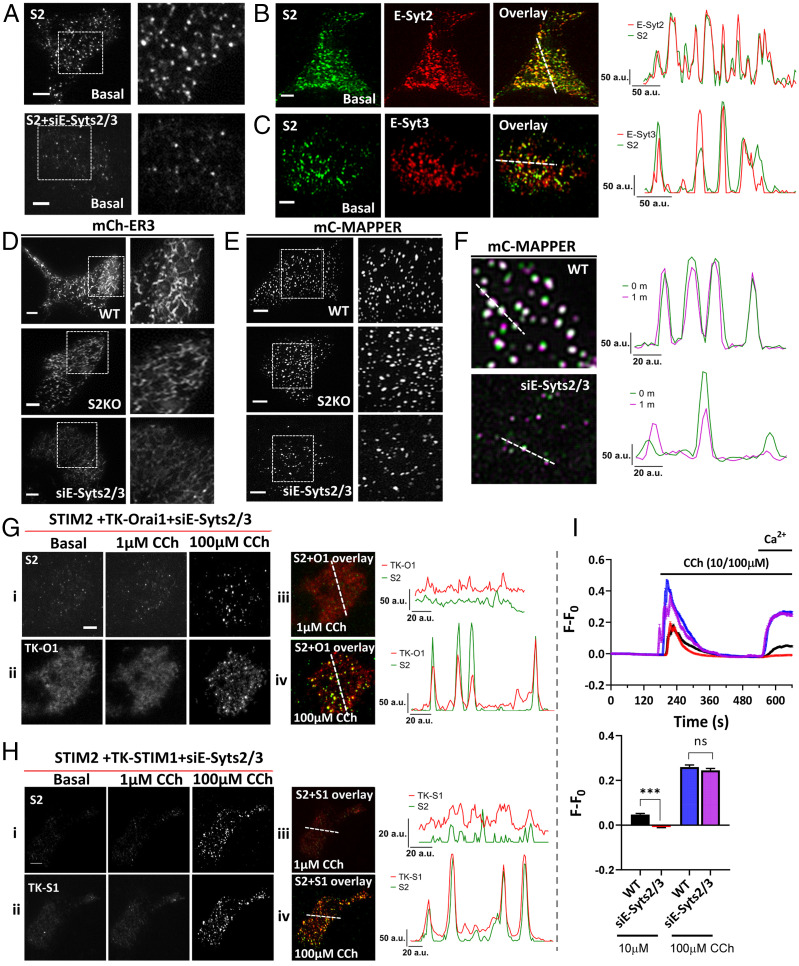
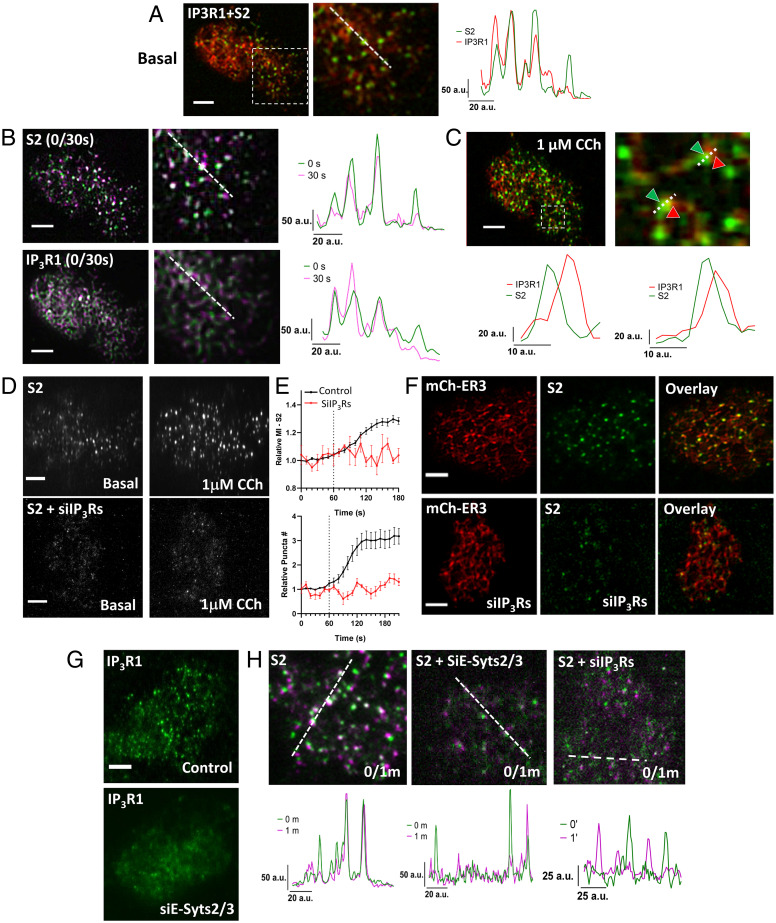
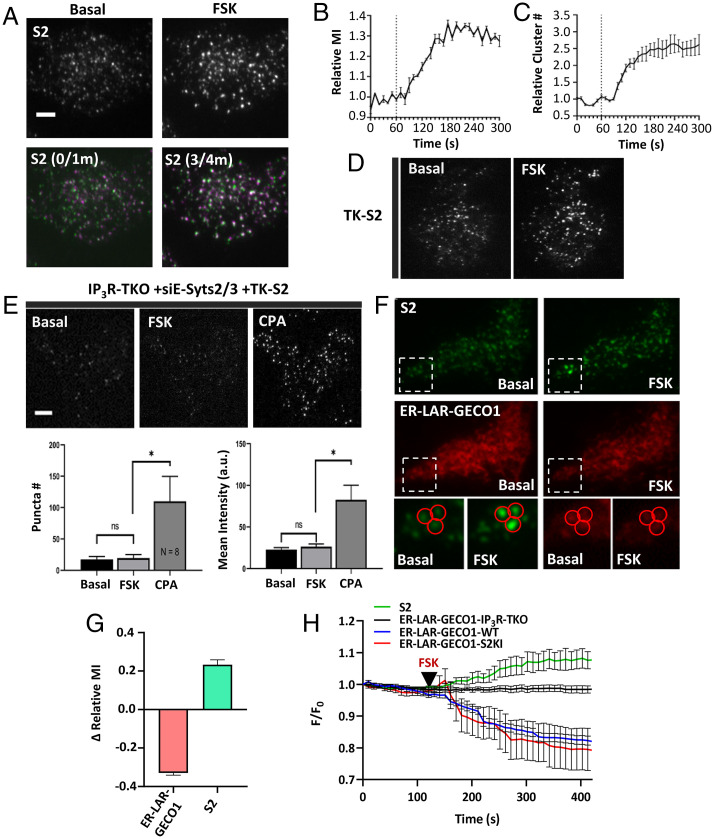
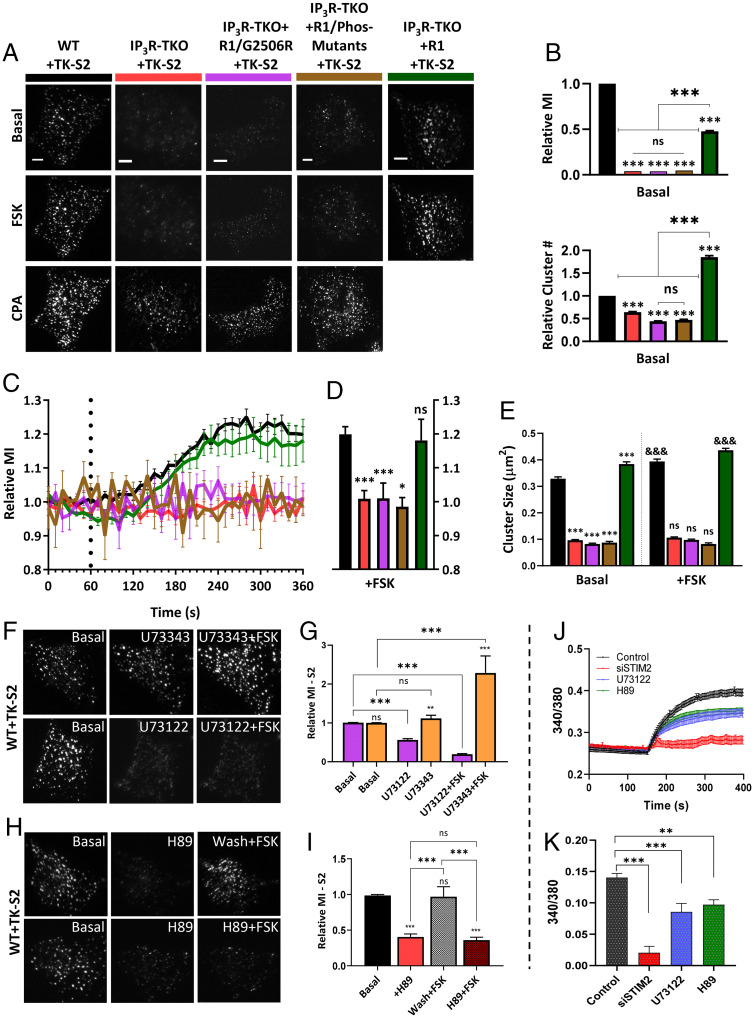
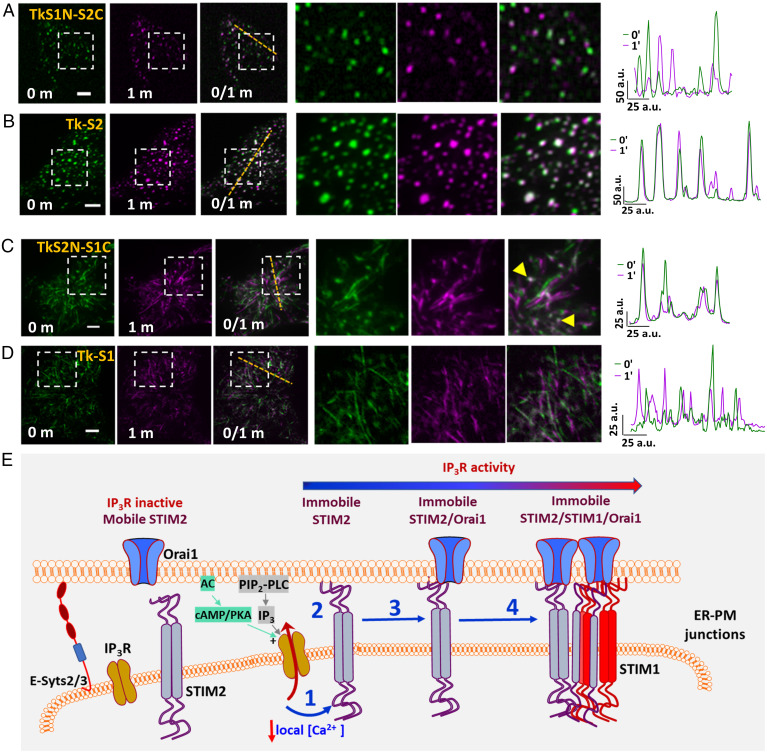
Stromal interaction molecules, STIM1 and STIM2, sense decreases in the endoplasmic reticulum (ER) [Ca2+] ([Ca2+]ER) and cluster in ER-plasma membrane (ER-PM) junctions where they recruit and activate Orai1. While STIM1 responds when [Ca2+]ER is relatively low, STIM2 displays constitutive clustering in the junctions and is suggested to regulate basal Ca2+ entry. The cellular cues that determine STIM2 clustering under basal conditions is not known. By using gene editing to fluorescently tag endogenous STIM2, we report that endogenous STIM2 is constitutively localized in mobile and immobile clusters. The latter associate with ER-PM junctions and recruit Orai1 under basal conditions. Agonist stimulation increases immobile STIM2 clusters, which coordinate recruitment of Orai1 and STIM1 to the junctions. Extended synaptotagmin (E-Syt)2/3 are required for forming the ER-PM junctions, but are not sufficient for STIM2 clustering. Importantly, inositol 1,4,5-triphosphate receptor (IP3R) function and local [Ca2+]ER are the main drivers of immobile STIM2 clusters. Enhancing, or decreasing, IP3R function at ambient [IP3] causes corresponding increase, or attenuation, of immobile STIM2 clusters. We show that immobile STIM2 clusters denote decreases in local [Ca2+]ER mediated by IP3R that is sensed by the STIM2 N terminus. Finally, under basal conditions, ambient PIP2-PLC activity of the cell determines IP3R function, immobilization of STIM2, and basal Ca2+ entry while agonist stimulation augments these processes. Together, our findings reveal that immobilization of STIM2 clusters within ER-PM junctions, a first response to ER-Ca2+ store depletion, is facilitated by the juxtaposition of IP3R and marks a checkpoint for initiation of Ca2+ entry.

Keywords: ER–PM junction; IP3R; STIM2; clustering; endogenous protein.


Conflict of interest statement

The authors declare no competing interest.

Figures

Fig. 1.
Fig. 1.
Visualization of endogenous STIM2. (A) Localization of endogenous mVenus-STIM2 (mV-STIM2; S2 in images, acquired by confocal microscopy) in STIM2-KI cells, enlargement of the demarcated area shown on the Right. (B) Airyscan images with enlarged region of STIM2-KI cell showing mV-STIM2 (green), expressed mCherry-ER3 (mCh-ER3, red), and overlay. (C) TIRFM images of STIM2-KI cells in basal, unstimulated conditions with enlargement of demarcated area on the Right. (D) Localization of mCh-ER3 in HEK293 with enlarged area on the Right. (E) Images from Upper to Lower: mCh-ER3 expressed in STIM2-KI cells (ER, red), mV-STIM2 (S2, green), and overlay. (F) Enlarged images of demarcated regions in E and line scans (position indicated in overlay image mCh-ER3 [ER, red] and mVenus-STIM2 [S2, green]). (G) mCerulean-MAPPER (mC-MAPPER, pseudocolored red) expressed in STIM2-KI cells and mV-STIM2 (S2, green), and overlay; line scans (position indicated in overlay image) show mC-MAPPER (red) and mV-STIM2 (green). All microscope images show representative cells from at least three experiments. (Scale bars, 5 µm.) a.u.: arbitrary units.
Fig. 2.
Fig. 2.
mVenus-STIM2 clusters display decreased mobility in response to carbachol stimulation. (A) mV-STIM2 in STIM2-KI cells (S2 in images) before (Left) and after (Right) stimulation (with 1 µM or 100 µM CCh). (B) mV-STIM2 cluster intensity (mean ± SEM of mean intensity [MI], Upper) and number (cluster #, Lower) in response to 1 µM (magenta) or 100 µM CCh (blue) (dotted line indicates CCh addition). Bar graphs showing values at 1-min (basal) and 5-min (stimulated; 1 µM or 100 µM) time points. (C) Overlay of mV-STIM2 images taken at 1-min intervals (clusters pseudocolored either magenta or green) with immobile clusters appearing as white. The overlay images before stimulation (frames 0- and 1-min time points, 0/1m; Upper) and after stimulation with 1 µM CCh (3- and 4-min time points, 3/4m). Line scans are on the Right (position indicated in overlay images). (D) Images were analyzed as described in C for cells before and after stimulation with 100 µM CCh. (E) Increase of immobile mV-STIM2 (mean ± SEM) clusters stimulated with 1 µM (magenta) or 100 µM CCh (blue). Bar graphs (Right) showing number of clusters before and after stimulation. (F) Pearson’s correlation coefficients of clusters in C and D, basal and after stimulation (1 and 5 min). (G) TK-O1 recruitment to immobile S2 clusters. S2 cluster (i) prior to stimulation (1 min) and (ii) overlay of S2 after stimulation with 1 µM CCh (2/3 min overlay, immobile cluster indicated by arrow). TK-O1 cluster (iii) prior to stimulation and following stimulation at the (iv) 3- and (v) 4-min time points, with the emergent cluster colocalized with the stable mV-STIM2 cluster (arrow). (H) Increase in immobile clusters containing both TK-O1 and S2 after 1 µM CCh addition; bar graph showing number of stable clusters before (basal) and after CCh stimulation (1- and 9-min time points, respectively, smoothened curve in red). (I) TK-S1 recruitment to immobile S2 clusters. S2 clusters at (i) 3 min, (ii) overlay of images from 4- and 5-min (4/5m overlay) time points. TK-S1 clusters after CCh stimulation at (iii) 3-, (iv) 3.5-, and (v) 4-min time points. (vi) Overlay of TK-S1 and S2 at 4-min time point (4/4m). (J) Increase in immobile clusters containing both TK-S1 and S2 after 1 µM CCh stimulation; bar graph showing number of stable clusters before (basal) and after CCh stimulation (1- and 9-min time points respectively, smoothened curve [red]). All images were acquired using TIRFM and are representative of cells from at least three experiments with CCh added at 2 min. Statistical significance was assessed using Student’s t tests for two groups and ANOVA for multiple groups, and presented as *P < 0.05, **P < 0.01, and ***P < 0.001. (Scale bars, 5 µm.) a.u.: arbitrary units.
Fig. 3.
Fig. 3.
Role of extended synaptotagmins in localization of mVenus-STIM2 in ER–PM junction. (A) mV-STIM2 (S2) in control (Top) and siE-Syts2/3-transfected STIM2-KI cells (Bottom); enlargement of demarcated area on the Right. (B and C) Unstimulated STIM2-KI cells expressing (B) mCh-E-Syt2 (E-Syt2) or (C) mCh-E-Syt3 (E-Syt3). From Left to Right: S2 (green), E-Syt2 or E-Syt3 (red), and overlay of both proteins (colocalized clusters in yellow). Line scans (position indicated in overlay image) show overlapping mV-S2 and E-Syt clusters. (D) mCherry-ER3 (mCh-ER) or (E) mC-MAPPER expressed in WT (Top) or STIM2 knockout (S2KO, Middle) HEK293 cells, and WT cells treated with siE-Syts2/3 (Bottom). Enlargements of the area demarcated by a square box are shown on the Right. (F) Overlay images of mCerulean-MAPPER in WT cells (Top) and WT cells treated with siE-Syts2/3 (Bottom) under basal/unstimulated conditions (0/1m overlay) where white clusters represent immobile clusters. Line scans (position indicated in overlay image) show overlapping peaks for relatively immobile clusters. (G) STIM2-KI cells transfected with siE-Syts2/3 in addition to TK-Orai1-mCh; (i) mVenus-STIM2 (S2) and (ii) TK-Orai1-mCh (TK-O1) in unstimulated (Left), 1 µM CCh (Middle), and 100 µM conditions (Right). (iii and iv) Overlay of mV-STIM2 (S2, green) and TK-Orai1-mCh (TK-O1, red) following stimulation with 1 µM and 100 µM CCh, respectively. Line scans (position indicated on the overlay images) showing colocalized clusters of S2 and TK-O1. (H) Similar set of experiments as in G but with STIM2-KI cells expressing TK-mCh-STIM1 (TK-S1) + siE-Syts2/3. (I) Fura-2 fluorescence (F-F0, mean ± SEM) in control WT and siE-Syts2/3-treated WT cells stimulated with 10 µM or 100 µM CCh. Bar graphs show increase in fluorescence due to 1 mM Ca2+ entry. All TIRFM images show representative cells from at least three experiments, with CCh added at the 2-min time point. The Ca2+ imaging data are based on n > 150 cells in each set. Statistical significance was assessed using Student’s t tests for two groups and presented as not significant (ns: P = 0.4) and significant (***P < 0.001). a.u.: arbitrary units.
Fig. 4.
Fig. 4.
Clustering of STIM2 in the ER–PM junctional region depends on IP3Rs. (A) Overlay of mV-STIM2 (S2, green) and IP3R1-mCherry (IP3R1, red; expressed in STIM2-KI cells) with an enlarged image of demarcated area and line scan (position indicated on the enlarged overlay image). (B) Overlay images of S2 (Top) and IP3R1-mCherry (IP3R1, Bottom) from 0-and 30-s time points and line scans (position indicated on the enlarged overlay image). (C) Same cell as in A and B stimulated with 1 μM CCh: overlay image of IP3R1 (red) and S2 (green) clusters and enlarged area (Right). Line scan (Below) shows positions of the two proteins in two clusters (indicated by arrows). (D) STIM2-KI cells showing S2 (Top) or cells with knockdown of all IP3R isoforms (Bottom). In each case, S2 fluorescence in unstimulated and 1 µM CCh-stimulated cells are shown. (E) Increase in S2 cluster (mean intensity [Top] and relative cluster number [Bottom] in control [black trace] and IP3Rs knockdown cells [red trace]). (F) STIM2-KI cells expressing mCherry-ER3 showing S2 (green) and mCherry-ER3 (ER, red) in control (Top) and siIP3Rs-treated (Bottom) without stimulation. (G) Wild-type HEK293 transfected with IP3R1 or IP3R1 + siE-Syts2/3. (H) Overlay images of S2 clusters in STIM2-KI cells alone or with si-Esyt2/3 or siIP3Rs treatment from 0- and 1-min time points (0/1m). Line scan shows overlapping peaks of both time points under basal condition. All TIRFM images show representative cells from at least three experiments. (Scale bars, 5 µm.) a.u.: arbitrary units.
Fig. 5.
Fig. 5.
STIM2 clustering is determined by IP3R function. (A) mV-STIM2 (S2) clusters before and after 5 µM FSK stimulation (Top). Overlay images of mV-STIM2 at 0- and 1-min (0/1m) and 3- and 4-min (3/4m) time points (Bottom). (B) Increase of mV-STIM2 mean fluorescence intensity (MI) and relative number (cluster #) (C) in response to FSK treatment (added at 1-min time point, dotted line). (D) HEK293 cells expressing TK-YFP-STIM2 (TK-S2) before and after stimulation with FSK. (E) IP3R-TKO cells (lack all three IP3R subtypes), treated with siE-Syts2/3 and expressing TK-S2, before and after stimulation with 5 µM FSK and 25 µM CPA. Bar graphs showing number (puncta #) and mean intensity of TK-S2 clusters in the three conditions shown in the images (n = 8). Statistical tests were done using ANOVA with the significance presented as not significant (ns: P > 0.05) and significant (*P < 0.05). (F) STIM2-KI cells expressing ER-LAR-GECO1: S2 (Top) and ER-LAR-GECO1 (Bottom) under basal (unstimulated) and stimulated with FSK (5 µM). Enlargements of the region marked by a square are shown for visible camparisions. (G) Bar graph shows change in relative MI at the 5-min time point compared to basal (time point 1 min). Data are from three experiments and n = 43 immobile clusters). (H) Line graphs showing whole cell intensity of ER- LAR-GECO1 in WT, STIM2-KI (S2KI), and IP3R-TKO cells, and S2 fluorescence only in S2KI expressing ER-LAR-GECO1. Addition of 5 µM FSK is indicated by the black arrows. All TIRFM images show representative cells from at least three experiments. (Scale bars, 5 µm.)
Fig. 6.
Fig. 6.
STIM2 clustering is determined by IP3R function. (A) HEK293 cells expressing TK-YFP-STIM2 (TK-S2): WT (black); IP3Rs-TKO (lack all three IP3R subtypes, red); IP3R-TKO cells stably expressing a pore-dead mutant of IP3R1 (IP3R-TKO/G2506R, magenta); IP3R-TKO cells expressing phosphorylation-deficient IP3R1 with S1589A and S1755A mutations (IP3R-TKO/Phos-mutants, brown); and IP3R-TKO cells stably expressing IP3R1 (IP3R-TKO + IP3R1, green), respectively, either unstimulated (basal) or consecutively stimulated with 5 µM FSK and 25 µM CPA. (B) Bar graphs show relative MI (Top) and relative number (Bottom) of TK-S2 clusters in basal condition for all cell types in A. (C) Time-dependent increases in relative MI of TK-S2 clusters calculated from cells shown in A. (D) Bar graphs show relative MI at the 5-min time point in C. (E) Bar graph showing relative size of TK-S2 clusters for the basal and FSK-treated cells in A. Basal values for all IP3R-TKO cells were compared to WT, while FSK values for WT and all IP3R-TKO cells were compared with their basal counterparts. (F) WT cells expressing TK-S2 showing clusters at basal (Left) and poststimulation with either 5 µM U73343 (inactive compound, Middle) and U73343 with 5 µM FSK (Right). Bottom set shows similar experiment done with the active PLC inhibitor, U73122 (5 µM). (G) Bar graphs showing relative MI at basal and after stimulation with compounds as indicated in F. (H) TK- S2 clusters in HEK293 cells under basal (Left), poststimulation with 5 µM H89 (Middle), and poststimulation with 5 µM FSK (Right). Treatment with FSK was either with a washout (wash) of H89 (Top) or without (Bottom). (I) Bar graphs showing relative MI at basal and after stimulation with compounds as indicated in H. Statistical tests were done using ANOVA with nonsignificant results presented ns: P > 0.05 and various levels of statistical significance as *P < 0.05, **P < 0.01, and &&&/***P < 0.001. All TIRFM images show representative cells from at least three experiments. (Scale bars, 5 µm.) (J) Fura-2 fluorescence measurements presented as F-F0 (mean ± SEM) of S2KI (control, black) and S2KI + siSTIM2 cells (red), S2KI + U73122 (blue), S2KI + H89 (green), treated with 1 mM CaCl (addition at 150s). (K) Bar graphs show change in F-F0 due to 1 mM Ca2+ entry (four independent experiments with n > 170 cells).
Fig. 7.
Fig. 7.
STIM2 N terminus senses local [Ca2+]ER decreases at subthreshold stimuli. HEK293 cells expressing (A) YFP-STIM2-STIM1N (STIM2 with STIM1 N terminus, S1N-S2C) or (B) YFP-STIM2 (control, S2-WT) in basal conditions (0- and 1-min time points individually and with overlay [0/1m]). Enlargement of demarcated region shown at Right and line scans (position shown in images). HEK293 cells expressing (C) YFP-STIM1-STIM2N (STIM1 with STIM2 N terminus, S2N-S1C) or (D) YFP-STIM1 (control, S1-WT) under basal conditions (0- and 1-min time points alone and with overlay [0/1m]). Enlargement of demarcated region shown in Right images and also line scans (position shown in images). All TIRFM images show representative cells from at least three experiments. (Scale bars, 5 µm.) a.u.: arbitrary units. (E) Proposed model: IP3R and STIM2 are localized in the ER–PM junctional region. Under ambient conditions (without agonist addition), constitutive PLC-dependent PIP2 hydrolysis as well as cAMP/PKA activity regulate IP3R activity. When STIM2 is in the vicinity of a functional IP3R, it senses the lower [Ca2+]ER (1), which leads to scaffolding to the plasma membrane and immobilization (2). Orai1 is then recruited to immobile STIM2 (3) and with further [Ca2+]ER decrease STIM1 is also recruited to immobile STIM2 (4). The model refers to cellular responses under ambient and low-intensity stimuli.

References

    1. Prakriya M., Lewis R. S., Store-operated calcium channels. Physiol. Rev. 95, 1383–1436 (2015). - PMC - PubMed
    1. Ong H. L., Subedi K. P., Son G. Y., Liu X., Ambudkar I. S., Tuning store-operated calcium entry to modulate Ca2+-dependent physiological processes. Biochim. Biophys. Acta Mol. Cell Res. 1866, 1037–1045 (2019). - PubMed
    1. Liou J., Fivaz M., Inoue T., Meyer T., Live-cell imaging reveals sequential oligomerization and local plasma membrane targeting of stromal interaction molecule 1 after Ca2+ store depletion. Proc. Natl. Acad. Sci. U.S.A. 104, 9301–9306 (2007). - PMC - PubMed
    1. Brandman O., Liou J., Park W. S., Meyer T., STIM2 is a feedback regulator that stabilizes basal cytosolic and endoplasmic reticulum Ca2+ levels. Cell 131, 1327–1339 (2007). - PMC - PubMed
    1. Liou J., et al. , STIM is a Ca2+ sensor essential for Ca2+-store-depletion-triggered Ca2+ influx. Curr. Biol. 15, 1235–1241 (2005). - PMC - PubMed

Publication types

MeSH terms

LinkOut - more resources