. 2022 Jan 12;5(4):e202101252.
doi: 10.26508/lsa.202101252. Print 2022 Apr.

Structural basis of Nrd1-Nab3 heterodimerization

Affiliations

Structural basis of Nrd1-Nab3 heterodimerization

Belén Chaves-Arquero et al. Life Sci Alliance. .

Abstract

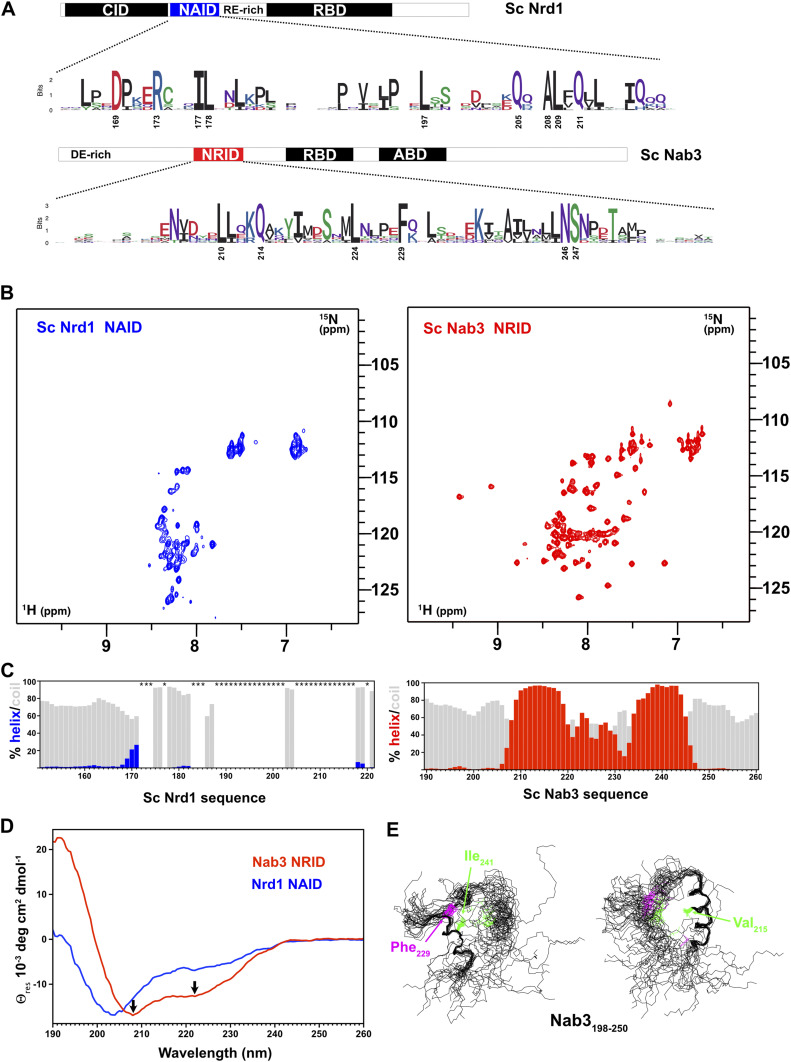
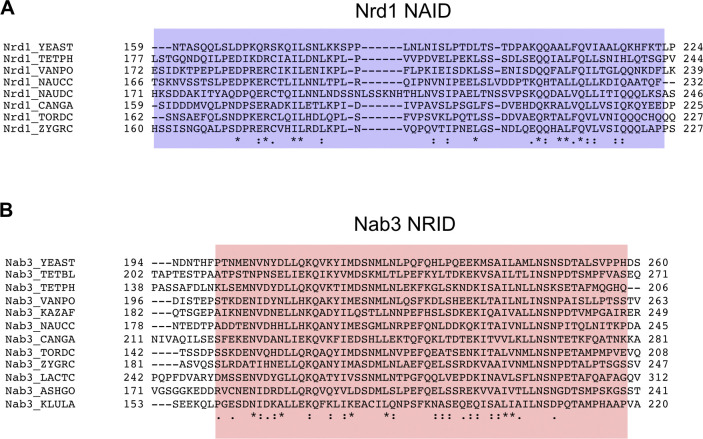
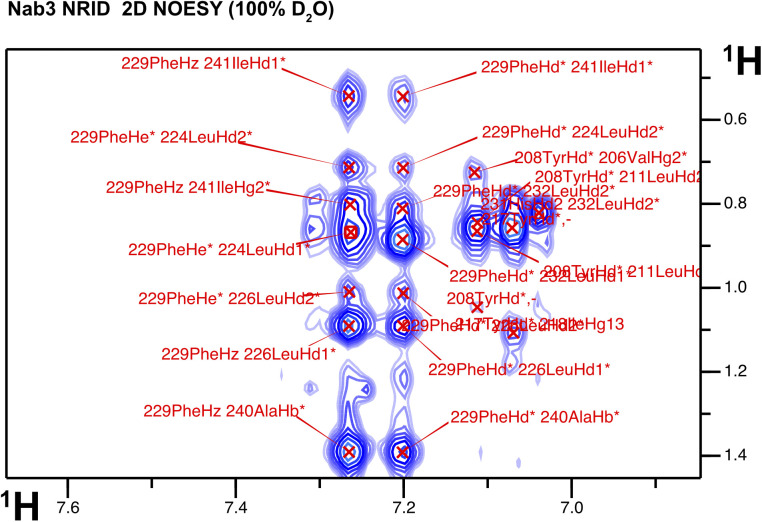
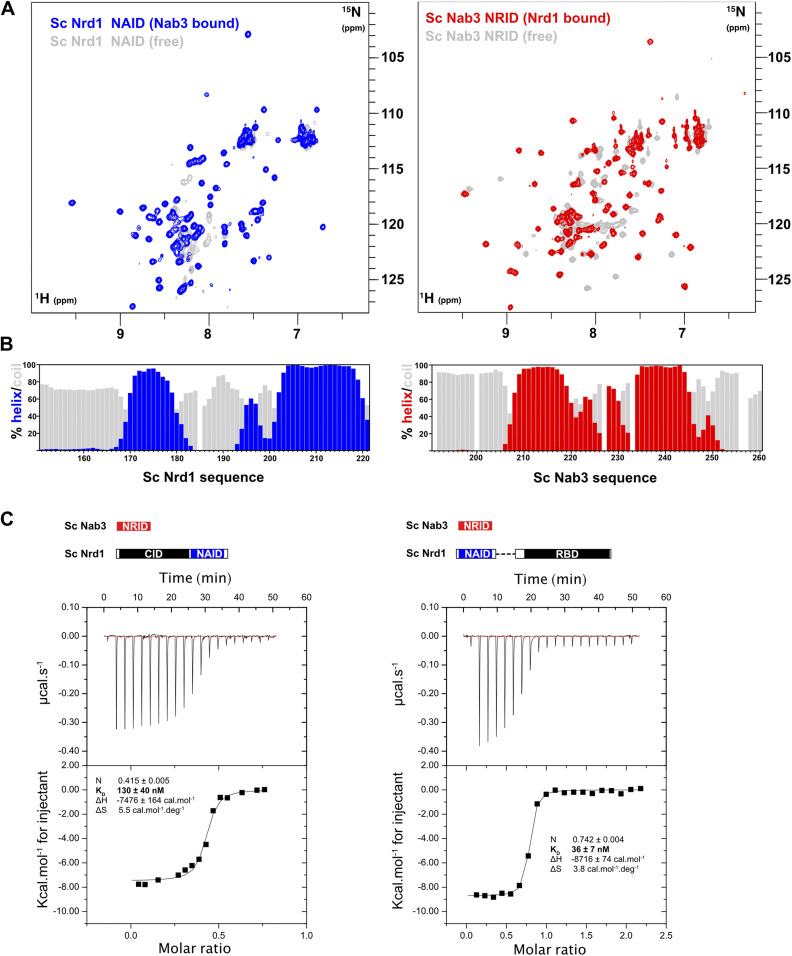
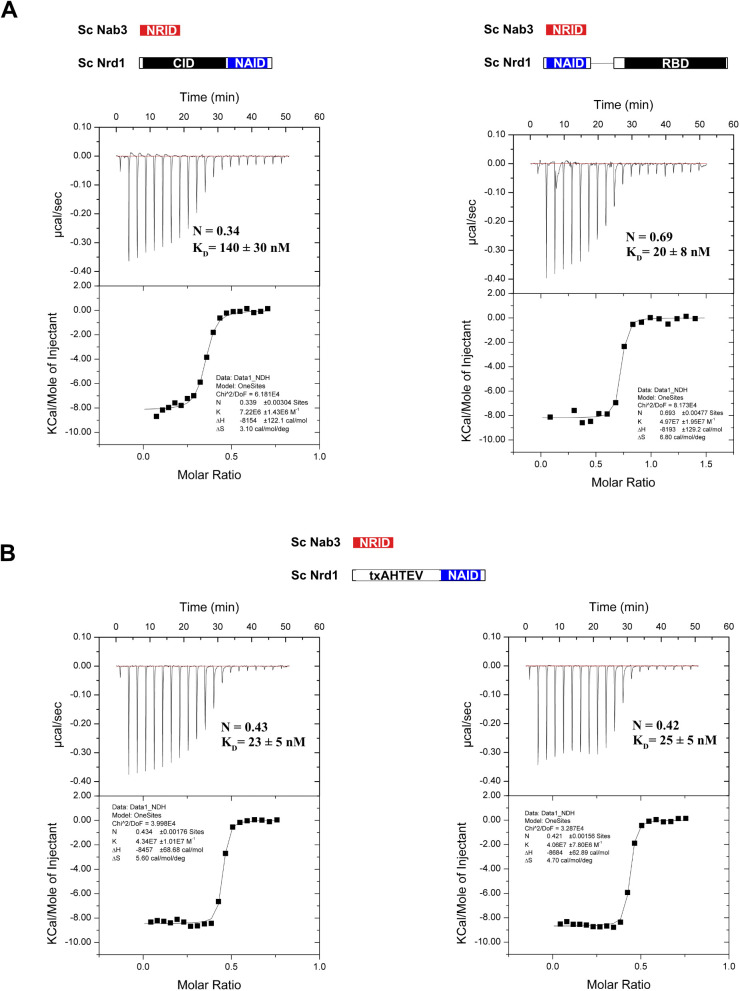
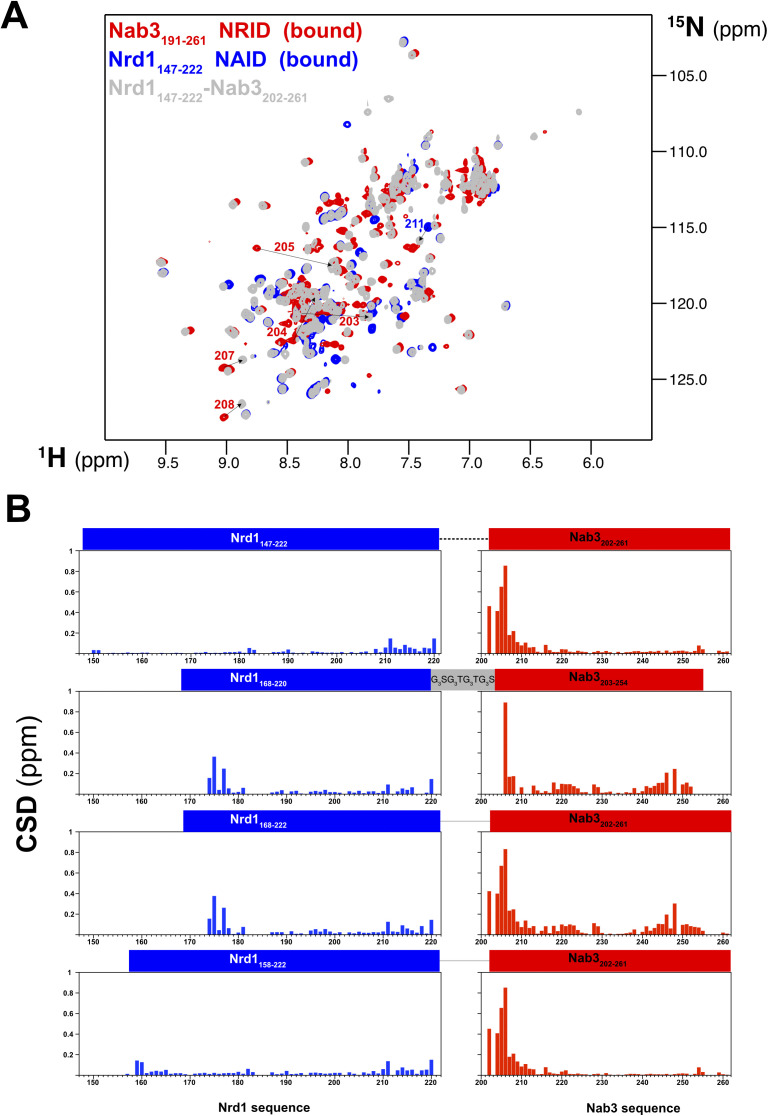
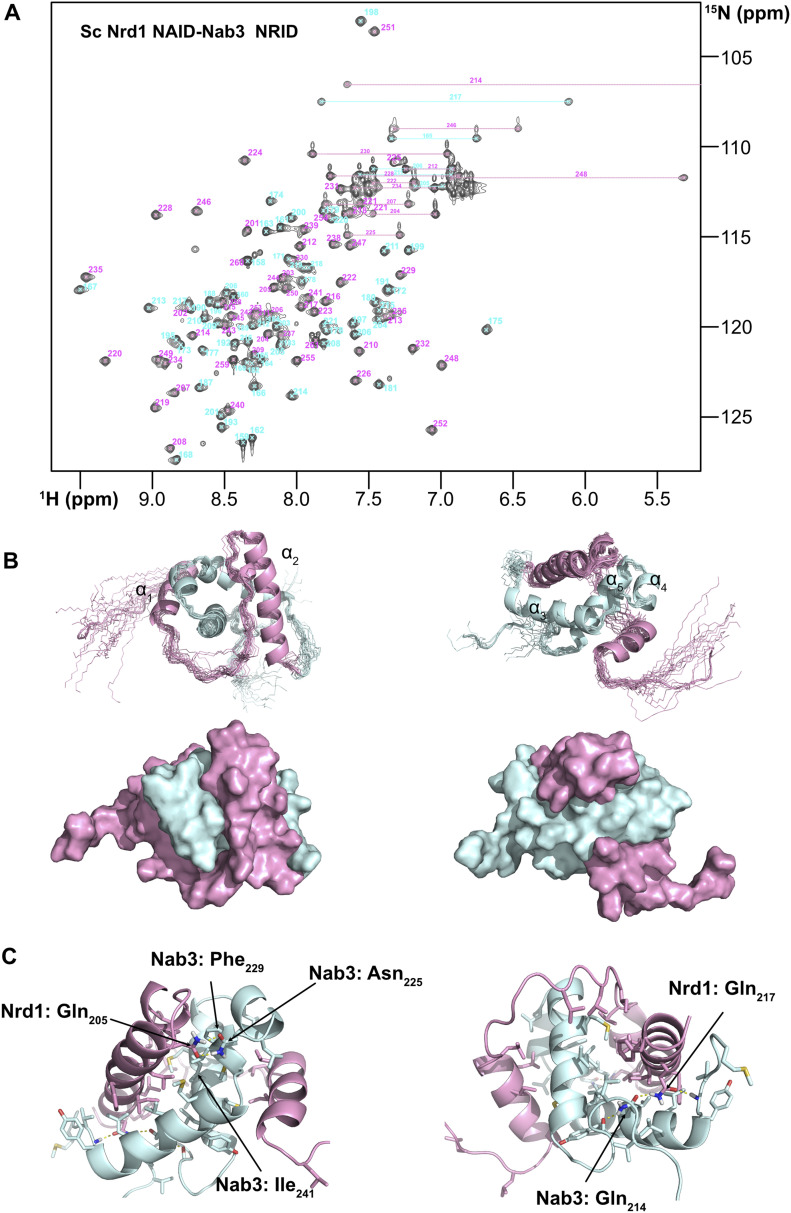
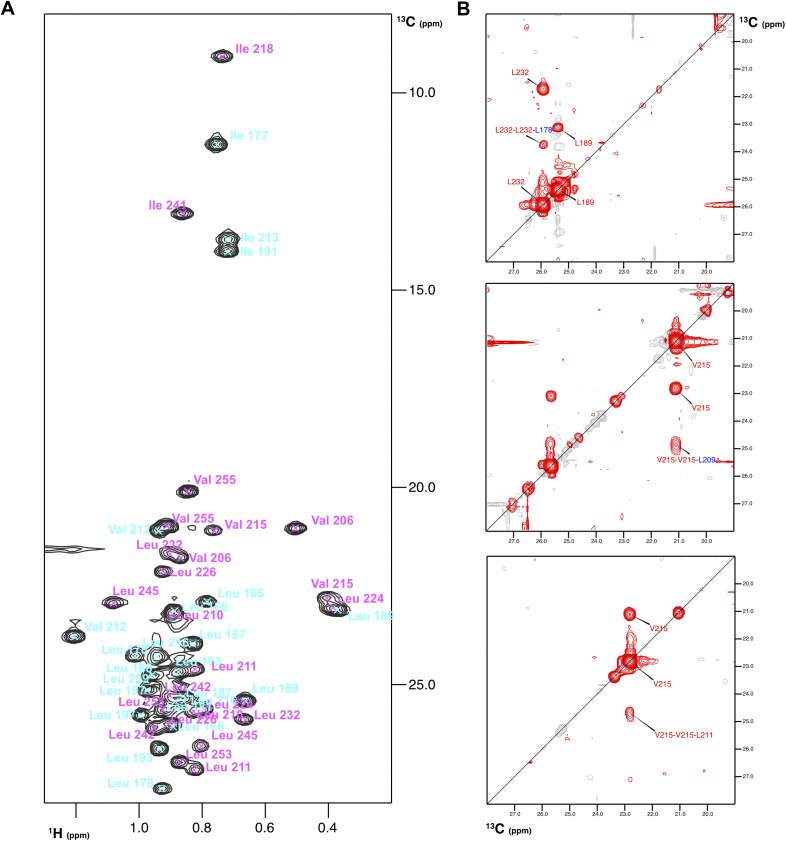
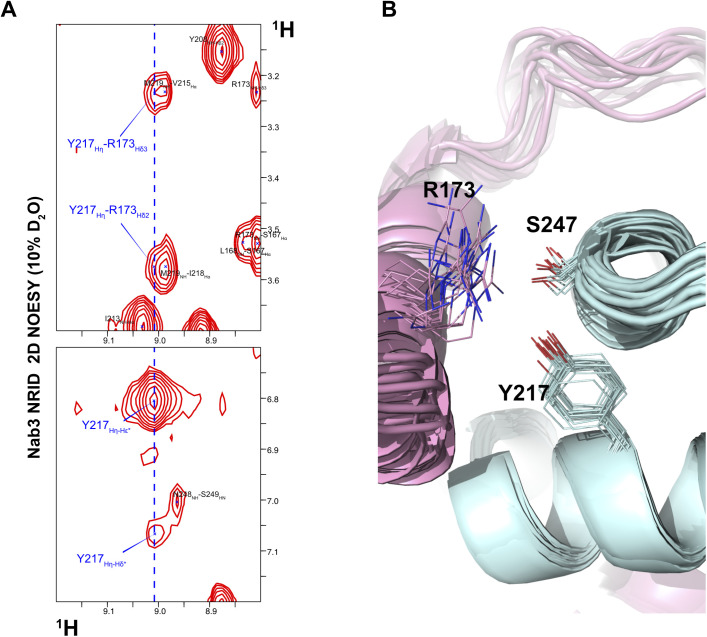
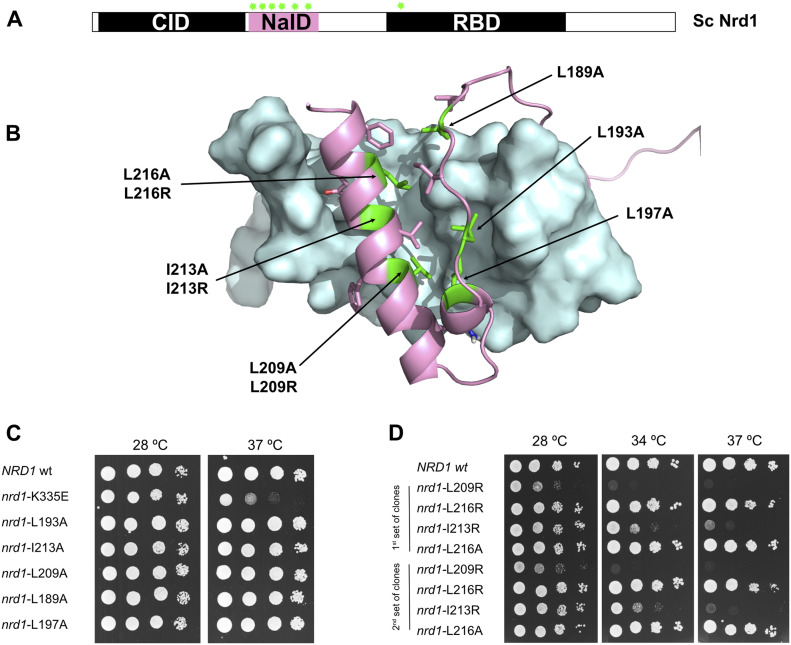
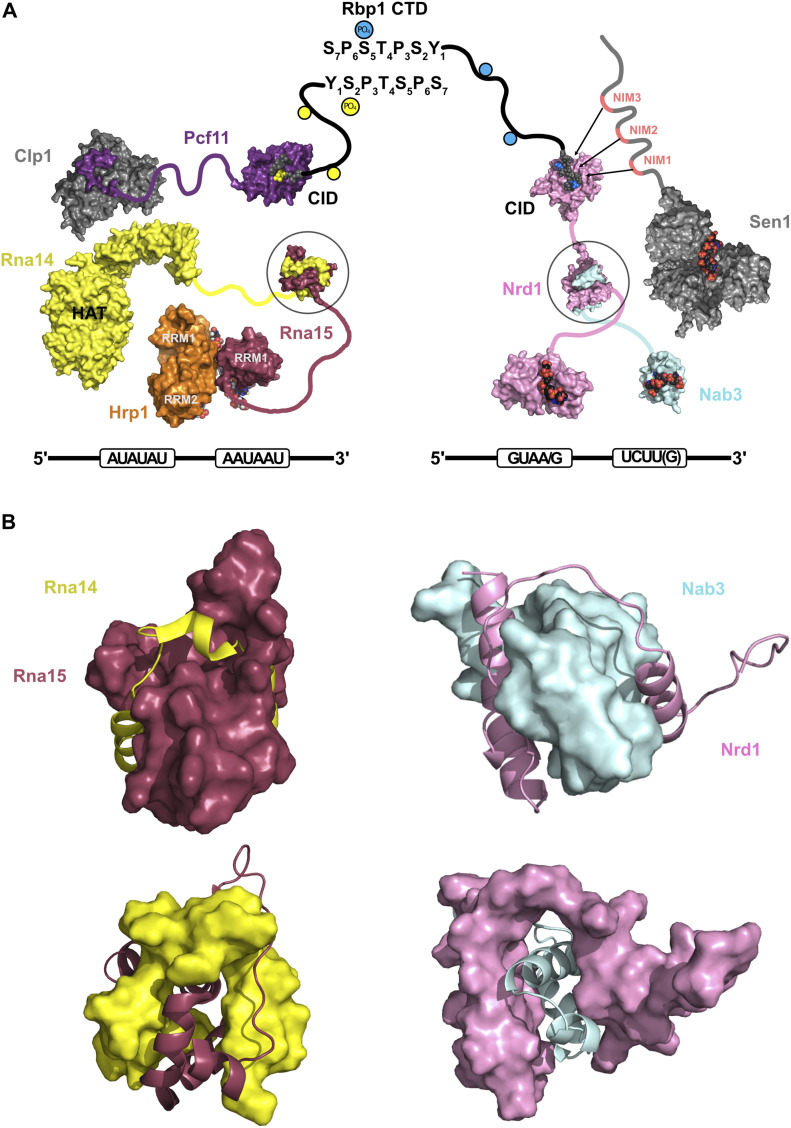
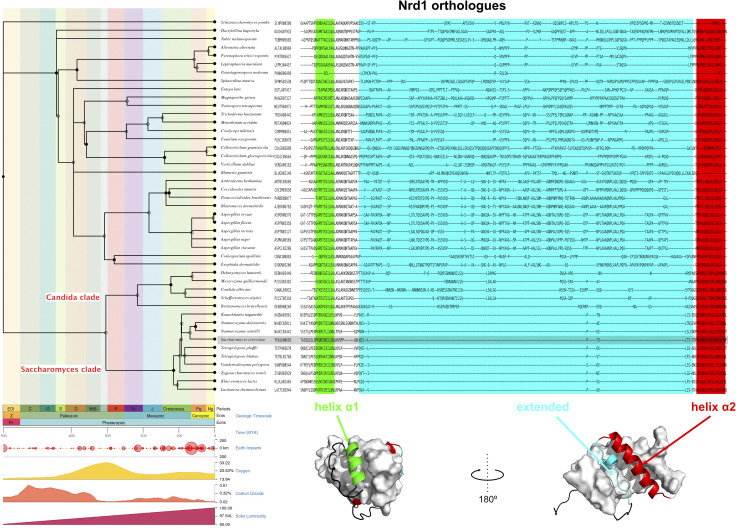
Heterodimerization of RNA binding proteins Nrd1 and Nab3 is essential to communicate the RNA recognition in the nascent transcript with the Nrd1 recognition of the Ser5-phosphorylated Rbp1 C-terminal domain in RNA polymerase II. The structure of a Nrd1-Nab3 chimera reveals the basis of heterodimerization, filling a missing gap in knowledge of this system. The free form of the Nrd1 interaction domain of Nab3 (NRID) forms a multi-state three-helix bundle that is clamped in a single conformation upon complex formation with the Nab3 interaction domain of Nrd1 (NAID). The latter domain forms two long helices that wrap around NRID, resulting in an extensive protein-protein interface that would explain the highly favorable free energy of heterodimerization. Mutagenesis of some conserved hydrophobic residues involved in the heterodimerization leads to temperature-sensitive phenotypes, revealing the importance of this interaction in yeast cell fitness. The Nrd1-Nab3 structure resembles the previously reported Rna14/Rna15 heterodimer structure, which is part of the poly(A)-dependent termination pathway, suggesting that both machineries use similar structural solutions despite they share little sequence homology and are potentially evolutionary divergent.


Conflict of interest statement

The authors declare that they have no conflict of interest.

Figures

Figure 1.
Figure 1.. Structural data for the isolated Nrd1 and Nab3 heterodimerization domains.
(A) Schematic representation of Nrd1 and Nab3 domain architecture with the heterodimerization domains NAID and NRID highlighted in blue and red, respectively. Sequence logos to represent the amino acid conservation of these domains have been produced from sequence alignments of Nrd1 and Nab3 orthologs of organisms of the Saccharomyces clade (full sequence alignments in Fig S1). Other domains/regions are displayed: CID (CTD interaction domain), RBD (RNA binding domain), ABD (tRNA anticodon binding domain), DE-rich (acidic region), and RE-rich (arginine/glutamic-rich region). (B) 1H-15N HSQC spectra of Nrd1 NAID (residues 147–222) (left panel in blue) and Nab3 NRID (residues 191–261) (right panel in red) in their isolated forms. (C) Percentage of secondary structure calculated from 13C/1H chemical shifts for Nrd1 NAID (left panel) and Nab3 NRID (right panel). The bar charts indicate the percentage of α-helix (blue/red bars) versus random coil (grey bars) calculated with the program d2D+ (Camilloni et al, 2012). Other types of secondary structures have been omitted because of their low calculated percentages. Nrd1 NAID residues with missing HQSC cross-peaks are indicated with stars. (D) Superposition of the circular dichroism spectra of Nrd1147-222 (in blue) and Nab3191-261 (in red). Black arrows mark the position of the two typical minima at 208 and 222 nm exhibited by α-helix structures. (E) Superpositions of the 20 lowest target function conformers calculated for Nab3 NRID (residues 198–250) (PDB code: 7PRE). Structures have been optimally superimposed considering only the N-terminal α-helix (residues 208–221) (right panel) or the C-terminal α-helix (residues 239–246) (left panel). The relative orientation of the two α-helices is loose and only minimally constrained by the interactions between side chains of residues Val215, Ile241, and Phe229 (labelled and colored in green, hydrophobics, and pink, aromatic).
Figure S1.
Figure S1.. Comparison between amino-acid sequences of heterodimerization domains of Nrd1 and Nab3 orthologs of Saccharomyces cerevisiae and close-related fungi.
(A, B) Sequence alignments of Nrd1 NAID (A) and Nab3 NRID (B) for yeast species to Saccharomyces clade: Tetrapisispora phaffii (TETPH), Tetrapisispora blattae (TETBL), Vanderwaltozyma polyspora (VANPO), Naumovozyma castellii (NAUCC), Naumovozyma dairenensis (NAUDC), Candida glabrata (CANGA), Torulaspora delbrueckii (TORDC), Zygosaccharomyces rouxii (ZYGRC), Kazachstania africana (KAZAF), Lachancea thermotolerans (LACTC), Ashbya gossypii (ASHGO), and Kluyveromyces lactis (KLULA). Protein database codes are as follows: Nrd1_YEAST (P53617), Nrd1_TETPH (G8BQ11), Nrd1_VANPO (A7TF47), Nrd1_ NAUCC (G0V5A0), Nrd1_NAUDC (G0WD58), Nrd1_CANGA (Q6FNZ7), Nrd1_TORDC (G8ZSI9), Nrd1_ZYGRC (C5DYV5), Nab3_YEAST (P38996), Nab3_TETBL (I2GYZ3), Nab3_TETPH (G8C176), Nab3_VANPO (A7TJ31), Nab3_KAZAF (H2B198), Nab3_NAUCC (G0VIS8), Nab3_CANGA (Q6FS59), Nab3_TORDC (G8ZYP4), Nab3_ZYGRC (C5DZZ2), Nab3_LACTC (C5E2G1), Nab3_ASHGO (Q754Y1), and Nab3_KLULA (Q6CML8).
Figure S2.
Figure S2.. Detailed view of the 2D NOESY of Nab3 NRID (residues 191–261) (in 100% D2O) showing the NOE cross-peaks of the aromatic protons of residue Phe229 with methyl groups.
Medium-range cross-peaks with Leu224 and Leu226 typical of α-helix structures are shown, together with long-range ones with Ile241 and Ala240.
Figure 2.
Figure 2.. Nuclear magnetic resonance (NMR) and thermodynamic analysis of Nrd1–Nab3 heterodimerization.
(A) Superposition of the 1H-15N-HSQC spectra of Nrd1 NAID (residues 147–222, left panel) in its free form (grey) and after addition of unlabelled Nab3 NRID (residues 191–261) (blue). Analogous NMR spectra comparison for 15N-labelled Nab3 NRID (right panel) showing the superposition of free (grey) and Nrd1 NAID-bound (red) NMR spectra. Unlabelled proteins were added in excess to ensure the saturation of the labelled ones. (B) Bar charts showing the per-residue population percentage of α-helix (blue/red) and random coil (grey bars) secondary structure for bound forms of Nrd1 NAID (left panel) and Nab3 NRID (right panel). (C) Isothermal titration calorimetry analysis of two different Nrd1–Nab3 interactions. The Nab3191-261 construct was titrated over two Nrd1 constructs (left: Nrd11–222 and right: Nrd1147-222/290-489) including the domains shown in the scheme. Thermograms (upper panels) and binding isotherms (lower panels) are shown for each titration, together with the equilibrium dissociation constant KD(1/KB), enthalpic (ΔH), and entropic contributions (ΔS), and stoichiometry (N) values calculated from data fitting to one-site binding model. Experiments were performed at 15°C.
Figure S3.
Figure S3.. Additional ITC experiments of Nrd1/Nab3 hetererodimerization.
(A) Replicas of the isothermal titration calorimetry experiments shown in Fig 2C. (B) Isothermal titration calorimetry experiments obtained by titrating Nab3 NRID (residues 191–261) over the protein construct txA-HTEV-Nrd1147-222 NAID. The N-terminal fusion protein contains the sequence of E. coli thioredoxin A followed by a 6xHis tag and a consensus TEV cleavage site.
Figure S4.
Figure S4.. NMR data comparison accross diferent Nrd1-Nab3 chimeras.
(A) Superposition of the 1H-15N HSQC spectra of the Nrd1147-222-Nab3202-261 chimera (grey peaks), Nrd1 NAID (blue) and Nab3 NRID (red) on their bound forms. The peaks showing the largest differences are marked and labelled. (B) Backbone amide chemical shift differences (CSD = (ΔδNH2 + ΔδN2/5)1/2) between Nrd1(blue bars)/Nab3(red bars) peaks in the heterodimer and in the different chimeric constructs tested during the optimization process. Outlines of the different constructs are represented above the graphs. Dashed lines (zero length) and grey box show connecting linkers between the two parts of chimeras.
Figure 3.
Figure 3.. Nuclear magnetic resonance structure of the Nrd1–Nab3 chimera.
(A) 1H-15N HSQC spectrum of the Nrd1158-222-Nab3202-261 chimera recorded at 800 MHz and 25°C. Cross-peaks assignments have been labelled according to the amino acid sequences of Nrd1 (in pink) and Nab3 (in cyan) fragments that compose the chimera. The horizontal lines mark the two cross-peaks of amide NH2 moieties in side chains of Gln and Asn residues. (B) Superposition of the 20 structural models calculated by nuclear magnetic resonance (statistics in Table S1) (upper panels) (PDB code: 7PRD). Two different orientations are shown. The Nrd1 in the chimera is colored in light pink and the Nab3 part in light cyan. Regular secondary structure elements are named consecutively (α-helices α1 to α5). Surface representations of the structure in the two selected orientations and with the same color code are shown below. (C) Structural details of the interaction between Nrd1 and Nab3 parts of the chimera. Only side chains of residues involved in heterodimeric contacts are shown. The interface is mainly formed by hydrophobic residues with the exception of Nrd1 Gln205 and Gln217 with Nab3 Gln214 and Asn225 that participate in two hydrogen bond networks (yellow dashed lines) that are buried inside the structure. The Nab3 Phe229-Ile241 contact, present in the free form (Fig 1E), is maintained in the Nrd1–Nab3 chimera. (B) Residues have been numbered according to the Nrd1 and Nab3 sequences and colored as in panel (B).
Figure S5.
Figure S5.. Nuclear magnetic resonance data obtained with selective 13C methyl labelling of Leu, Val, and Ile.
(A) 1H-13C HSQC spectrum with assignments. Methyl cross-peaks assignments have been color coded according to the protein segment they belong in the chimera: Nrd1 (in cyan) and Nab3 (in pink). (B) Selected 13C–13C planes of the 3D 1H-13C-HSQC-NOESY-1H-13C-HSQC spectrum showing various methyl–methyl NOEs.
Figure S6.
Figure S6.. Interactions between Nab3 Tyr217, Ser247 and Nrd1 Arg173.
(A). Selected region of the 2D NOESY showing the resonance Tyr217 Hη and NOEs with other Tyr217 ring protons and with side chain resonances of Arg173. (Β). Detailed view of the superposition of the 20-conformers of the Nrd1–Nab3 chimera, showing the side chains of Nab3 Tyr217, Ser247, and Nrd1 Arg173.
Figure 4.
Figure 4.. Functional analysis of Nrd1/Nab3 heterodimerization.
(A) Scheme representing the distribution of the analyzed mutants (indicated as green starts). Six positions in Nrd1 NAID domain were mutagenized (see specific details in the text). (B) The six mutagenized residues in Nrd1 NAID correspond to hydrophobic amino acids (Leu189, Leu193, Leu197, Leu209, Ile213, and Leu216) buried in the structure. These Leu or Ile side chains were replaced with Ala (conservative mutation) or Arg (disrupting mutation). (C, D). Analysis of the growth phenotypes of the nrd1 mutants and wild-type cells (wt.). The temperature-sensitive mutant nrd1-K335E, previously identified in the RNA-binding domain (Franco-Echevarría et al, 2017), is included as reference. Cultures were serially diluted (1/10), spotted on selective SC media plates and grown at the indicated temperatures for 2–3 d. (C) The first set of mutants (Leu/Ile to Ala) does not show differential behavior compared to wt. at the two tested temperatures. In comparison, the nrd1-K335E temperature-sensitive mutant shows the expected growth phenotype at 37°C (Franco-Echevarría et al, 2017). (D) Among the second set of mutants, including Leu/Ile to Arg mutations, nrd1-L209R and nrd1-I213R show strong growth defects, even lethality at 34°C and 37°C for nrd1-L209R mutant. Two clones of each mutant were tested.
Figure 5.
Figure 5.. Structural comparison between CFI and NNS complexes.
(A) The structural models depict the current knowledge about the organization and interactions within the Cleavage Factor I and Nab3–Nrd1–Sen1 complexes, that are involved in the two transcription termination pathways in yeast (see the Introduction section for details). On the right, termination of short transcripts is associated to Ser5 phosphorylation mark in RNA Pol II (blue dots in the schematic representation of Rpb1 CTD) that are recognized by Nrd1 CID (PDB: 2IO6 in pink and Rpb1 CTD in grey/blue [Ser5-P]). On the nascent transcript, Nrd1 (PDB: 5O1Y in pink) and Nab3 (PDB: 2L41 in cyan) RNA-binding domains recognize specific terminator sequences (black line and boxed RNA sequences below). The helicase Sen1 (PDB: 5MZN) also recognizes unspecific RNA sequences, and its intrinsically disordered region contains three Nrd1 interaction motifs (NIMs): NIM1, NIM2, and NIM3 (marked in red) that can interact with the CID, competing out the Rpb1 CTD and allowing the termination process to evolve to its final steps (Zhang et al, 2019; Han et al, 2020). On the left, CFI uses similar strategies. The CID of Pcf11 (PDB: 1SZA in purple) recognizes Ser2-P CTD-derived peptides (yellow dots and yellow atoms in the 1SZA structure), typical of long-elongated transcripts, whereas Hrp1 (orange) and Rna15 (maroon) (PDB: 2KM8) recognize the polyadenylation signal and enhancement elements. Clp1 (grey) recognizes a Pcf11 peptide (in purple) (PDB: 2NPI) and also interacts with other proteins of CFI (yet-unknown structures). The Rna14 HAT domains (yellow) interact with Hrp1 RRMs (Barnwal et al, 2012) and its Monkeytail domain forms a heterodimer with the C terminus or Rna15 (maroon) (PDB: 2L9B). This heterodimer has a similar structure as the Nrd1–Nab3 chimera (PDB: 7PRD this work). (B) Comparison between the structures of Rna14/Rna15 heterodimer and Nrd1–Nab3 chimera. In both cases, models have been represented as a surface/ribbon mixture for each of the components, and alternating between them in top and bottom figures (identical orientation for each structure). Rna14 Monkeytail domain (yellow) and Nab3 interacting domain in Nrd1 (pink) wrap around their partners in a similar way, creating large protein–protein interfaces. In the structures, Rna15 (maroon) and Nab3 (cyan) form compact helix bundles.
Figure S7.
Figure S7.. Evolutionary reconstruction of the Nrd1 NAID.
The sequences of 121 Nrd1 orthologues were obtained from (https://omabrowser.org/) (Altenhoff et al, 2020) and aligned using the full-length proteins. Higher levels of conservation are found on RNA-binding domain and CID domains. A subregion comprising the Saccharomyces cerevisiae Nrd1 NAID (residues 161–220) of the alignment was extracted and ranked according the phylogenetic tree on the left. The tree was obtained with http://www.timetree.org (Kumar et al, 2017). Only 45 of the original 121 Nrd1-like proteins (codes next to the species name) are represented, corresponding to those species with match in the TimeTree database. The phylogenetic tree includes a geologic timescale with a time line and other various indicators. The position of Saccharomyces cerevisiae Nrd1 is highlighted in grey and the branches corresponding to the Saccharomyces and its close Candida clades are labelled in the tree. Below the alignment, the structural elements of Nrd1 NAID have been colored in green (helix α1), cyan (extended segment contacting helix α2), and red (helix α2), with the Nab3 NRID representing the surface. The boundaries of these elements have been shadowed with the same color code over the alignment above.

References

    1. Allison LA, Moyle M, Shales M, Ingles CJ (1985) Extensive homology among the largest subunits of eukaryotic and prokaryotic RNA polymerases. Cell 42: 599–610. 10.1016/0092-8674(85)90117-5 - DOI - PubMed
    1. Altenhoff AM, Train CM, Gilbert KJ, Mediratta I, Mendes De Farias T, Moi D, Nevers Y, Radoykova HS, Rossier V, Warwick Vesztrocy A, et al. (2020) OMA orthology in 2021: Website overhaul, conserved isoforms, ancestral gene order and more. Nucleic Acids Res 49: 373–379. 10.1093/nar/gkaa1007 - DOI - PMC - PubMed
    1. Anthis NJ, Clore GM (2013) Sequence-specific determination of protein and peptide concentrations by absorbance at 205 nm. Protein Sci 22: 851–858. 10.1002/pro.2253 - DOI - PMC - PubMed
    1. Arndt KM, Reines D (2015) Termination of transcription of short noncoding RNAs by RNA polymerase II. Annu Rev Biochem 84: 381–404. 10.1146/annurev-biochem-060614-034457 - DOI - PMC - PubMed
    1. Barnwal RP, Lee SD, Moore C, Varani G (2012) Structural and biochemical analysis of the assembly and function of the yeast pre-mRNA 3’ end processing complex CF I. Proc Natl Acad Sci U S A 109: 21342–21347. 10.1073/pnas.1214102110 - DOI - PMC - PubMed

Publication types

MeSH terms

Substances