. 2022 Nov;71(11):2284-2299.
doi: 10.1136/gutjnl-2021-325272. Epub 2022 Jan 12.

Chemotherapy-induced infiltration of neutrophils promotes pancreatic cancer metastasis via Gas6/AXL signalling axis

Affiliations

Chemotherapy-induced infiltration of neutrophils promotes pancreatic cancer metastasis via Gas6/AXL signalling axis

Gaia Bellomo et al. Gut. 2022 Nov.

Abstract

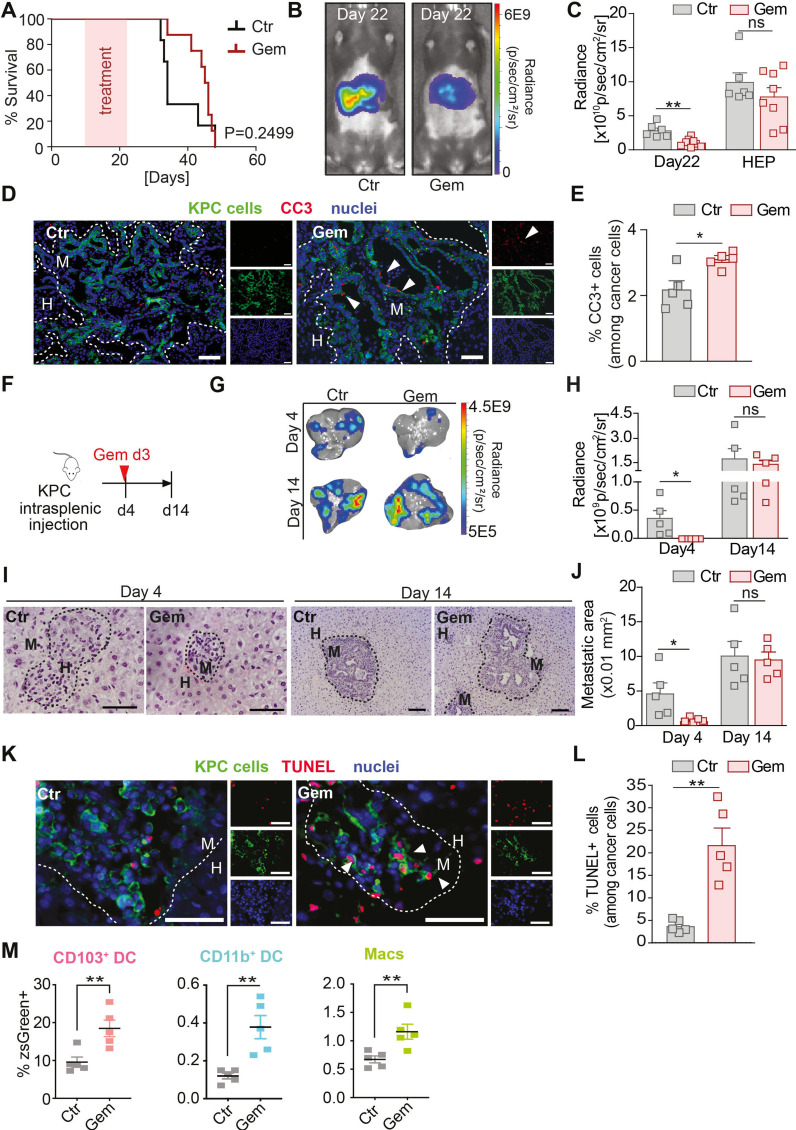
Objective: Pancreatic ductal adenocarcinoma (PDAC) is a highly metastatic disease and cytotoxic chemotherapy is the standard of care treatment for patients with advanced disease. Here, we investigate how the microenvironment in PDAC liver metastases reacts to chemotherapy and its role in metastatic disease progression post-treatment, an area which is poorly understood.

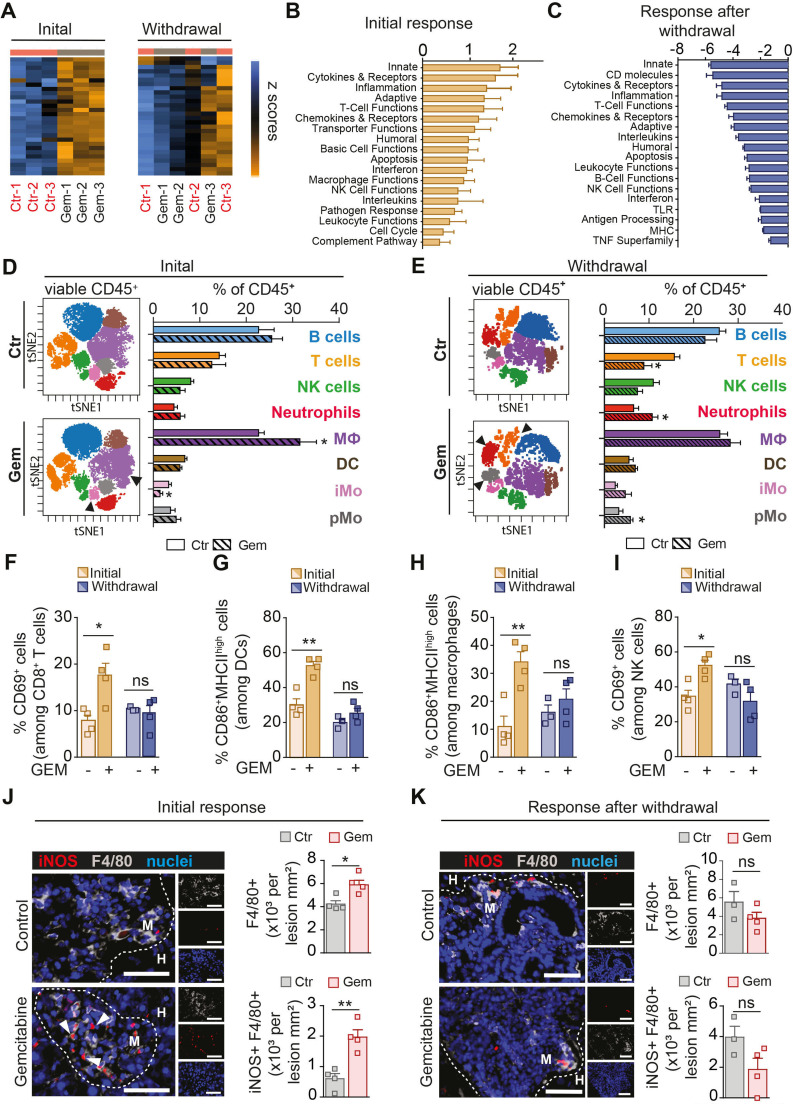
Design: The impact of chemotherapy on metastatic disease progression and immune cell infiltrates was characterised using flow and mass cytometry combined with transcriptional and histopathological analysis in experimental PDAC liver metastases mouse models. Findings were validated in patient derived liver metastases and in an autochthonous PDAC mouse model. Human and murine primary cell cocultures and ex vivo patient-derived liver explants were deployed to gain mechanistical insights on whether and how chemotherapy affects the metastatic tumour microenvironment.

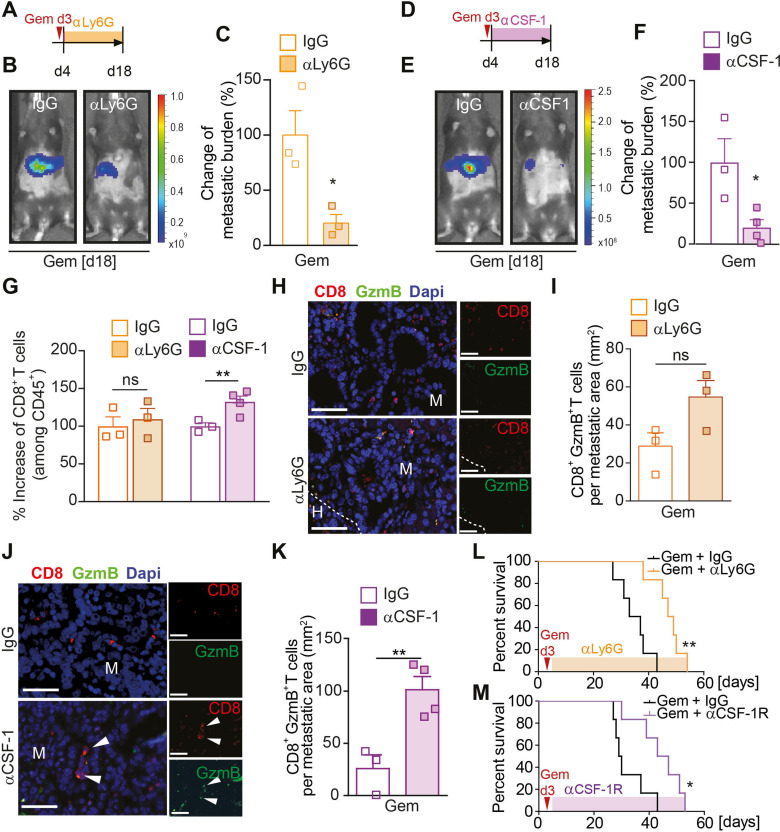
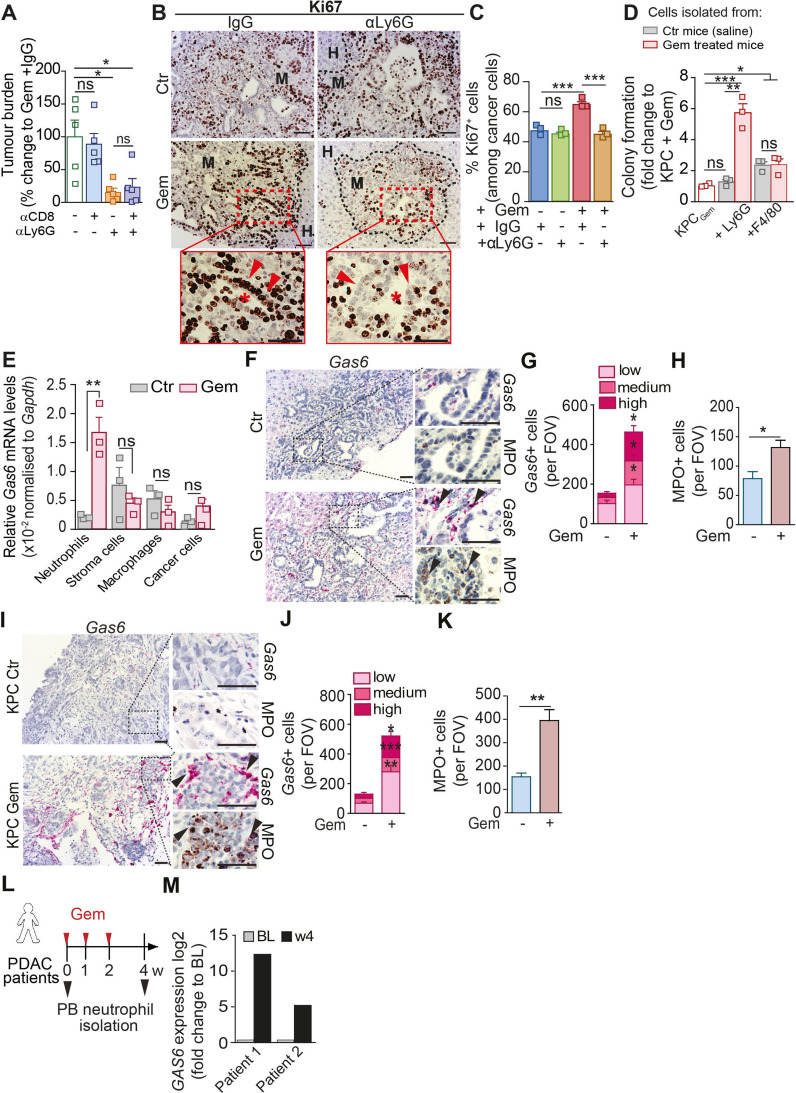
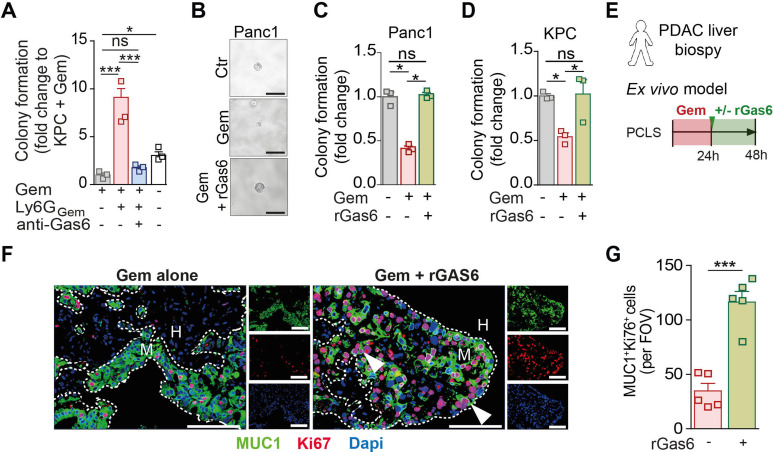
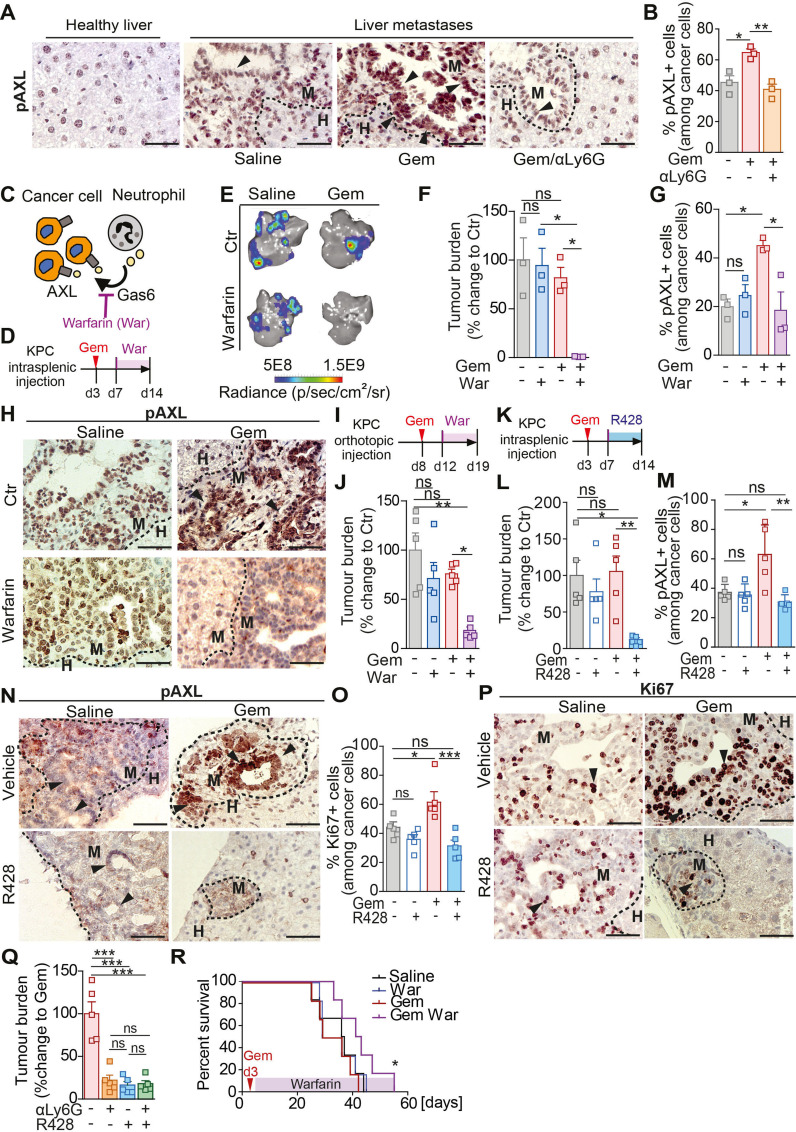
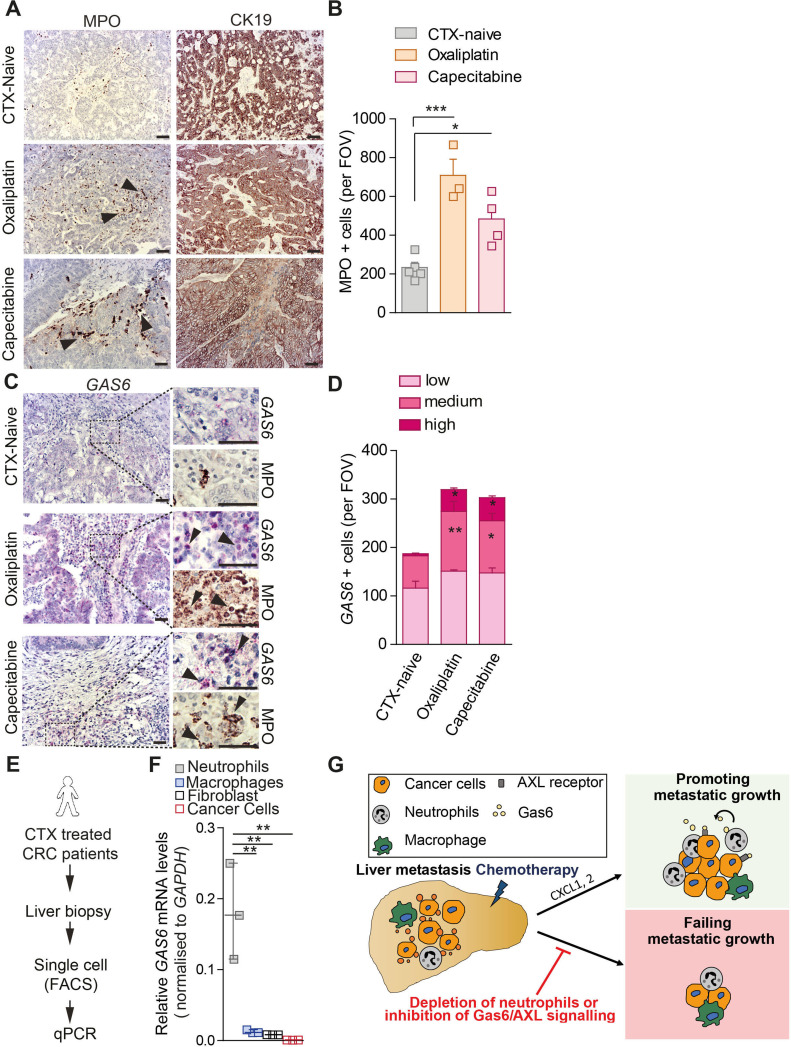
Results: We show that in vivo, chemotherapy induces an initial infiltration of proinflammatory macrophages into the liver and activates cytotoxic T cells, leading only to a temporary restraining of metastatic disease progression. However, after stopping treatment, neutrophils are recruited to the metastatic liver via CXCL1 and 2 secretion by metastatic tumour cells. These neutrophils express growth arrest specific 6 (Gas6) which leads to AXL receptor activation on tumour cells enabling their regrowth. Disruption of neutrophil infiltration or inhibition of the Gas6/AXL signalling axis in combination with chemotherapy inhibits metastatic growth. Chemotherapy increases Gas6 expression in circulating neutrophils from patients with metastatic pancreatic cancer and recombinant Gas6 is sufficient to promote tumour cell proliferation ex vivo, in patient-derived metastatic liver explants.

Conclusion: Combining chemotherapy with Gas6/AXL or neutrophil targeted therapy could provide a therapeutic benefit for patients with metastatic pancreatic cancer.

Keywords: immune response; liver metastases; macrophages; pancreatic cancer.


Conflict of interest statement

Competing interests: None declared.

Figures

Figure 1
Figure 1
Gemcitabine restrains metastatic progression during treatment, but disease relapses and overall survival remain unchanged when treatment is withdrawn. (A–E) Liver metastasis was induced by intrasplenic implantation of 1×10⁶ KPCluc/zsGreen cells. Starting day 12, animals were treated with gemcitabine (100 mg/kg) or control (vehicle) every 3 days with four doses in total. (A) Survival analysis of gemcitabine and control-treated mice-bearing liver metastasis; log-rank (Mantel-Cox) test, p=0.2499. Median survival for control was 22 days (n=6 mice) and gemcitabine 33.5 days (n=8 mice) after treatment initiation. (B) Representative images of bioluminescence imaging (BLI) taken 1 day after last treatment dose (day 22). (C) Tumour burden assessed by BLI in gemcitabine treated group (n=8 mice) compared with control group (n=6 mice) at day 22 and humane endpoint (HEP). (D, E) Representative immunofluorescent images (D) and quantification (E) of apoptotic KPCluc/zsGreen cells staining positive for cleaved caspase 3 (CC3) at day 22 (n=5 mice /group). White arrowheads indicate apoptotic (CC3+) cancer cells. (F–L) Liver metastasis was induced by intrasplenic implantation of 5×10⁵ KPCluc/zsGreen cells and animals received one dose of gemcitabine (100 mg/kg) or control (vehicle) at day 3 (F). (G, H) Representative BLI images of dissected livers (G) and change in tumour burden (H) (day 4: n=5 mice/group/time point). (I, J)Representative images of H&E-stained liver sections (I) and quantification (J). (K, L)Rrepresentative immunofluorescent images of apoptotic KPCluc/zsGreen cells staining positive for TUNEL at day 4 (n=5 mice/group) (K) and quantification (L).White arrowheads indicate apoptotic (TUNEL+) cancer cells. (M) uptake of apoptotic zsGreen-labelled KPC FC1199luc/zsGreen cancer cells by dendritic cells (DC) and macrophages (MACS) was evaluated 1 day after gemcitabine treatment. Frequency of zsGreen +cells among CD103+ DC, CD11b+ DC and MACS (n=5 mice/group). Scale bar 50 µM. Data are presented as mean±SEM. Unpaired t-test was used to calculate p values. *P<0.05; **p<0.01. H, healthy liver; M, metastases; n.s., not significant.
Figure 2
Figure 2
Gemcitabine administration induces a short-term activation of a proinflammatory immune response in metastatic pancreatic cancer. (A–K) Liver metastasis was induced by intrasplenic implantation of KPCluc/zsGreen cells and animals were treated with gemcitabine (100 mg/kg) or control (vehicle) at day 3. Metastatic livers were resected at initial response (day 4) and after withdrawal of treatment (day 14) for transcriptional, mass cytometry and tissue staining analysis. (A) Heatmap depicting hierarchical clustering of pathway scores (n=3 mice/group/time point). (B–C) Graph depicting top pathway scores observed in (B) metastatic livers of gemcitabine treated animals compared with control animals during initial response (day 4) and in (C) metastatic livers after gemcitabine withdrawal (day 14) compared with the initial response (day 4). (D, E) Coloured viSNE maps with each colour representing one immune cell population assessed by mass cytometry and quantification of main immune cell types among control (CTR) and gemcitabine (GEM) treated liver metastases at day 4 (A) and day 14 (B), respectively (CTR D4 n=4 mice, GEM D4 n=4 mice; CTR d14 n=3 mice; GEM d14 n=4 mice). (F–I) Quantification of metastasis infiltrating immune cells and their activation state by mass cytometry at initial treatment response (day 4) and after treatment withdrawal (day 14). (F)Cytotoxic CD8+ T cell activation (CD69+), (G) dendritic cell (DC) activation (CD86 +MHCIIhigh), (H) macrophage activation (CD86 +MHCIIhigh) and (I) natural killer (NK) cell activation (CD69+) (CTR D4 n=4 mice, GEM D4 n=4 mice; CTR d14 n=3 mice; GEM d14 n=4 mice). (J, K) Representative immunofluorescent images and quantification of iNOS+ and F4/80+ macrophages in liver tumours during initial response (n=4 mice/group) (D) and after gemcitabine withdrawal (E) (n=3 mice in CTR group; n=4 mice in GEM group). White arrowheads indicate iNOS+ macrophages. Scale bar 50 µM; M=metastases, H=healthy liver. Data are presented as mean±SEM. *P<0.05; **p<0.01; n.s., not significant, by unpaired t-test. For multiple comparisons (D, E), one-way ANOVA coupled with Dunnett’s post hoc testing was performed. ANOVA; analysis of variance.
Figure 3
Figure 3
Macrophage depletion increases CD8+ T cell infiltration, but neutrophil depletion has no effect on CD8+ T cell numbers. (A–M) Liver metastasis was induced by intrasplenic implantation of KPCluc/zsGreen cells and animals were treated with gemcitabine (100 mg/kg) or control (vehicle) at day 3. (A–C, G–I) At day 4, mice were treated with IgG control (CTR) or αLy6G antibody. Schematic illustrating experiment (A). Change in tumour burden was quantified by in vivo BLI (n=3 mice/group). Representative images (B) and quantification (C). (D–G, J, K) At day 4, mice were treated with IgG control (CTR) or αCSF-1 antibody. Schematic illustrating experiment (D). Change in tumour burden was quantified by in vivo BLI (CTR n=3 mice; αCSF-1 n=4 mice). Representative images (E) and quantification (F). (G) Change in CD8+ T cell infiltration into metastatic lesions was quantified by flow cytometry analysis in mice treated with αLy6G or αCSF-1 or their corresponding IgG controls. (H, I) Representative immunofluorescent images of CD8+GranzymeB+ T cell staining of liver sections from mice treated with IgG or αLy6G (H) and quantification (I) of CD8+GranzymeB+ T cells (GranzymeB=GzmB). (J, K) Representative immunofluorescent images of CD8+GranzymeB+ T cell staining of liver sections from mice treated with IgG or αCSF-1 (J) and quantification (K) of CD8+GranzymeB+ T cells. White arrowheads indicate CD8+GranzymeB+ T cells. (L) Liver metastasis was induced by intrasplenic implantation of 1×10⁶ KPCluc/zsGreen cells. At day 3, all animals were treated with gemcitabine (100 mg/kg). At day 4, mice were treated with IgG control (CTR) or αLy6G antibody. survival analysis of gemcitabine + IgG and gemcitabine + αLy6G antibody-treated mice-bearing liver metastasis; log-rank (Mantel-Cox) test, p=0.0022. Median survival for gemcitabine + IgG was 35 days (n=6 mice) and gemcitabine + αLy6G 48 days (n=6 mice). (M) same as (L), but at day 4, mice were treated with IgG control (CTR) or αCSF-1R antibody. Survival analysis of gemcitabine + IgG and gemcitabine + αCSF-1R antibody-treated mice-bearing liver metastasis; log-rank (Mantel-Cox) test, p=0.0168. Median survival for gemcitabine + IgG was 29.5 days (n=6 mice) and gemcitabine + αCSF-1R 45 days (n=6 mice). Scale bar 50 µM. Data are presented as mean±SEM. Unpaired t-test was used to calculate p values. *P<0.05; **p<0.01. H, healthy liver; M, metastases; n.s., not significant.
Figure 4
Figure 4
Neutrophils promote cancer cells proliferation and Gas6 is highly expressed by metastatic associated neutrophils after gemcitabine treatment. (A) Liver metastasis was induced by intrasplenic implantation of KPCluc/zsGreen cells and animals were treated with gemcitabine (GEM; 100 mg/kg) at day 3. At day 4, mice were treated with αLy6G or IgG controls for 2 weeks; at day 7, mice were treated with αCD8 or IgG controls until end point (day 14). Change in tumour burden was quantified by ex vivo bioluminescence imaging (BLI) (n=5 mice/group). (B–C) Liver metastasis was induced by intrasplenic implantation of KPCluc/zsGreen cells. Mice were treated with gemcitabine or saline 3 days postcell implantation. Treatment with αLy6G or control IgG started at D4 (n=4 mice/group). Livers were resected after 14 days and assessed by Ki67 staining (proliferation marker). Representative IHC images (B) and quantification of proliferating Ki67+ tumour cell frequency in metastatic livers (C). Inset: asterisks indicate ductal structures formed by metastatic tumour cells (red arrow head). (D)Colony formation assay of gemcitabine stressed KPC cells in the presence or absence of metastasis infiltrating neutrophils (+Ly6G) or macrophages (+F4/80) isolated from tumour-bearing livers of mice at day 14 after treatment with GEM or saline treated (CTR). Bar graph shows fold upregulation of BLI signal compared with Gem-treated KPC cells alone (red shaded) (three independent experiments; mean±SEM). (E) Quantification of Gas6 mRNA levels by real time PCR in intrametastatic pancreatic cancer cells, neutrophils (Ly6G), macrophages (F4/80) and non-immune stromal cells (zsGreennegCD45neg), isolated by fluorescence activated cell sorting from established metastatic livers at day 14 after treatment with GEM or untreated (CTR). Bar graph shows relative expression of Gas6 in cells derived from GEM-treated mice and untreated mice (data are from three independent experiments; mean±SEM). (F–H) Representative images (F) of myeloperoxidase (MPO) and Gas6 staining using RNAscope in serial sections from metastatic livers derived from untreated (CTR) or GEM treated mice (n=3 mice/group). Arrowheads indicate Gas6+ staining in neutrophil-rich areas. Scoring of Gas6 signal per field of view (G) and MPO staining quantification (H). (I–K) Metastatic tumours in livers of the spontaneous mouse pancreatic cancer model KrasG12D;Trp53R172H;Pdx1-Cre (KPC mice) treated with Gemcitabine (KPC Gem) or left untreated (KPC Ctr) were isolated and analysed (n=3 mice/group). Representative images (I) of MPO and Gas6 staining using RNAscope in serial sections from metastatic tissue sections. Arrowheads indicate Gas6+ staining in neutrophil-rich areas. (J) Scoring of Gas6 signal per field of view and (K) MPO staining quantification. (L, M) Peripheral blood neutrophils were isolated from metastatic PDAC patients during their first cycle of gemcitabine treatment and GAS6 mRNA levels were assessed by real time PCR. Schematic illustration of treatment regimen and patient blood sample collection (L). Quantification of data (M) (BL=baseline, prior treatment) (n=2 patients). Scale bar=50 µM. Data are presented as mean±SEM. Unpaired t-test or ANOVA with Bonferroni was used to calculate p values. *P<0.05; **p<0.01; ***p<0.001. ANOVA; analysis of variance; H, healthy liver; IHC, immunohistochemistry; M, metastases; n.s., not significant; PDAC, pancreatic ductal adenocarcinoma.
Figure 5
Figure 5
Gas6 is necessary for neutrophil-mediated cancer cell regrowth after gemcitabine treatment. (A) Quantification of colony formation assay of gemcitabine treated KPCluc/zsGreen cells in the presence or absence of Gas6 neutralising antibody (anti-Gas6) with or without metastasis infiltrating neutrophils (Ly6GGem) isolated from mice treated with gemcitabine. Bar graph shows fold upregulation of bioluminescence imaging (BLI) signal compared with gemcitabine-treated KPCluc/zsGreen cells alone (three independent experiments; mean±SEM). (B–D) Colony formation assay of gemcitabine-treated human Panc1 and murine KPCluc/zsGreen cells in the presence or absence or recombinant Gas6 (rGas6). (B) Representative images of Panc1 colonies. (C) Quantification of colony numbers (fold change compared with untreated Panc1 cells) (three independent experiment; mean±SEM). (D) Quantification of BLI signal from KPCluc/zsGreen colonies (fold change compared with untreated KPC cells) (three independent experiments; mean±SEM). (E–G) Schematic illustration of experiment (E): Human precision cut liver slices (hPCLSs) were initially treated with gemcitabine for 24 hours then cultured in the presence or absence of rGas6 for the following 24 hours. hPCLSs were assessed by MUC1 (cancer cell marker) and Ki67 immunofluorescent staining (proliferation marker). (F) Representative if images and (G) quantification of proliferating Ki67+ tumour cell frequency in ex vivo treated hPCLS (n=5 patient biopsies). Arrowheads indicate Ki67+ cancer cells. Scale bar 50 µM. data are presented as mean±SEM. Unpaired t-test or ANOVA with Bonferroni was used to calculate p values. *P<0.05; **p<0.01; ***p<0.001. ANOVA, analysis of variance; H, healthy liver; M, metastases; n.s., not significant.
Figure 6
Figure 6
Blockade of the Gas6/Axl signalling pathway via warfarin inhibits metastatic relapse after gemcitabine treatment. (A–B) Representative images of pAXL staining in liver tissue sections derived from naïve mice or metastasis bearing mice treated with saline (control) or treated with gemcitabine alone (GEM) or GEM + αLy6G (A). Quantification of pAXL+ tumour cell frequency (B) (n=3 mice/group). (C) Schematic illustrating Gas6/Axl blockade via warfarin. (D–H) Liver metastasis was induced by intrasplenic implantation of KPCluc/zsGreen cells. At day 3, mice were treated with gemcitabine (GEM) or saline control (saline), at day 7 mice were treated with warfarin (war) or left untreated (CTR). (D) Schematic illustration of the experiment. (E, F) Representative images of BLI signal detected in tumour-bearing livers ex vivo (E) and quantification of tumour burden by ex vivo bioluminescence imaging (BLI) (F) (n=3 mice/group). (G, H) Quantification of pAXL+ tumour cell frequency (G) and representative images of pAXL staining of metastatic tumour lesions (H). Arrowheads indicate metastatic cancer cells staining positive for pAXL (n=3 mice/group). (I, J) Primary tumour burden was induced by orthotopic implantation of KPCluc/zsGreen cells into the pancreas. At day 8, cohorts were treated with GEM or saline control. Treatment with warfarin started at day 12. Livers were resected at day 19 and assessed for metastatic tumour burden (n=5 mice/group). (I) Schematic illustration of the experiment. (J) Quantification of tumour burden by ex vivo BLI (n=5 mice/group). (K–P) Liver metastasis was induced by intrasplenic implantation of KPCluc/zsGreen cells. At day 3, mice were treated with GEM or saline, at day 7 mice were treated with R428 or control vehicle. (K) Schematic illustration of experiment. (L)Change in tumour burden was quantified by ex vivo BLI (n=4 mice/group). (M, N) Quantification of pAXL+ tumour cell frequency (M) and representative images (N). (O, P) Quantification of Ki67+ tumour cell frequency (O) and representative images (P). Arrowheads indicate metastatic cancer cells staining positive for pAXL (N) or Ki67 (P). (Q) Liver metastasis was induced by intrasplenic implantation of KPCluc/zsGreen cells. At day 3, mice were treated with GEM, at day 4, mice were treated with αLy6G, at day 7 mice were treated with R428 or control vehicle until end point (day 14). Quantification of tumour burden by ex vivo BLI imaging (n=5 mice/group). (R) Liver metastasis was induced by intrasplenic implantation of 1×10⁶ KPCluc/zsGreen cells. At day 3, animals were treated with GEM or saline control (saline). From day 7, mice were treated with warfarin or left untreated. Survival analysis of gemcitabine, gemcitabine/warfarin, warfarin and saline treated mice-bearing liver metastasis; log-rank (Mantel-Cox) test, p=0.0456 (GEM vs Gem/War). Median survival for saline was 36.5 days (n=6 mice), for warfarin 32.5 days (n=6 mice), gemcitabine 32.5 days (n=6 mice) and gemcitabine/warfarin 42 days (n=6 mice). Scale bar 50 µM. Data are presented as mean±SEM. Unpaired t-test or ANOVA with Bonferroni was used to calculate p values. *P<0.05; **p<0.01; ***p<0.001. ANOVA; analysis of variance; H, healthy liver; M, metastases; n.s., not significant.
Figure 7
Figure 7
Chemotherapy treatment upregulates the expression of the neutrophil chemo-attractants CXCL1 and 2 in disseminated tumour cells. (A) Heatmap depicting Cxcl1, 2, 5, 8 mRNA expression levels assessed by real time PCR in KPC (murine) and PANC-1 (human) pancreatic cancer cell lines untreated (CTR) and gemcitabine treated (GEM) (three independent experiments; mean±SEM). (B–D) Liver metastasis was induced by intrasplenic implantation of KPC cells. Cohorts were treated at day three with saline (CTR) or GEM (n=3 mice/group). Cancer cells, macrophages and neutrophils were isolated from metastatic lesions at day 14 by FACS. (B) Quantification of Cxcl1 and 2 mRNA levels by real time PCR in disseminated KPC cancer cells and macrophages (three independent experiments; mean±SEM). (C) Heatmap depicting gene expression analysis of CXCR family receptors (Cxcr1,2, 3, 4) by metastasis infiltrating neutrophils. (D) Quantification of CXCR2 expression levels by flow cytometry on neutrophils isolated from tumour-free livers (naïve) and liver metastases derived from saline (CTR) or gemcitabine (GEM) treated mice (n=3 mice/group). (E, F) Quantification of murine (E) and human (F) neutrophil migration in the presence and absence of CXCR2 inhibitor SB225002 (iCXCR2) towards tumour conditioned media (TCM) generated from pancreatic cancer cells (KPC and Panc1, respectively) exposed to gemcitabine (TCMGem) or control (TCMCtr) (three independent experiments; mean±SEM). (G–I) Liver metastasis was induced by intrasplenic implantation of KPC cells. Cohorts were treated at day three with GEM or saline (CTR). From day 4 mice were treated with SB225002 (iCXCR2) until endpoint (day 14). (H) Quantification of tumour burden by ex vivo BLI (n=5 mice/group). (I) Flow cytometry quantification of neutrophil frequency in metastatic livers at endpoint. Data are presented as mean±SEM. Unpaired t-test or ANOVA with Bonferroni was used to calculate p values. *P<0.05; **p<0.01; ***p<0.001; ANOVA, analysis of variance; n.s., not significant.
Figure 8
Figure 8
Chemotherapy treatment induces accumulation of Gas6 expressing neutrophils in liver metastases of patients with stage IV colorectal cancer. (A–D) Tissue sections from metastatic livers derived from treatment naïve patients with stage IV colorectal cancer (CRC) (n=5), and patients undergone treatment with oxaliplatin (n=3) or capecitabine (n=4) were stained for cancer cells (CK19), neutrophils (MPO) and GAS6. (A, B) Representative images of CK19 and MPO staining of serial sections (A) and quantification of data (B). (C, D) Representative images of GAS6 and MPO staining of serial sections (C) and quantification of data (D). Arrowheads indicate GAS6+ staining in neutrophil-rich areas. (E, F) Liver biopsies were collected from metastatic CRC patients post-FOLFOX treatment. Cell populations were isolate by FACS for gene expression analysis. (G) Schematic illustration of experiment and (H) quantification of GAS6 mRNA levels by real-time PCR in neutrophils, macrophages, fibroblast and cancer cells (n=3 patient samples). (G) Schematic depicting the role of neutrophil-derived Gas6 in hepatic metastatic tumour regrowth after chemotherapy in pancreatic cancer. Chemotherapy induces the expression of the neutrophil-chemoattractants CXCL1 and 2 by disseminated cancer cells. On treatment withdrawal, neutrophils are recruited to the liver and express high levels of Gas6. Neutrophil-derived Gas6 activates AXL receptors on disseminated cancer cells and promotes their regrowth after chemotherapeutic treatments. Depletion of neutrophils or inhibition of Gas6/AXL signalling axis inhibits metastatic regrowth of pancreatic cancer cells. Scale bar 50 µM. Data are presented as mean±SEM. Unpaired t-test or ANOVA with Bonferroni was used to calculate p values. *P<0.05; **p<0.01; ***p<0.001. ANOVA, analysis of variance; H, healthy liver; M, metastases; n.s., not significant.

References

    1. Rhim AD, Mirek ET, Aiello NM, et al. . EMT and dissemination precede pancreatic tumor formation. Cell 2012;148:349–61. 10.1016/j.cell.2011.11.025 - DOI - PMC - PubMed
    1. Ryan DP, Hong TS, Bardeesy N. Pancreatic adenocarcinoma. N Engl J Med 2014;371:1039–49. 10.1056/NEJMra1404198 - DOI - PubMed
    1. Nielsen SR, Quaranta V, Linford A, et al. . Macrophage-secreted granulin supports pancreatic cancer metastasis by inducing liver fibrosis. Nat Cell Biol 2016;18:549–60. 10.1038/ncb3340 - DOI - PMC - PubMed
    1. Costa-Silva B, Aiello NM, Ocean AJ, et al. . Pancreatic cancer exosomes initiate pre-metastatic niche formation in the liver. Nat Cell Biol 2015;17:816–26. 10.1038/ncb3169 - DOI - PMC - PubMed
    1. Aiello NM, Bajor DL, Norgard RJ, et al. . Metastatic progression is associated with dynamic changes in the local microenvironment. Nat Commun 2016;7:12819. 10.1038/ncomms12819 - DOI - PMC - PubMed

Publication types

MeSH terms

Substances