. 2022 Feb 1;208(3):672-684.
doi: 10.4049/jimmunol.2001453. Epub 2022 Jan 12.

Hepatitis B and Hepatitis C Virus Infection Promote Liver Fibrogenesis through a TGF-β1-Induced OCT4/Nanog Pathway

Affiliations

Hepatitis B and Hepatitis C Virus Infection Promote Liver Fibrogenesis through a TGF-β1-Induced OCT4/Nanog Pathway

Wenting Li et al. J Immunol. .

Abstract

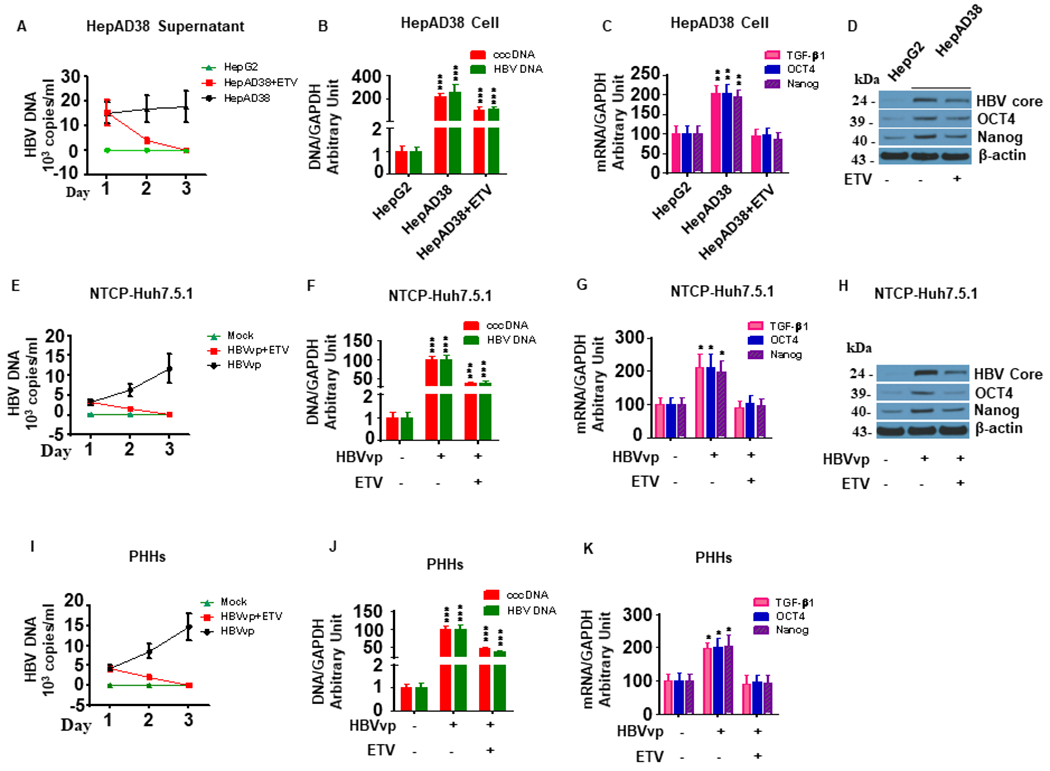
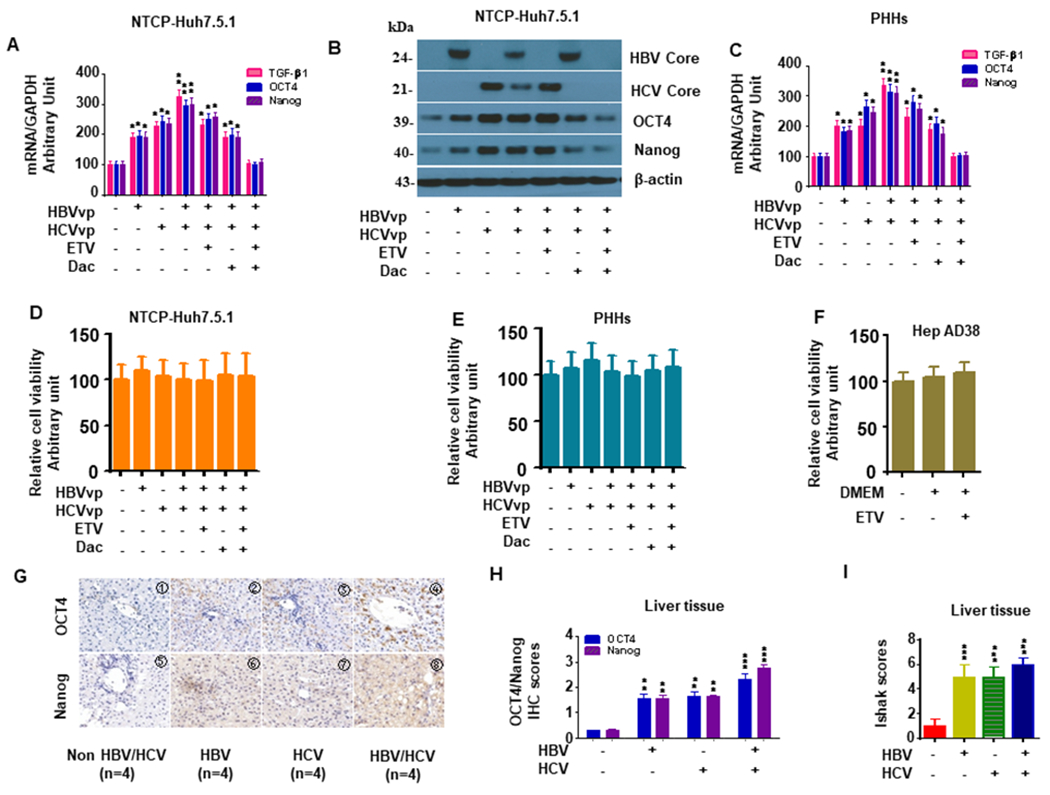
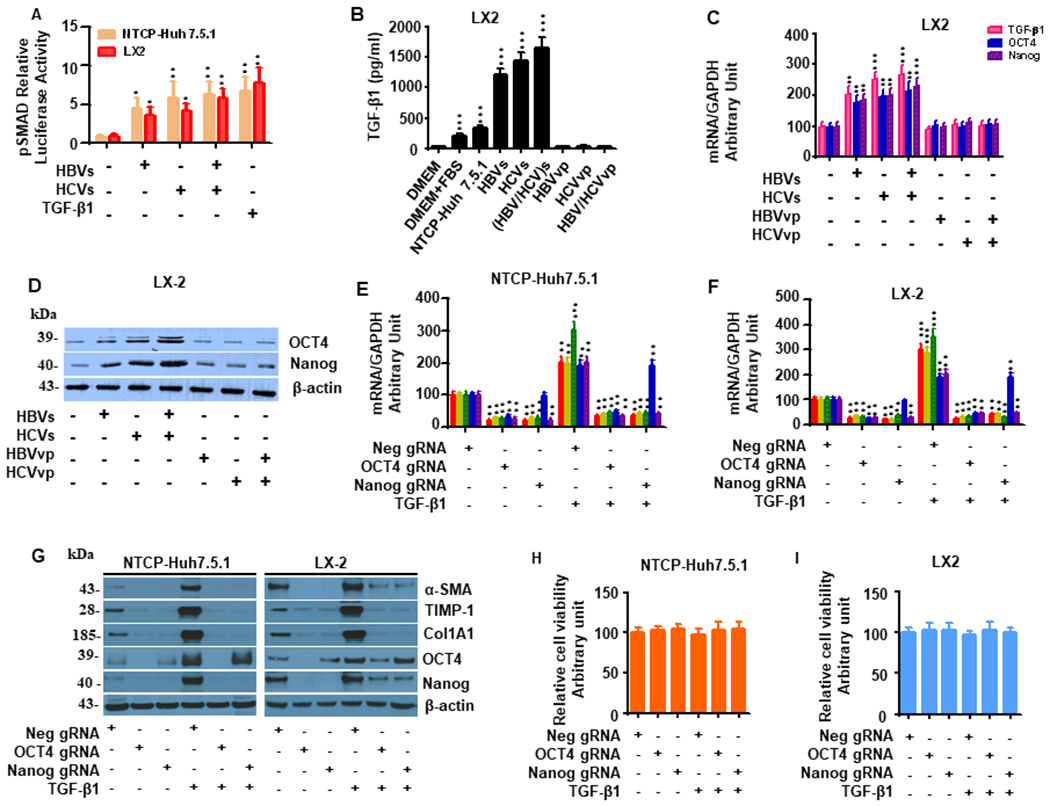
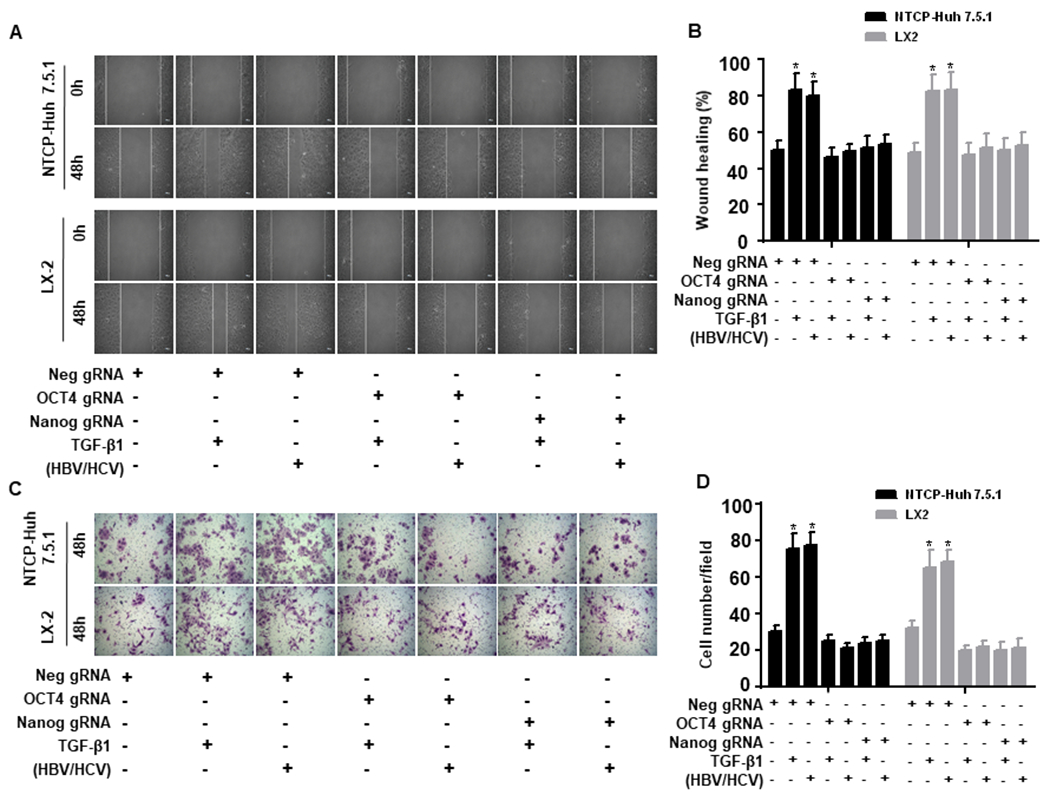
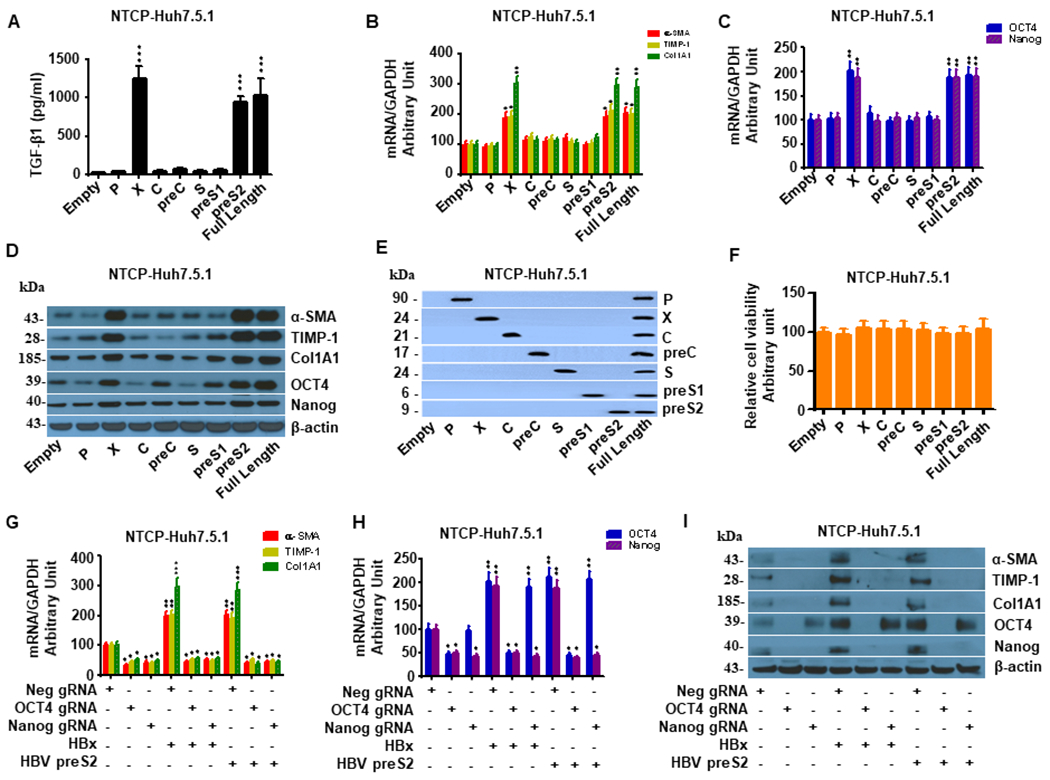
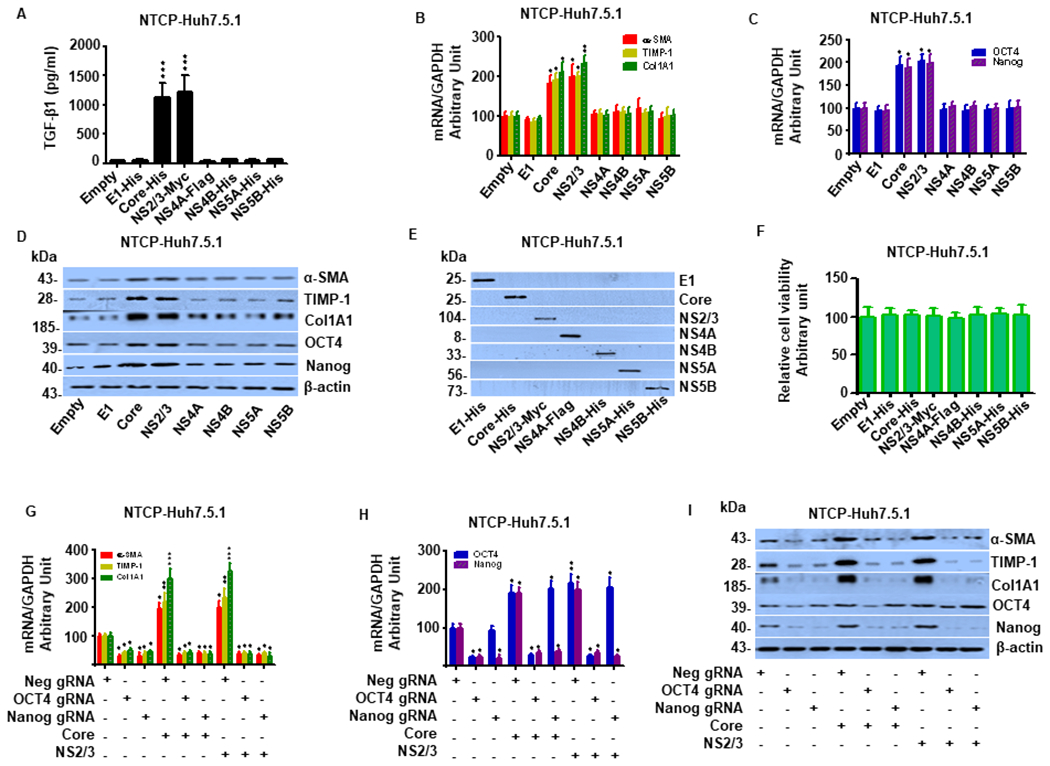
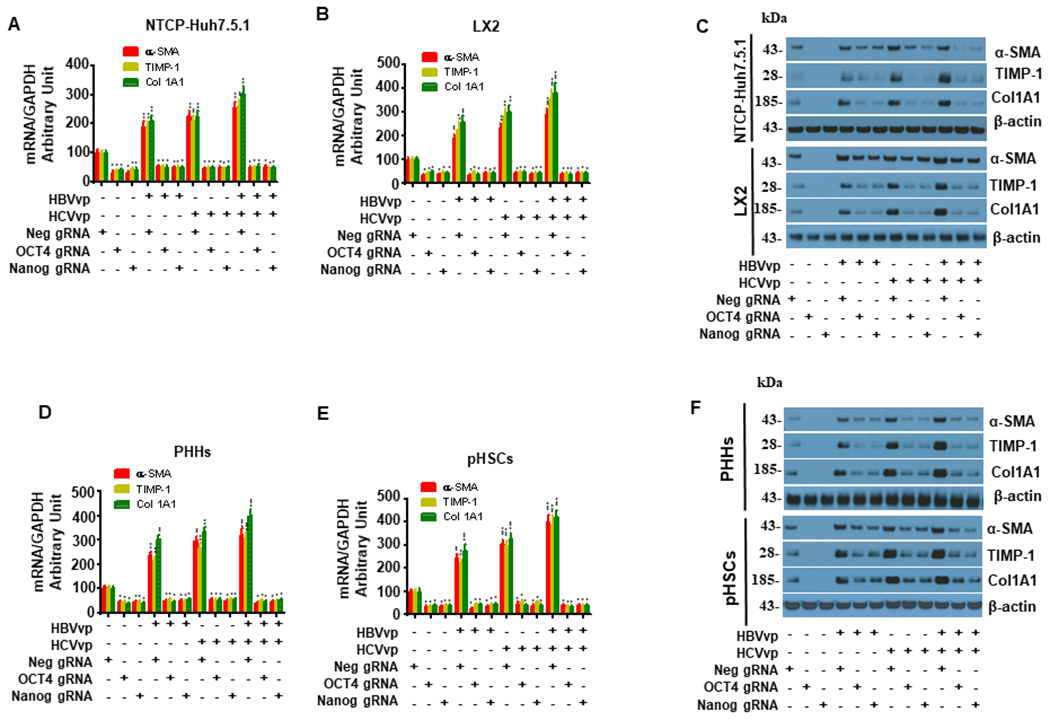
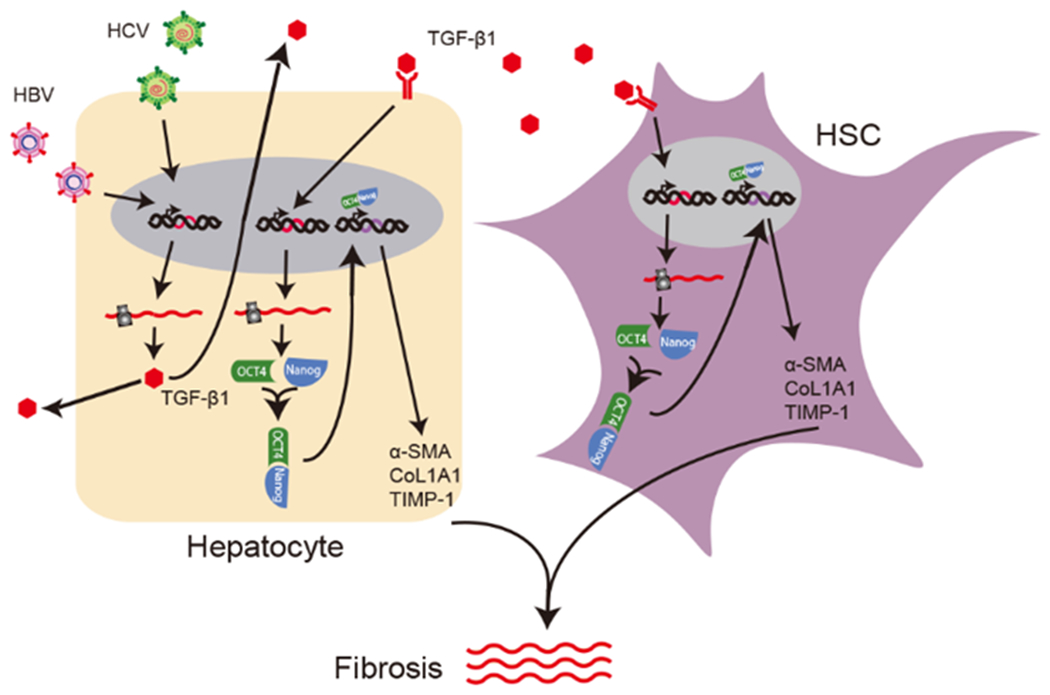
Hepatitis B virus (HBV)/hepatitis C virus (HCV) coinfection accelerates liver fibrosis progression compared with HBV or HCV monoinfection. Octamer binding transcription factor 4 (OCT4) and Nanog are direct targets of the profibrogenic TGF-β1 signaling cascade. We leveraged a coculture model to monitor the effects of HBV and HCV coinfection on fibrogenesis in both sodium taurocholate cotransporting polypeptide-transfected Huh7.5.1 hepatoma cells and LX2 hepatic stellate cells (HSCs). We used CRISPR-Cas9 to knock out OCT4 and Nanog to evaluate their effects on HBV-, HCV-, or TGF-β1-induced liver fibrogenesis. HBV/HCV coinfection and HBx, HBV preS2, HCV Core, and HCV NS2/3 overexpression increased TGF-β1 mRNA levels in sodium taurocholate cotransporting polypeptide-Huh7.5.1 cells compared with controls. HBV/HCV coinfection further enhanced profibrogenic gene expression relative to HBV or HCV monoinfection. Coculture of HBV and HCV monoinfected or HBV/HCV coinfected hepatocytes with LX2 cells significantly increased profibrotic gene expression and LX2 cell invasion and migration. OCT4 and Nanog guide RNA independently suppressed HBV-, HCV-, HBV/HCV-, and TGF-β1-induced α-SMA, TIMP-1, and Col1A1 expression and reduced Huh7.5.1, LX2, primary hepatocyte, and primary human HSC migratory capacity. OCT4/Nanog protein expression also correlated positively with fibrosis stage in liver biopsies from patients with chronic HBV or HCV infection. In conclusion, HBV and HCV independently and cooperatively promote liver fibrogenesis through a TGF-β1-induced OCT4/Nanog-dependent pathway.


Conflict of interest statement

Conflicts of interest: The authors disclose no conflicts of interest.

Figures

Figure 1.
Figure 1.. HBV replication enhances TGF-β1, OCT4 and Nanog expression in NTCP-Huh7.5.1 and PHHs.
HepAD38 cells (30,000 cell/well in 1 mL) were seeded into 24-well plates and incubated overnight.NTCP-Huh7.5.1 (30,000 cell/well) and PHHs (30,000 cell/well) were seeded into 24-well plates (1 mL) and infected with 100 μL HBVvp (0.2 MOI) overnight. Culture supernatant was aspirated, and the cells were washed with PBS and maintained with fresh 10% FBS DMEM. Entecavir (ETV) (20 μM final concentration) was added to the appropriate wells. The culture supernatant and cellular mRNA, DNA and protein were harvested at 24, 48 and 72 hours post ETV treatment, respectively. (A). ETV treatment significantly reduced HBV DNA levels in the supernatant of HepAD38 cells in a time-dependent manner. (B). ETV significantly inhibited HBV DNA and cccDNA expression in HepAD38 cells. (C). HBV replication in HepAD38 cells significantly increased TGF-β1, OCT and Nanog mRNA levels compared to HepG2 cells. ETV treatment blocked HBV replication-induced TGF-β1, OCT4 and Nanog upregulation in HepAD38cells. (D). HBV replication in HepAD38 cells significantly increased HBV core, OCT and Nanog protein levels compared to HepG2 cells. ETV treatment blocked HBV replication-induced OCT4 and Nanog upregulation and reduced HBcAg levels in HepAD38cells. (E). ETV treatment significantly reduced HBV DNA levels in the supernatants of NTCP-Huh7.5.1 in a time-dependent manner. (F). ETV significantly inhibited HBV DNA and cccDNA expression in HBV infected NTCP-Huh7.5.1 cells. (G). ETV treatment leads to a significant decrease in mRNA expression of TGF-β1, OCT4, Nanog in NTCP-Huh 7.5.1 cells. (H). ETV treatment leads to a significant decrease in protein expression of OCT4, Nanog, HBcAg in NTCP-Huh 7.5.1 cells. (I). ETV treatment significantly reduced HBV DNA levels in the supernatants of PHHs cells in a time-dependent manner. (J) ETV significantly inhibited HBV DNA and cccDNA expression in HBV infected PHHs. (K). ETV treatment leads to a significant decrease in mRNA expression of TGF-β1, OCT4, Nanog in PHHs. Data are representative of 3 independent experiments with similar results. Bars represent means ± SD of 3 biological repeats. *, p < 0.05. **, p < 0.01. ***, p < 0.001.
Figure 2.
Figure 2.. HBV/JFH1-HCV coinfection/coexposure additively promotes TGF-β1 and OCT4/Nanog activity in NTCP-Huh7.5.1, PHHs and human liver tissue.
NTCP-Huh7.5.1 (30,000 cell/well) and PHHs (30,000 cell/well) in 1 mL were seeded into 24-well plates and infected with 100 μL HBVvp (0.2 MOI) overnight. Cells were washed and maintained with fresh media with 20 μM ETV or 10 pM Dac for 72 hrs. Cellular mRNA and protein were harvested for qPCR or western blotting, respectively. Cell viability was determined using the Cell Titer-Glo luminescent cell viability assay kit (Promega, Madison, WI) according to the manufacturer’s instructions. (A). ETV and Dac treatment blocked HBV/JFH1-HCV coinfection enhanced TGF-β1/OCT4/Nanog mRNA levels in NTCP-Huh7.5.1 cells. (B). ETV and Dac treatment blocked HBV/JFH1-HCV coinfection enhanced TGF-β1/OCT4/Nanog protein levels in NTCP-Huh7.5.1 cells. (C). ETV and Dac treatment blocked HBV/JFH1-HCV coinfection enhanced TGF-β1/OCT4/Nanog mRNA levels in PHHs. (D). HBV/HCV infection and ETV or Dac treatment did not significantly affect cell viability in NTCP-Huh7.5.1 cells. (E). HBV/HCV infection and ETV or Dac treatment did not significantly affect cell viability in PHHs. (F). HBV infection and ETV treatment did not significantly affect cell viability of HepAD38. (G). Representative Immunohistochemistry images of OCT4 and Nanog (200 X) in liver specimens from non-HBV/HCV (NBNC), HBV-infected, HCV-infected and HBV/HCV coinfected patients. (H). Quantification of OCT4 and Nanog in HBV-infected, HCV-infected or HBV/HCV coinfected liver samples. (I). Ishak liver fibrosis scores. Data are representative of 3 independent experiments with similar results. Bars represent means ± SD of 3 biological repeats. *, p < 0.05. **, p < 0.01. ***, p < 0.001.
Figure 3.
Figure 3.. OCT4 and Nanog gRNA decreases TGF-β1-induced profibrogenic gene expression in HBV/JFH1-HCV coinfection/coexposure in NTCP-Huh7.5.1 and LX2 cells.
(A). HBVvp/HCVvp infection in NTCP-Huh7.5.1 cells or HBVs/HCVs (HBV/HCV)s exposure in LX2 cells increased pSMAD signaling. NTCP-Huh7.5.1 and LX2 cells (100,000 cell/well in 2 mL) were seeded into 6 well-plates and co-transfected with pSMAD-luc (expressing firefly luciferase) and pRL-TK (expressing renilla luciferase) overnight. After that, cells were harvested and seeded into 96 well plate (3000 cell/well in 100 μL). 10 μL of HBVvp or HCVvp was added to the appropriate well for 48 hours. 10 μL of 100 ng/mL TGF-β1 (10 ng/mL final concentration) was added to the appropriate well for another 24 hours. TGF-β1 signaling activity in these cells were tested by the dual-luciferase assay. (B). Exposure of LX2 cells to HBVs, HCVs, or (HBV/HCV)s increased TGF-β1 protein levels. Levels of TGF-β1 in the supernatant or medium were examined by ELISA kits for the samples including DMEM, DMEM+10%FBS, HBVvp, HCVvp, and supernatants from LX2 cells exposure to HBVs, HCVs, (HBV/HCV)s or uninfected NTCP-Huh7.5.1 cell. We found that there is little TGF-β1 in DMEM, HBVvp, HCVvp. Exposure of LX2 cells to HBVs, HCVs, or (HBV/HCV)s increased TGF-β1 protein levels compared to the uninfected NTCP-Huh7.5.1 cell supernatant. (C). Exposure of LX2 cells to HBVs and/or HCVs increased TGF-β1, OCT4 and Nanog mRNA. LX2 cells were seeded (30,000 cell/well in mL) into 24 well-plates and 100 μL of uninfected supernatant, HBVs, HCVs, (HBV/HCV)s, HBVvp, and/or HCVvp was added for 48 hours. Cellular mRNA was collected for qPCR. Exposure of LX2 cells to HBVs and/or HCVs increased OCT4 and Nanog mRNA levels compared to uninfected supernatant. (D). Exposure of LX2 cells to HBVs and/or HCVs increased OCT4 and Nanog protein level. LX2 cells treatments were described in (C). Cellular protein lysates were collected for Western blot. Exposure of LX2 cells to HBVs and/or HCVs increased OCT4 and Nanog protein levels compared to uninfected supernatant. (E). OCT4 gRNA and Nanog gRNA independently inhibited TGF-β1-induced mRNA enhancement of α-SMA, TIMP-1 and Col1A1 in NTCP-Huh7.5.1. NTCP-Huh7.5.1 (30,000 cell /well in 1 mL) cells were seeded into 24 well-plates and transfected with Neg gRNA, OCT4 gRNA or Nanog gRNA in combination with 10 ng/mL TGF-β1 and incubated for 72 hours. Cellular mRNA was collected for qPCR. TGF-β1 treatment increased mRNA level of α-SMA, TIMP-1 and CoL1A1 in NTCP-Huh7.5.1. OCT4 gRNA and Nanog gRNA independently blocked TGF-β1-stimulated mRNA level of α-SMA, TIMP-1 and Col1A1 in NTCP-Huh7.5.1 cells. OCT4 gRNA decreased OCT4 and Nanog mRNA levels. (F). OCT4 gRNA and Nanog gRNA independently inhibited TGF-β1-induced mRNA enhancement of liver fibrosis related genes in LX2 cells. LX2 cells (30,000 cell /well in 1 mL) cells were seeded into 24 well-plates and transfected with Neg gRNA, OCT4 gRNA or Nanog gRNA in combination with 10 ng/mL TGF-β1 and incubated for 72 hours. Cellular mRNA was collected for qPCR. TGF-β1 treatment increased mRNA level of α-SMA, TIMP-1 and Col1A1 in LX2 cells. OCT4 gRNA and Nanog gRNA independently blocked TGF-β1-stimulated mRNA level of α-SMA, TIMP-1 and Col1A1 in LX2 cells. OCT4 gRNA decreased OCT4 and Nanog mRNA expression. (G). OCT4 gRNA and Nanog gRNA independently inhibited TGF-β1-induced protein levels of α-SMA, TIMP-1 and Col1A1 in NTCP-Huh7.5.1 and LX2 cells. NTCP-Huh7.5.1 and LX2 cells treatments were described in (E) and (F). Cellular protein lysates were collected for Western blot. WB confirmed that TGF-β1 treatment increased protein level of α-SMA, TIMP-1 and Col1A1 in NTCP-Huh7.5.1 and LX2 cells. OCT4 gRNA and Nanog gRNA independently inhibited TGF-β1-induced protein levels of α-SMA, TIMP-1 and Col1A1 in NTCP-Huh7.5.1 and LX2 cells. (H) OCT4 gRNA and Nanog gRNA did not significantly affect NTCP-Huh 7.5.1 cell viability. (I) OCT4 gRNA and Nanog gRNA did not significantly affect LX2 cell viability. Data are representative of 3 independent experiments with similar results. Bars represent means ± SD of 3 biological repeats. *, p < 0.05. **, p < 0.01. ***, p < 0.001.
Figure 4.
Figure 4.. OCT4 and Nanog gRNA inhibit TGF-β1-induced NTCP-Huh7.5.1 and LX2 cell migratory capacity.
NTCP-Huh7.5.1 or LX2 (100,000 cell/well in 2 mL) cells were seeded into 6 well-plates and transfected with Neg gRNA, OCT4 gRNA or Nanog gRNA for overnight. The cell monolayer was scratched using a sterilized P200 pipette tip. Cells were washed with PBS and maintained in 2 mL fresh DMEM with 10% FBS. 100 μL of HBVvp and 100 μL HCVvp were added to the appropriate NTCP-Huh7.5.1 wells, 100 μL of HBVs and 100 μL HCVs were added to the appropriate LX2 wells, 200 μL of uninfected supernatant or TGF-β1(100 ng/mL) was added to the appropriate well for 48 hours. (A). Images of NTCP-Huh7.5.1 (top) and LX-2 cell (bottom) scratch assays at 0 and 48 hours. (B). Proportion of migrated NTCP-Huh7.5.1 or LX2 cells. (C). NTCP-Huh7.5.1 or LX2 cells (100,000 cell/well in 2 mL) were seeded into 6 well-plates and transfected with empty gRNA, OCT4 gRNA or Nanog gRNA for overnight. The treated cells were harvested and seeded onto the up chamber (50,000 cell/well in 2 mL) of a 12 well Corning transwell plate (with 8 μm transmembrane pore). 100 μL of HBVvp and 100 μL of HCVvp were added to the appropriate NTCP-Huh7.5.1 cells, 100 μL of HBVs and 100 μL of HCVs were added to the appropriate LX2 cells, 200 μL of uninfected supernatant or TGF-β1(100 ng/mL) was added to the appropriate well for 48 hours. Cells that migrated to the bottom chamber were washed three times with PBS, fixed with 4% paraformaldehyde and stained with 0.05% crystal violet. Cells in the bottom chamber were counted using an inverted light microscope (200 X). (D) Number of migrated NTCP-Huh7.5.1 or LX2 cells. Data are representative of 3 independent experiments with similar results. Bars represent means ± SD of 3 biological repeats. *, p < 0.05. **, p < 0.01.
Figure 5.
Figure 5.. OCT4 and Nanog gRNA attenuate HBV-induced liver fibrosis in NTCP-Huh7.5.1 cells.
NTCP-Huh7.5.1 cells (30,000 cells/well in 1 mL) were seeded into a 24-well plate and incubated overnight. The cells were transfected with HBV full length and sub-genomic constructs including HBV P, X, C, preC, S, preS1, preS2 or pcDNA3.1(+) empty vector for 72 hr. Cell lysates were harvested for mRNA quantification or protein analysis by western blot. (A). Overexpression of HBV full length and HBV X and preS2 significantly increased TGF-β1 levels in supernatant compared to the empty vector in NTCP-Huh7.5.1 cells. In contrast, overexpression of HBV P, C, PreC, S, preS1 or Empty vector did not significantly affect TGF-β1 levels in supernatant. (B). Overexpression of HBV X, preS2 and the full-length HBV genome significantly increased mRNA of liver fibrosis-related genes (α-SMA, TIMP-1, and Col1A1) in NTCP-Huh7.5.1 cells. In contrast, HBV P, C, PreC, S, preS1 and empty vector did not have significant effects on these profibrotic genes. (C). Overexpression of HBV X, preS2 and the full-length HBV genome significantly increased OCT4/Nanog mRNA levels in NTCP-Huh7.5.1 cells. In contrast, HBV P, C, PreC, S, preS1 and empty vector did not have significant effects on Oct-4/Nanog mRNA levels. (D). Overexpression of HBV X, preS2 and the full-length HBV genome significantly increased protein levels of α-SMA, TIMP-1, Col1A1 and Oct-4/Nanog in NTCP-Huh7.5.1 cells. In contrast, HBV P, C, PreC, S, preS1 and empty vector did not have significant effects on these gene protein expressions. (E). Confirmation of HBV full length and subgenomic overexpression in NTCP-Huh7.5.1 cells. The antibodies used for western blotting included anti-HBV P (Affinity, DF13563, USA), anti-HBX (Abcam, ab2741), anti-HBV Core (Abcam, ab8637), anti-HBV preC (Abcam, ab228709), anti-HBV S (Abcam, ab8636), anti-HBV preS1(Abm59501-4, Beijing, China), and anti-preS2 (Abcam, ab8635). (F). Overexpression of HBV full length and sub-genomic constructs including HBV P, X, C, preC, S, preS1, preS2 did not significantly affect cell viability in NTCP-Huh7.5.1 cells. (G) OCT4 and Nanog gRNA attenuate HBV-induced liver fibrosis related gene mRNA enhancement in NTCP-Huh7.5.1 cells. NTCP-Huh7.5.1 cells (30,000 cell /well in 1 mL) were seeded into a 24-well plate and incubated overnight. The cells were transfected with HBX, preS2 and/or OCT4 gRNA, Nanog gRNA, or Neg gRNA for 72 hours. Cell lysates were harvested for mRNA quantification by qRT-PCR. Both OCT4 gRNA and Nanog gRNA reduced HBx- or HBV preS2-induced α-SMA, TIMP-1 and Col1A1 mRNA expressions. (H) OCT4 and Nanog gRNA attenuate HBV-stimulated OCT4/Nanog mRNA levels in NTCP-Huh7.5.1 cells. NTCP-Huh7.5.1 cells treatments were described in (G). We found that both OCT4 gRNA and Nanog gRNA blocked HBx- or HBV preS2-induced OCT4/Nanog mRNA levels. (I) OCT4 and Nanog gRNA blocked HBV-stimulated liver fibrosis related gene and Oct-4/Nanog protein levels in NTCP-Huh7.5.1 cells. NTCP-Huh7.5.1 cells treatments were described in (G). Cell lysates were harvested for protein analysis by western blot. We found that both OCT4 gRNA and Nanog gRNA attenated HBx- or HBV preS2-induced α-SMA, TIMP-1, Col1A1 and OCT4/Nanog protein levels. Data are representative of 3 independent experiments with similar results. Bars represent means ± SD of 3 biological repeats. *, p < 0.05. **, p < 0.01. ***, p < 0.001.
Figure 6.
Figure 6.. OCT4 and Nanog gRNAs reduce HCV-induced liver fibrogenesis in NTCP-Huh7.5.1 cells.
(A). Overexpression of HCV Core or NS2/3 significantly increased TGF-β1 levels in supernatant compared to the Empty vector in NTCP-Huh7.5.1 cells. In contrast, Overexpression HCV E1, NS4A, NS4B, NS5A, NS5B or Empty vector did not significantly affect TGF-β1 levels in supernatant. (B). Overexpression of HCV Core or NS2/3 significantly increased mRNA expression of liver fibrosis-related genes (α-SMA, TIMP-1 and Col1A1). NTCP-Huh7.5.1 cells (30,000 cell /well in 1 mL) were seeded into a 24-well plate and incubated overnight. The cells were transfected with HCV sub-genomic constructs including HCV E1, core, NS2-3, NS4A, NS4B, NS5A, NS5B or the pcDNA3.1(+) empty vector for 72 hours. Cell lysates were harvested for mRNA quantification by qRT-PCR. We found that overexpression of HCV Core or NS2/3 significantly increased mRNA expression of liver fibrosis-related genes α-SMA, TIMP-1 and Col1A1. In contrast, HCV E1, NS4A, NS4B, NS5A, NS5B and empty vector did not have significant effects on profibrotic gene expression. (C). Overexpression of HCV Core or NS2/3 significantly increased OCT4/Nanog mRNA levels. NTCP-Huh7.5.1 cells treatments were described in (B). We found that overexpression of HCV Core or NS2/3 significantly increased OCT4/Nanog mRNA expression. In contrast, HCV E1, NS4A, NS4B, NS5A, NS5B and empty vector did not have significant effects on OCT4/Nanog mRNA levels. (D). Overexpression of HCV Core or NS2/3 significantly increased α-SMA, TIMP-1, Col1A1 and OCT4/Nanog protein levels. NTCP-Huh7.5.1 cells treatments were described in (B). Cell lysates were harvested for protein analysis by western blot. We found that overexpression of HCV Core or NS2/3 significantly increased α-SMA, TIMP-1, Col1A1 and OCT4/Nanog protein levels. In contrast, HCV E1, NS4A, NS4B, NS5A, NS5B and empty vector did not have significant effects on these gene protein levels. (E). Confirmation of HCV sub-genomic construct overexpression, including HCV E1, Core, NS2-3, NS4A, NS4B, NS5A, NS5B or pcDNA3.1(+) Empty vector in NTCP-Huh7.5.1 cells. The antibodies used included anti-His (Biovision, 3646-100), anti-Myc (Abcam, ab32072), or anti-Flag (Abcam, ab205606). (HRP)-conjugated ECL donkey anti-rabbit IgG (GE Healthcare Biosciences, Pittsburgh, PA, USA) was used as a secondary antibody. (F). Overexpression HCV sub-genomic constructs including HCV E1, Core, NS2-3, NS4A, NS4B, NS5A, NS5B or Empty vector in NTCP-Huh7.5.1 cells did not significantly affect cell viability. (G) OCT4 and Nanog gRNAs blocked HCV-stimulated liver fibrosis related gene mRNA in NTCP-Huh7.5.1 cells. NTCP-Huh7.5.1 cells (30,000 cell /well in 1 mL) were seeded into a 24-well plate and incubated overnight. The cells were transfected with HCV Core, NS2/3 and/or OCT4 gRNA, Nanog gRNA, or Neg gRNA for 72 hours. Cell lysates were harvested for mRNA quantification by qRT-PCR. Both OCT4 gRNA and Nanog gRNA suppressed HCV Core- or NS2/3-induced mRNA expression of α-SMA, TIMP-1, and Col1A1. (H) OCT4 and Nanog gRNAs reduced HCV-stimulated OCT4/Nanog mRNA in NTCP-Huh7.5.1 cells. NTCP-Huh7.5.1 cells treatments were described in (G). Both OCT4 gRNA and Nanog gRNA suppressed HCV Core- or NS2/3-induced OCT4/Nanog mRNA enhancements. (I) OCT4 and Nanog gRNAs attenuated HCV-stimulated liver fibrosis related gene and OCT4/Nanog protein expression in NTCP-Huh7.5.1 cells. NTCP-Huh7.5.1 cells treatments were described in (G). Cell lysates were harvested for protein analysis by western blot. Both OCT4 gRNA and Nanog gRNA suppressed overexpression of HCV Core- or NS2/3-induced of α-SMA, TIMP-1, Col1A1 and OCT4/Nanog mRNA expressions. Data are representative of 3 independent experiments with similar results. Bars represent means ± SD of 3 biological repeats. *, p < 0.05. **, p < 0.01. ***, p < 0.001.
Figure 7.
Figure 7.. OCT4 and Nanog gRNA attenuate enhanced profibrogenic gene expression induced by HBV/JFH1-HCV in hepatocytes and hepatic stellate cells in coculture.
NTCP-Huh7.5.1 or PHHs (50,000 cell/well) were seeded onto the lower chamber of 12-well transwell plates. LX2 cells or pHSCs (50,000 cell/well) were plated in 2 mL 10%FBS DMEM on the upper chamber with a 0.4 micrometer (μm) membrane. NTCP-Huh7.5.1/LX2 cells were in one chamber while PHHs/pHSCs were in another chamber. 200 μL HBVvp or HCVvp were added to the appropriate well for 4 hours. Cells in the corresponding wells were transfected with OCT4, Nanog, or Neg gRNA for 72 hours. Cells were washed with PBS and cell lysates were harvested for mRNA quantification by qRT-PCR or protein analysis by western blot. (A). OCT4 and Nanog gRNA inhibited HBV-, JFH1 HCV- or HBV+HCV-induced α-SMA, TIMP-1 and Col1A1 mRNA upregulation in NTCP-Huh7.5.1 in NTCP-Huh7.5.1/LX2 coculture. (B). OCT4 and Nanog gRNA inhibited HBV-, JFH1 HCV- or HBV+HCV-induced α-SMA, TIMP-1 and Col1A1 mRNA level in LX2 in NTCP-Huh7.5.1/LX2 coculture. (C). OCT4 and Nanog gRNA blocked HBV-, JFH1 HCV- or HBV+HCV-stimulated α-SMA, TIMP-1 and Col1A1 protein upregulation in NTCP-Huh7.5.1 and LX2 cells in NTCP-Huh7.5.1/LX2 coculture. (D). OCT4 and Nanog gRNA reduced HBV-, JFH1 HCV- or HBV+HCV-induced α-SMA, TIMP-1 and Col1A1 mRNA upregulation in PHHs in PHHs/pHSCs coculture. (E). OCT4 and Nanog gRNA inhibited HBV-, JFH1 HCV- or HBV+HCV-induced α-SMA, TIMP-1 and Col1A1 mRNA level in pHSCs in PHHs/pHSCs coculture. (F). OCT4 and Nanog gRNA blocked HBV-, JFH1 HCV- or HBV+HCV-stimulated α-SMA, TIMP-1 and Col1A1 protein upregulation in PHHs and pHSCs cells in PHHs/pHSCs coculture. Data are representative of 3 independent experiments with similar results. Bars represent means ± SD of 3 biological repeats. *, p < 0.05. **, p < 0.01. ***, p < 0.001.
Figure 8.
Figure 8.. Proposed pathway of hepatic fibrogenesis in HBV/HCV coinfection.
HBV and HCV stimulate TGF-β1 production in hepatocytes, which activates OCT4/Nanog in both hepatocytes and hepatic stellate cells. OCT4/Nanog then translocate to the nucleus, where they potentiate the expression of profibrogenic genes such as α-SMA, TIMP-1 and Col1A1.

Similar articles

Cited by

References

    1. Lin W, Wu G, Li S, Weinberg EM, Kumthip K, Peng LF, Mendez-Navarro J, Chen WC, Jilg N, Zhao H, Goto K, Zhang L, Brockman MA, Schuppan D, and Chung RT. 2011. HIV and HCV cooperatively promote hepatic fibrogenesis via induction of reactive oxygen species and NFkappaB. J Biol Chem 286: 2665–2674. - PMC - PubMed
    1. Lin W, Weinberg EM, and Chung RT. 2013. Pathogenesis of accelerated fibrosis in HIV/HCV co-infection. J Infect Dis 207 Suppl 1: S13–18. - PMC - PubMed
    1. Lin W, Tsai WL, Shao RX, Wu G, Peng LF, Barlow LL, Chung WJ, Zhang L, Zhao H, Jang JY, and Chung RT. 2010. Hepatitis C virus regulates transforming growth factor beta1 production through the generation of reactive oxygen species in a nuclear factor kappaB-dependent manner. Gastroenterology 138: 2509–2518, 2518.e2501. - PMC - PubMed
    1. Lin W, Weinberg EM, Tai AW, Peng LF, Brockman MA, Kim KA, Kim SS, Borges CB, Shao RX, and Chung RT. 2008. HIV increases HCV replication in a TGF-beta1-dependent manner. Gastroenterology 134: 803–811. - PubMed
    1. Imai Y, Yoshida O, Watanabe T, Yukimoto A, Koizumi Y, Ikeda Y, Tokumoto Y, Hirooka M, Abe M, and Hiasa Y. 2019. Stimulated hepatic stellate cell promotes progression of hepatocellular carcinoma due to protein kinase R activation. PLoS One 14: e0212589. - PMC - PubMed

Publication types

MeSH terms