Long-term Effect of Regular Physical Activity and Exercise Habits in Patients With Early Parkinson Disease
- PMID: 35022304
- PMCID: PMC8883509
- DOI: 10.1212/WNL.0000000000013218
Long-term Effect of Regular Physical Activity and Exercise Habits in Patients With Early Parkinson Disease
Abstract
Background and objectives: Owing to the lack of long-term observations or comprehensive adjustment for confounding factors, reliable conclusions regarding long-term effects of exercise and regular physical activity in Parkinson disease (PD) have yet to be drawn. Here, using data from the Parkinson's Progression Markers Initiative study that includes longitudinal and comprehensive evaluations of many clinical parameters, we examined the long-term effects of regular physical activity and exercise habits on the course of PD.
Methods: In this retrospective, observational cohort study, we primarily used the multivariate linear mixed-effects models to analyze the interaction effects of their regular physical activity and moderate to vigorous exercise levels, measured with the Physical Activity Scale for the Elderly questionnaire, on the progression of clinical parameters, after adjusting for age, sex, levodopa equivalent dose, and disease duration. We also calculated bootstrapping 95% confidence intervals (CIs) and conducted sensitivity analyses using the multiple imputation method and subgroup analyses using propensity score matching to match for all baseline background factors.
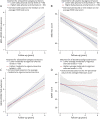
Results: Two hundred thirty-seven patients with early PD (median [interquartile range] age, 63.0 [56.0-70.0] years, male 69.2%, follow-up duration 5.0 [4.0-6.0] years) were included. Regular physical activity and moderate to vigorous exercise levels at baseline did not significantly affect the subsequent clinical progression of PD. However, average regular overall physical activity levels over time were significantly associated with slower deterioration of postural and gait stability (standardized fixed-effects coefficients of the interaction term [βinteraction] = -0.10 [95% CI -0.14 to -0.06]), activities of daily living (βinteraction = 0.08 [95% CI 0.04-0.12]), and processing speed (βinteraction = 0.05 [95% CI 0.03-0.08]) in patients with PD. Moderate to vigorous exercise levels were preferentially associated with slower decline of postural and gait stability (βinteraction = -0.09 [95% CI -0.13 to -0.05]), and work-related activity levels were primarily associated with slower deterioration of processing speed (βinteraction = 0.07 [95% CI 0.04-0.09]). Multiple imputation and propensity score matching confirmed the robustness of our results.
Discussion: In the long term, the maintenance of high regular physical activity levels and exercise habits was robustly associated with better clinical course of PD, with each type of physical activity having different effects.
Trial registration information: ClinicalTrials.gov Identifier: NCT01176565.
Classification of evidence: This study provides Class II evidence that sustained increase in overall regular physical activity levels in patients with early PD was associated with slower decline of several clinical parameters.
Copyright © 2022 The Author(s). Published by Wolters Kluwer Health, Inc. on behalf of the American Academy of Neurology.
Figures


Comment in
-
Could Exercise Be the Answer? Disease Modification With Long-term Regular Physical Activity in Parkinson Disease.Neurology. 2022 Feb 22;98(8):303-304. doi: 10.1212/WNL.0000000000013208. Epub 2022 Jan 12. Neurology. 2022. PMID: 35022307 No abstract available.
-
Author Response: Long-term Effect of Regular Physical Activity and Exercise Habits in Patients With Early Parkinson Disease.Neurology. 2022 Jul 19;99(3):133-134. doi: 10.1212/WNL.0000000000200925. Neurology. 2022. PMID: 35851550 No abstract available.
-
Reader Response: Long-term Effect of Regular Physical Activity and Exercise Habits in Patients With Early Parkinson Disease.Neurology. 2022 Jul 19;99(3):133. doi: 10.1212/WNL.0000000000200924. Neurology. 2022. PMID: 35851552 No abstract available.
-
Reader Response: Long-term Effect of Regular Physical Activity and Exercise Habits in Patients With Early Parkinson Disease.Neurology. 2022 Jul 19;99(3):131-132. doi: 10.1212/WNL.0000000000200922. Neurology. 2022. PMID: 35851553 No abstract available.
-
Author Response: Long-term Effect of Regular Physical Activity and Exercise Habits in Patients With Early Parkinson Disease.Neurology. 2022 Jul 19;99(3):132. doi: 10.1212/WNL.0000000000200923. Neurology. 2022. PMID: 35851557 No abstract available.
-
Reader Response: Long-term Effect of Regular Physical Activity and Exercise Habits in Patients With Early Parkinson Disease.Neurology. 2022 Aug 30;99(9):401-402. doi: 10.1212/WNL.0000000000201127. Neurology. 2022. PMID: 36038283 No abstract available.
-
Author Response: Long-term Effect of Regular Physical Activity and Exercise Habits in Patients With Early Parkinson Disease.Neurology. 2022 Aug 30;99(9):402. doi: 10.1212/WNL.0000000000201128. Neurology. 2022. PMID: 36038287 No abstract available.
References
-
- Postuma RB, Berg D, Stern M, et al. . MDS clinical diagnostic criteria for Parkinson's disease. Mov Disord. 2015;30(12):1591-1601. - PubMed
-
- Tsukita K, Sakamaki-Tsukita H, Tanaka K, Suenaga T, Takahashi R. Value of in vivo α-synuclein deposits in Parkinson's disease: a systematic review and meta-analysis. Mov Disord. 2019;34(10):1452-1463. - PubMed
-
- Lim S-Y, Tan AH, Ahmad-Annuar A, et al. . Parkinson's disease in the Western Pacific region. Lancet Neurol. 2019;18(9):865-879. - PubMed
-
- Bekkers EMJ, Dijkstra BW, Dockx K, Heremans E, Verschueren SMP, Nieuwboer A. Clinical balance scales indicate worse postural control in people with Parkinson's disease who exhibit freezing of gait compared to those who do not: a meta-analysis. Gait Posture. 2017;56:134-140. - PubMed
Publication types
MeSH terms
Associated data
LinkOut - more resources
Full Text Sources
Other Literature Sources
Medical
Research Materials
