. 2022 Jan 12;5(1):42.
doi: 10.1038/s42003-021-02958-6.

TWIST1 expression is associated with high-risk neuroblastoma and promotes primary and metastatic tumor growth

Affiliations

TWIST1 expression is associated with high-risk neuroblastoma and promotes primary and metastatic tumor growth

Maria-Vittoria Sepporta et al. Commun Biol. .

Abstract

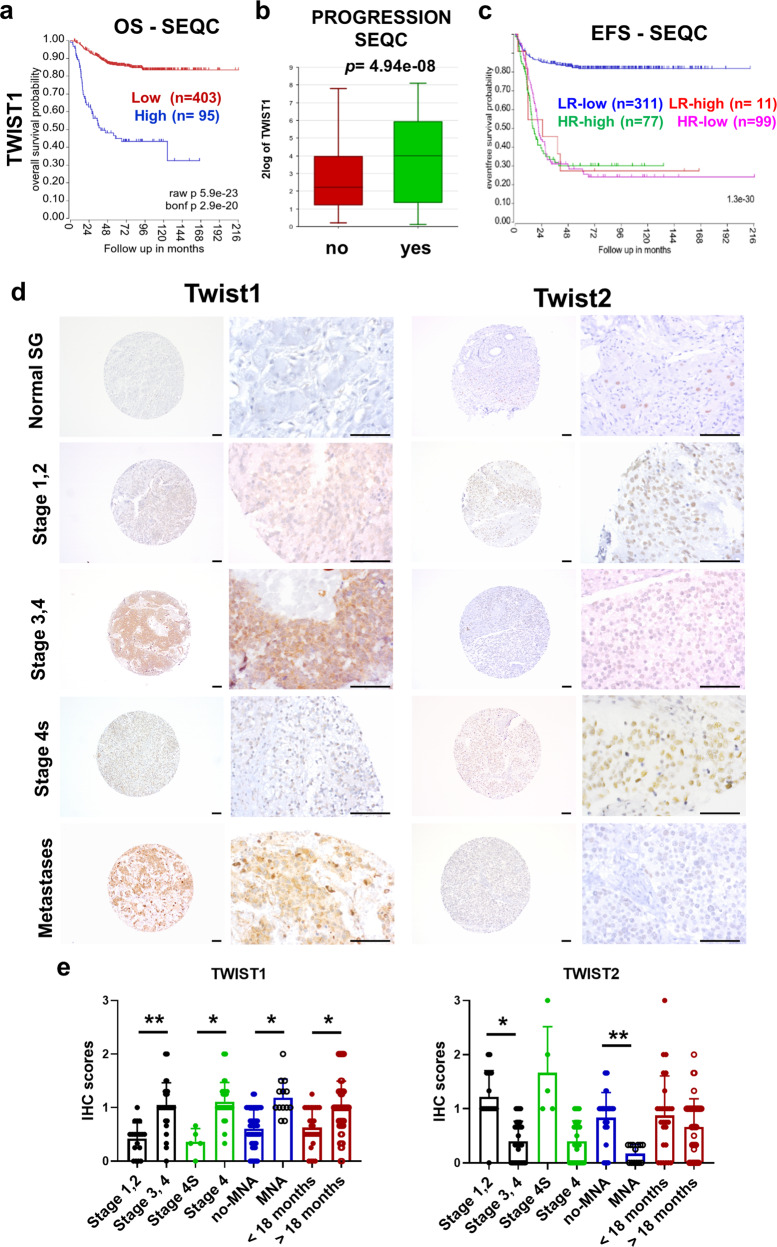
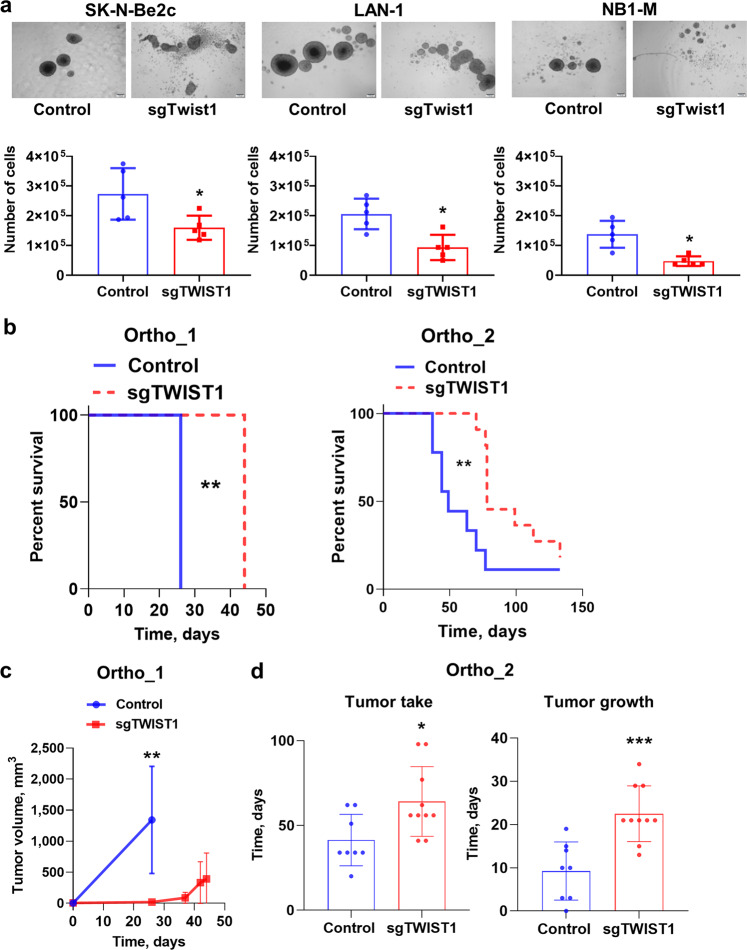
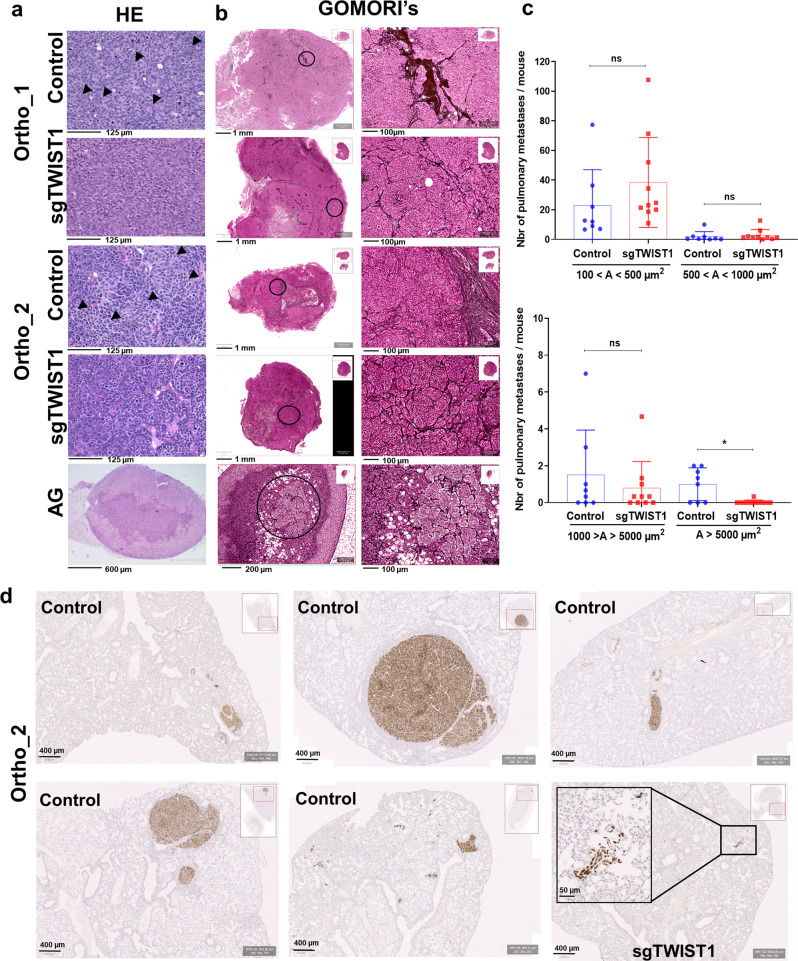
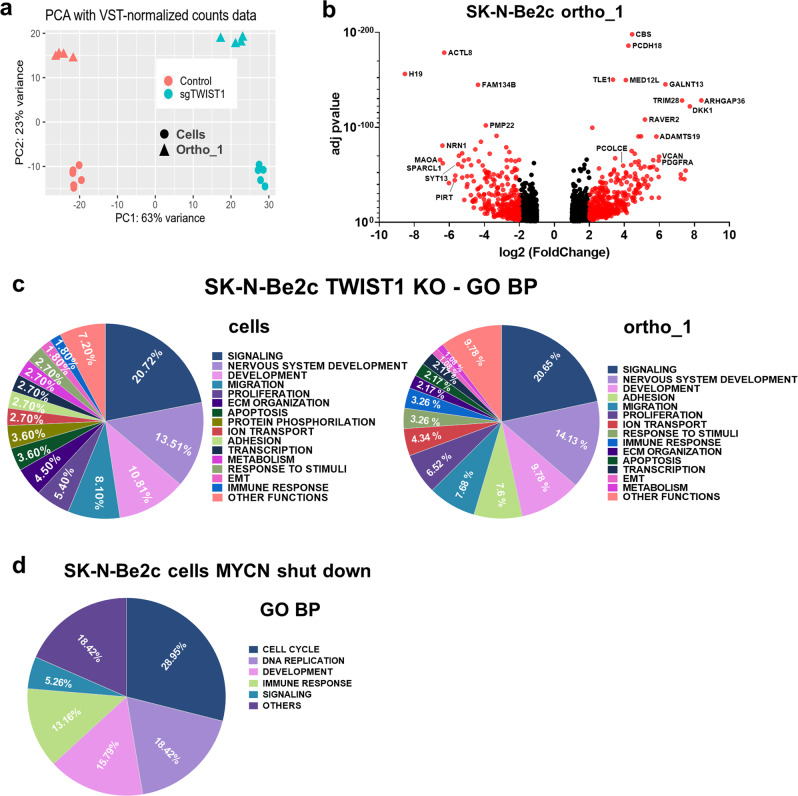
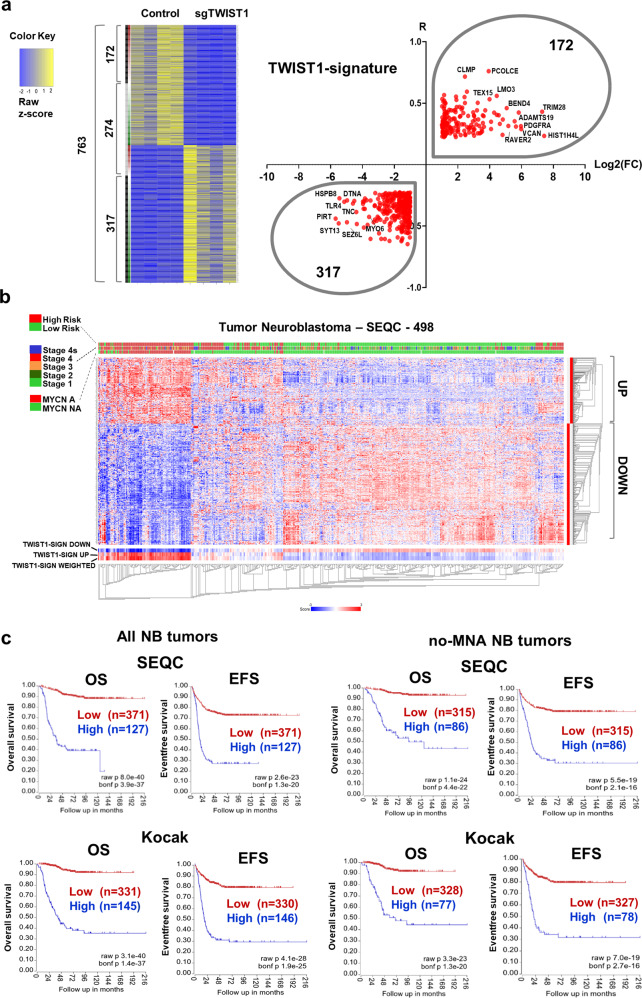
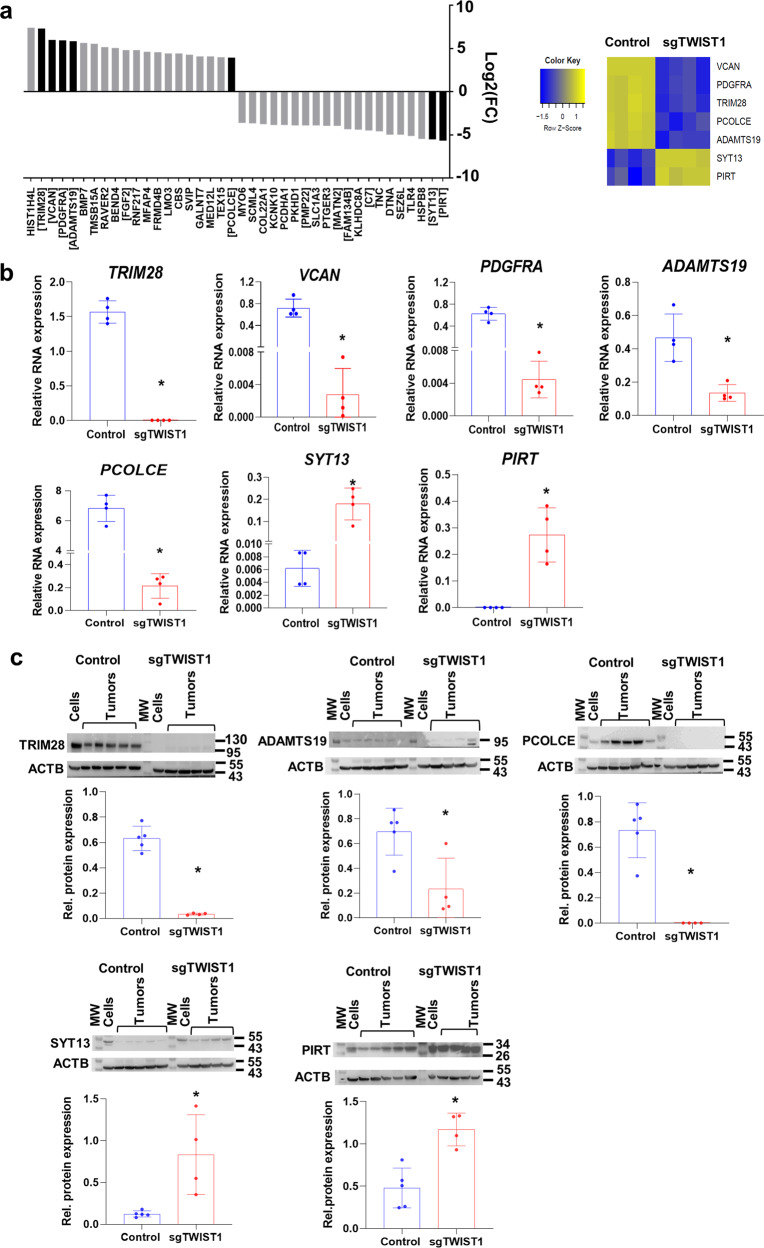
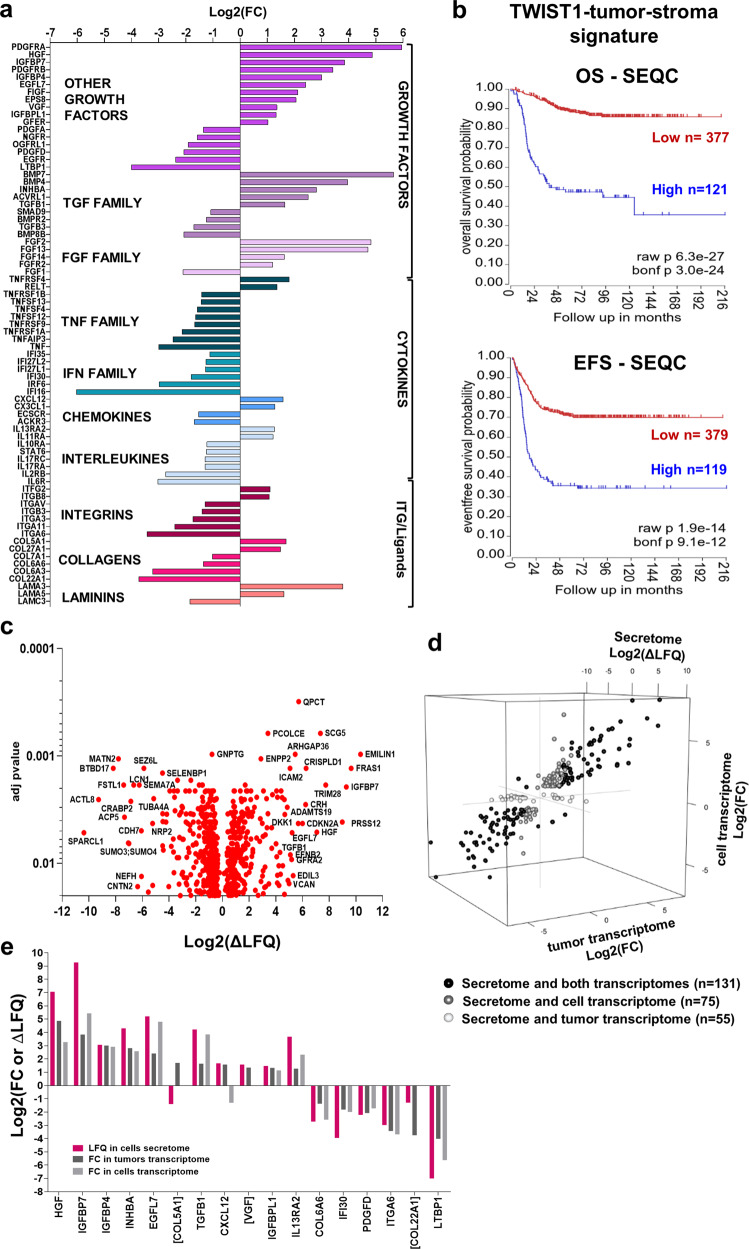
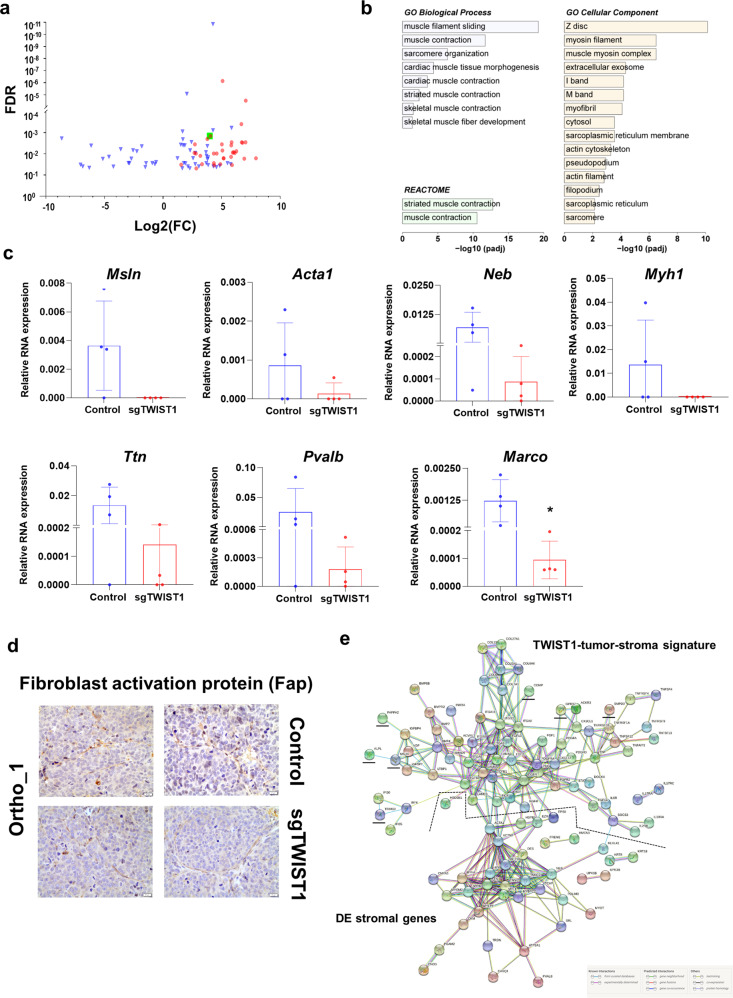
The embryonic transcription factors TWIST1/2 are frequently overexpressed in cancer, acting as multifunctional oncogenes. Here we investigate their role in neuroblastoma (NB), a heterogeneous childhood malignancy ranging from spontaneous regression to dismal outcomes despite multimodal therapy. We first reveal the association of TWIST1 expression with poor survival and metastasis in primary NB, while TWIST2 correlates with good prognosis. Secondly, suppression of TWIST1 by CRISPR/Cas9 results in a reduction of tumor growth and metastasis colonization in immunocompromised mice. Moreover, TWIST1 knockout tumors display a less aggressive cellular morphology and a reduced disruption of the extracellular matrix (ECM) reticulin network. Additionally, we identify a TWIST1-mediated transcriptional program associated with dismal outcome in NB and involved in the control of pathways mainly linked to the signaling, migration, adhesion, the organization of the ECM, and the tumor cells versus tumor stroma crosstalk. Taken together, our findings confirm TWIST1 as promising therapeutic target in NB.


Conflict of interest statement

The authors declare no competing interests.

Figures

Fig. 1
Fig. 1. TWIST1 RNA expression is associated with poorer outcome of NB patients and displays an opposite protein expression profile in a NB tissue microarray.
ac Analysis of TWIST1 expression in the SEQC dataset of primary NB tumors. a Kaplan−Meier OS curve associated with TWIST1 expression. Expression cutoff: 44.441. b Box-and whisker plots showing the expression of TWIST1 in relation to disease progression. c Kaplan−Meier EFS curves showing the stratification of patients of the SEQC dataset according to the risk classification (high-risk: HR; low-risk: LR) and TWIST1 expression (high or low). d TWIST1 and TWIST2 protein expression was analyzed by IHC using a NB TMA containing 97 tumor sections: 72 primary tumors, 25 matched metastases and 44 matched control normal tissues, adrenal glands, and sympathetic ganglia (SG). Representative images of TWIST1 and TWIST2 IHC staining are shown for each indicated category. Magnification 100× (left panels) and 400× (right panels); scale bares = 100 µm. e Graphs showing the individual IHC scores of TWIST1 and TWIST2 per tumor and the mean ± SD for different comparisons (see Supplementary Table 1). Statistical analysis was done using parametric Student’s t-test.
Fig. 2
Fig. 2. TWIST1 KO reduces the neurosphere forming capacities of NB cells in vitro and the tumor growth capacities of SK-N-Be2c cells in vivo.
a Representative images (scale bar 200 µm) showing the size and shape of primary neurospheres of Control and sgTWIST1 NB cells after 7 days in culture. The numbers of cells obtained after dissociation of Control and sgTWIST1 primary neurospheres are plotted in bar graphs as individual values for each independent experiments and mean ± SD (n = 5 experiments performed in duplicates). Mann−Whitney test: *p = 0.0317 for SK-N-Be2c; *p = 0.0159 for LAN-1 and NB1-M. b Kaplan−Meier survival curves of athymic Swiss nude mice implanted orthotopically with SK-N-Be2C-Control or -sgTWIST1 cells. Mice were sacrificed once tumors reached the volume of 1000 and 500 mm3 for ortho_1 and ortho_2 experiments, respectively. Tumor take: ortho_1: 100% (6/6) in the Control group, 66.66% (4/6) in the sgTWIST1 group; ortho_2: 89% (8/9) in the Control group, 83% (10/12) in the sgTWIST1 group. Median survival in the Control vs sgTWIST1 group: 26 vs 44 days for ortho_1 (**p = 0.0027); 49 vs 78 days for ortho_2 (**p = 0.0016). Gehan−Breslow−Wilcoxon test. c Tumor growth (mean tumor volumes ± SD) for ortho_1 experiment. Multiple t-test (HolmSidak, α = 0.05, without assuming a consistent SD): **p = 0.0037. d Time for tumor initiation and tumor growth in the ortho_2 experiment (individual values for each mice and mean ± SD). Tumor initiation corresponds to the number of days required to measure an AG volume > 10 mm3 (mean Control: 41.38 days, sgTWIST1: 64.10 days, *p = 0.0192). Time for tumor growth was calculated as the number of days at sacrifice minus the number of days for tumor initiation (mean Control: 9.25 days, sgTWIST1: 22.50 days, ***p = 0.0006, unpaired t-test).
Fig. 3
Fig. 3. TWIST1 KO produces tumor with a less aggressive phenotype and impairs the formation of the intrapulmonary macrometastases.
a Representative images of H&E staining of ortho tumors and AG. H&E staining of both ortho-derived tumors depicted cells in Control tissues separated by thin fibro-vascular septs having irregular size and shape; no discernable/scarce cytoplasm; one or few prominent nucleoli; spindle-shaped cells with fusiform nuclei (black arrow) that tended to have a fascicular organization. Conversely, sgTWIST1 tumor cells were portrayed by a more regular size and shape (round to oval) with only slight irregularities, finely granular (“salt-and-pepper”) chromatin, small nucleoli, and moderate/more discernible cytoplasm (scale bar: 125 µm for tumors; 600 µm for AG). b Representative images of Gomori’s staining showing the architecture of the collagen III/reticulin fibers in ortho tumors and AG, scale bars: 1 mm and 200 µm, respectively; and zoomed view of the region highlighted by a black circle, scale bars: 100 µm for both tumors and AG. c Quantification of metastases detected by IHC with the Alu positive probe II within the parenchyma (intrapulmonary) of mice (n = 8 mice for Control, n = 10 for sgTWIST1). Data are plotted in a bar graph showing individual values and mean ± SD for micrometastases (upper panel: 100−500 µm2: p = 0.1120; 500−1000 µm2: p = 0.3705) and for macrometastases (lower panel: 1000−5000 µm2, p = 0.5724; >5000 µm2, *p = 0.0178). Mann−Whitney test. Percent of mice with macrometastases = 62.5% in the Control group; 10% in the sgTWIST1 group (p = 0.043 Fisher’s exact test). d Representative images of Alu positive probe II staining of lungs of the 5 Control and 1 sgTWIST1 ortho_2 mice with pulmonary metastases A > 105 µm2.
Fig. 4
Fig. 4. The biological pathways deregulated by TWIST1 KO are distinct from those mediated by MYCN shut down.
a PCA samples repartition using the VST-normalized counts. PCA1 and PCA2 are 63% and 23% of total variation, respectively. b Volcano plots showing the distribution of the DE genes according to FC (log2) and adj p value between the SK-N-Be2c-Control and –sgTWIST1 ortho_1-derived xenografts. Genes with False Discovery Rate (FDR) < 0.05 and absolute value (av) of log2(FC) ≥ 1 were considered as DE; in red genes with av of log2(FC) ≥ 2, in black genes with av of log2(FC) ≥ 1 and <2. Positive and negative x-values represent genes either up- or downregulated by TWIST1, respectively. c Illustration of the biological processes gene sets found enriched by GO analyses (GO BP) in the DE genes following TWIST1 KO for both SK-N-Be2c cells (left panel) and ortho_1 tumors (right panel). Data are reported as the repartition (in %) of the diverse pathways identified with a FDR < 0.01 (n = 111 for cells, n = 92 for tumors). d Illustration of the GO BP gene sets found enriched in the DE genes in SK-N-Be2c cells upon JQ1-mediated MYCN shutdown. RNAseq data of SK-N-Be2c cells treated with JQ1 during 24 h or DMSO as control were uploaded (GSE80154, see “Methods”). Genes with False Discovery Rate (FDR) < 0.05 and absolute value (av) of log2(FC) ≥ 1 were considered as DE. Data are reported as the repartition (in %) of the diverse pathways identified with a FDR < 0.01 (n = 38).
Fig. 5
Fig. 5. Identification of a TWIST1-associated gene signature correlating with poor prognosis in NB.
a Heatmap showing 763 common genes either correlated or anticorrelated with TWIST1 in NB patients and DE in the ortho_1 tumors, and volcano plot showing the distribution of the 489 genes of the TWIST1-signature according to their log2(FC) in SK-N-Be2c ortho_1 tumors and R values in the SEQC dataset. The binary side color bar going from green to red indicates DE genes anti-correlated (R < −0.225, green) or correlated (R > 0.225, red) with TWIST1 in the SEQC dataset. The black bar shows the genes that have both FC and R values either positive or negative representing the TWIST1-signature, and the gray bar the genes that have opposite FC and R values (not included in the signature). b Heatmap hierarchical clustering showing different expression pattern relative to TWIST1-signature genes generated using the R2 Platform (http://r2.amc.nl). Columns represent patients annotated in the SEQC cohort; the 489 genes are clustered hierarchically along the left y-axis. Clinical criteria taken into consideration (risk groups, tumor stages, and MYCN amplification status) are indicated on the top by color codes. The heat map indicates in red, blue, and white a high, low, and a medium level of gene expression (z-score), respectively. The blue-white-red color bars depicted at the bottom of the heatmap represent the z-score of TWIST1_Up and TWIST1_Down gene sub-lists of the signature, as well as for the z-score of the whole signature (weighted). c Kaplan−Meier OS and EFS survival curves according to the expression level of the TWIST1-signature in both the SEQC and Kocak datasets, in the complete cohorts and in sub-cohorts of patients without MNA (no-MNA). Expression cutoff in the SEQC: 0.20 for OS curves; −0.05 for EFS curves. Expression cutoff in the Kocak: 0.03 for all curves.
Fig. 6
Fig. 6. Validation of TWIST1-mediated deregulation of selected genes belonging to the TWIST1-signature in the ortho_1 tumors.
a Bar plots showing the distribution of the top 20 up- and 20 downregulated genes of the TWIST1-signature ordered according to their log2(FC). In black, genes that were selected for the validation at both RNA and protein levels. Gene names in brackets indicate up-regulated genes involved in the EMT process, TME organization, proliferation, and apoptosis; and downregulated genes that are known to be tumor suppressor genes or associated with good prognosis in NB. Right panel: heatmap showing the relative RNA expression (z-score) determined by RNAseq of the selected genes in ortho_1 tumors. b RNA expression levels of the TWIST1 target genes relative to the reference gene HPRT1 in the ortho_1 tumors analyzed by RT-qPCR are plotted as individual values with mean ± SD. Control n = 6; sgTWIST1 n = 4. Mann−Whitney test: *p = 0.0286 for all comparisons. c Immunoblotting for TRIM28, ADAMTS19, PCOLCE, ADAMTS19, SYT13, and PIRT (ACTB as the loading control) and densitometric quantifications of immunoreactive band densities. Expression relative to ACTB was plotted as individual data with mean ± SD. Control n = 5; sgTWIST1 n = 4. Mann−Whitney test: *p = 0.0317 for ADAMTS19; *p = 0.0159 for the other proteins.
Fig. 7
Fig. 7. Identification of a TWIST1-mediated-tumor-stroma signature associated with poor outcome in NB.
a Bar plot illustrating of the 77 DE genes representing the TWIST1-tumor-stroma signature in SK-N-Be2c ortho_1 tumors. Genes were classified according to their log2(FC) in three main categories: growth factors (including the TGF and FGF families) cytokines (TNF and IFN families, chemokines and interleukins), and integrins and their ligands (ITG, collagens and laminins). b Kaplan−Meier OS and EFS curves of NB patients of the SEQC dataset according to the expression level of the TWIST1-tumor-stroma signature. Expression cutoff for both curves: 0.10. c Volcano plot showing the distribution of the DE protein secreted by SK-N-Be2c cells according to the delta label-free quantification (∆LFQ = LFQ SK-N-Be2c Control – LFQ SK-N-Be2c sgTWIST1) intensities (Log2) and the adjusted p values with an FDR ≤ 0.02 analyzed by LC-MS/MS (n = 3 biological replicates for each group). d 3D scatterplot showing DE terms in the cell secretome in common with the tumor transcriptome (magenta, n = 55), the cell transcriptome (green, n = 75), or both transcriptomes (blue, n = 131). e Bar plot showing the terms commonly deregulated between the TWIST1-tumor-stroma signature and both the cell transcriptome and secretome. Names in brackets are for terms found to be DE in the secretome but not in the transcriptome of cells.
Fig. 8
Fig. 8. Identification of a TWIST1-associated myofibroblast signature and PPI network for the TWIST1-associated tumor-stroma signature and the DE stromal genes.
a Volcano plots showing the distribution of the DE gene identified in SK-N-Be2c-Control and –sgTWIST1 tumor stroma of ortho_1 xenografts relative to their log2(FC) and adjusted p value (FDR). Genes with FDR < 0.05 and absolute value (av) of log2(FC) ≥ 0.5 were considered as DE. Genes identified as the Myofibroblast signature are indicated in red (n = 36). The green square is for the gene Marco. b Bar graph showing the biological processes, cellular components, and REACTOME pathways identified by GO analysis of the 89 DE genes of the murine stroma, listed according to their adjusted p value. c mRNA expression levels of the selected myofibroblast genes and Marco relative to Actb as by RT-qPCR. Data are plotted as individual values with mean ± SD. Mann− Whitney test: *p = 0.0286. Ortho_1 Control and sgTWIST1 tumors: n = 4. d IHC for the cancer-associated fibroblast marker Fibroblasts Activation Protein (FAP) on ortho_1 Control and sgTWIST1 tumors. Representative images of FAP positive cells characterized by spindle or fusiform morphologies and haphazardly arranged are shown (400×, scale bar: 20 µm). e Analysis of the protein−protein interactions between the TWIST1-tumor stroma signature (n = 77 genes) and the DE murine stromal genes (n = 89). Direct (physical) as well as indirect (functional) interactions analyzed using the String website. All the basic and advanced default settings have been kept but the minimum required interaction score, that has been changed in high confidence (0.7); and the network display options, hiding the disconnected nodes in the network. PPI enrichment p value: <1.0e−16. Murine stromal genes clustering with the TWIST1 tumor-stroma signature are underlined in black.

References

    1. Maris JM. Recent advances in neuroblastoma. N. Engl. J. Med. 2010;362:2202–2211. - PMC - PubMed
    1. Brodeur GM. Neuroblastoma: biological insights into a clinical enigma. Nat. Rev. Cancer. 2003;3:203–216. - PubMed
    1. Ritenour LE, Randall MP, Bosse KR, Diskin SJ. Genetic susceptibility to neuroblastoma: current knowledge and future directions. Cell Tissue Res. 2018;372:287–307. - PMC - PubMed
    1. Cheung NK, Dyer MA. Neuroblastoma: developmental biology, cancer genomics, and immunotherapy. Nat. Rev. Cancer. 2013;13:397–411. - PMC - PubMed
    1. Janoueix-Lerosey I, et al. Overall genomic pattern is a predictor of outcome in neuroblastoma. J. Clin. Oncol.: Off. J. Am. Soc. Clin. Oncol. 2009;27:1026–1033. - PubMed

Publication types