. 2022 Feb;602(7895):123-128.
doi: 10.1038/s41586-021-04268-7. Epub 2022 Jan 12.

Toroidal topology of population activity in grid cells

Affiliations

Toroidal topology of population activity in grid cells

Richard J Gardner et al. Nature. 2022 Feb.

Abstract

The medial entorhinal cortex is part of a neural system for mapping the position of an individual within a physical environment1. Grid cells, a key component of this system, fire in a characteristic hexagonal pattern of locations2, and are organized in modules3 that collectively form a population code for the animal's allocentric position1. The invariance of the correlation structure of this population code across environments4,5 and behavioural states6,7, independent of specific sensory inputs, has pointed to intrinsic, recurrently connected continuous attractor networks (CANs) as a possible substrate of the grid pattern1,8-11. However, whether grid cell networks show continuous attractor dynamics, and how they interface with inputs from the environment, has remained unclear owing to the small samples of cells obtained so far. Here, using simultaneous recordings from many hundreds of grid cells and subsequent topological data analysis, we show that the joint activity of grid cells from an individual module resides on a toroidal manifold, as expected in a two-dimensional CAN. Positions on the torus correspond to positions of the moving animal in the environment. Individual cells are preferentially active at singular positions on the torus. Their positions are maintained between environments and from wakefulness to sleep, as predicted by CAN models for grid cells but not by alternative feedforward models12. This demonstration of network dynamics on a toroidal manifold provides a population-level visualization of CAN dynamics in grid cells.


Conflict of interest statement

The authors declare no competing interests.

Figures

Fig. 1
Fig. 1. Signatures of toroidal structure in the activity of a module of grid cells.
a, Firing rates of 149 grid cells co-recorded from the same module and shown, in order of spatial information content, as a function of rat position in OF arena (rates colour-coded, max 0.2–35.0 Hz; rat ‘R’ day 1, module 2; Extended Data Fig. 2b). b, Nonlinear dimensionality reduction reveals torus-like structure in the population activity of a single grid module (same 149 cells; 3 different views of same point cloud). Each dot represents the population state at one time point (dots coloured by first principal component). Bold line shows a 5-s trajectory, demonstrating smooth movement over the toroidal manifold. Right, corresponding trajectory in OF. c, Toroidal positions of spikes from three grid cells from the module in a. Each panel shows the same 3D point cloud of population states as in b, with black dots indicating when the cell fired. Insets show: left: the cell’s 2D firing locations in OF (black dots on grey trajectory); middle: colour-coded firing rate map in OF (range 0 to max); right: colour-coded autocorrelogram of the rate map (range −1 to +1). Maximum rate and grid score (GS) are indicated. d, Same as in c (same cells) but with the rat running on an elevated, wheel-shaped track (‘wagon-wheel track’; WW). Note preserved toroidal field locations. e, f, Barcodes indicate toroidal topology of grid-cell population activity. Results of persistent cohomology analyses (30 longest bars in the first three dimensions: H0, H1 and H2) are shown for three grid modules from one rat (R1–R3 day 1, n = 93, 149 and 145 cells, respectively), in OF (e) and WW (f). Grey shading indicates longest lifetimes among 1,000 iterations in shuffled data (aligned to lower values of original bars). Arrows show four most prominent bars across all dimensions (all longer than in shuffled data). One prominent bar in dimension 0, two in dimension 1 and one in dimension 2 indicates cohomology equal to that of a torus. Source data
Fig. 2
Fig. 2. Cohomological decoding of position on an inferred state space torus.
a, b, Individual grid cells have distinct firing fields on the inferred torus (Extended Data Fig. 5). Toroidal coordinates for population activity vectors were decoded from the two significant 1D holes (red circles in a) in the barcodes in Fig 1e, f. a, Left, 3D embedding of the toroidal state space displaying colour-coded mean firing rate of one grid cell as a function of toroidal position. Right, a 2D torus may be formed by gluing opposite sides of a rhombus. b, Representative grid cells from module R2 day 1 showing tuning to toroidal coordinates (all R2 cells: Supplementary Fig. 1). Each row of four plots corresponds to one cell. Left to right, colour-coded maps of cells’ firing rates across the environment (OF or WW) and on the inferred torus (toroidal OF, toroidal WW, aligned to common axes). c, d, Toroidal information content (c) and explained deviance (d) for toroidal position (T) versus spatial position (S) in OF (top) and WW (bottom). Explained deviance is an R2-statistic (range 0–1) expressing goodness-of-fit of GLM models for S or T. Left, scatterplots with dots showing individual cells; colour indicates module (inset). Right, mean ± s.e.m. for each module. n = 93 (R1), 149 (R2), 145 (R3), 94 (Q1), 65 (Q2) and 73 (S1) cells. e, f, Distances between toroidal firing field locations. e, Field locations of all R2 cells in OF and WW. Lines connect fields of the same cell. Toroidal OF and WW axes were aligned either separately (‘separate’) or commonly to OF (‘common’). f, Left, cumulative frequency distribution of field distances (all R2 cells; green curve, separate alignment; grey lines, common alignment (to either OF or WW); black curve, shuffled data, n = 1,000 shuffles). Right, mean distance between field centres (±s.e.m.) for all modules. n cells as in c, d. g, Same as f, but showing Pearson correlations between pairs of toroidal rate maps. Source data
Fig. 3
Fig. 3. Preservation of toroidal structure during sleep.
a, Barcodes indicating toroidal topology for grid-cell module R2 day 2 (n = 152 cells) during REM sleep and SWS (as in Fig. 1e, f). b, Toroidal rate maps showing preserved toroidal tuning for individual cells across environments and brain states (as in Fig. 2b; all cells shown in Extended Data Fig. 10). From left: rate map for OF in physical coordinates; and rate maps for OF, REM sleep and SWS in toroidal coordinates. c, Distribution of toroidal field centres (as in Fig. 2e) in OF and sleep (n as in a). d, e, Left, cumulative distributions of distances between toroidal field centres (d) and Pearson correlation r values (e) of rate maps for all R2 grid cells, as in Fig. 2f, g, but comparing OF with REM or SWS. Right, mean value ± s.e.m. for all modules. n = 111 (R1), 152 (R2), 165 (R3), 94 (Q1), 65 (Q2) and 72 (S1) cells. n = 1,000 shuffles. Source data
Fig. 4
Fig. 4. Differential toroidal tuning of grid-cell subpopulations.
a, Barcode of all pure R1 grid cells (day 2, n = 111 cells) does not indicate toroidal structure during SWS. b, Matrix of cosine distances between pairs of spike-train autocorrelograms of grid cells in module R1. Rows and columns show 189 grid cells (pure and conjunctive) sorted by cluster identity. Three clusters were identified, appearing as dark (that is, similar) squares along the matrix diagonal. On the basis of temporal firing patterns (e), they were named ‘bursty’ (B), ‘theta-modulated’ (T) and ‘non-bursty’ (N). c, Barcode of the ‘bursty’ class of R1 (n = 69 cells) indicates toroidal structure. Symbols as in a. Arrows point to the four most persistent features. d, Fractions of grid cells in each class, shown for each grid module. Left, pure grid cells only, right, conjunctive grid × head-direction cells only. For n see Extended Data Fig. 2g. e, Average temporal autocorrelogram for cells in each class. Shaded area shows mean ± s.e.m. (bursty n = 523, theta-modulated n = 229, non-bursty n = 95 cells). For each class, note short-latency peak (burst-firing) and long-latency peak (theta-modulation). f, Average spike template waveforms of cells from each class (n as in e). Shaded area indicates mean ± s.e.m. g, Cell classes have different burst-firing characteristics, as expressed by latency of first autocorrelogram peak (x axis) and peak-to-peak spike width (y axis). Cells (dots) are colour-coded by class (n as in e) or by identity (pure or conjunctive, n = 659 or 188 cells, respectively). h, Example cells from each class (one row of plots per cell). Plots from left to right: OF firing rate map; head-direction (HD) tuning curve (black) compared to occupancy of head directions (light grey); temporal autocorrelogram; toroidal firing rate maps for OF, REM and SWS. Source data
Extended Data Fig. 1
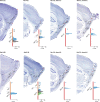
Extended Data Fig. 1. Nissl-stained sagittal brain sections showing recording locations for rats Q, R and S.
Red arrows indicate the dorsoventral range of the probe’s active recording sites (corresponding to the yellow stripe in the inset). Stippled lines indicate borders between brain regions (MEC, medial entorhinal cortex; PaS, parasubiculum, PrS, presubiculum; PoR, postrhinal cortex). Layers are indicated for MEC (MECII, MECIII). Animal name, hemisphere (L, left; R, right) and shank number (for Rat 'S') are indicated in text above each section. Insets show, for each section, the number of grid cells recorded at each depth on the probe shank (histogram bin sizes 100 μm for Rats 'Q' and 'R', 75 μm for Rat 'S'; total numbers of cells are given in Extended Data Fig. 2g). Only the implanted portion of the probe shank is shown. Counts are colour-coded according to module identity. Module R1 is subdivided into the two UMAP clusters R1a and R1b (as shown in Extended Data Fig. 2), shown here as two stacked histograms. The yellow stripe on the probe shank indicates the range of active recording sites. The indicated locations of units are subject to measurement error, because the anatomical registration of probe shanks can only be approximately estimated, and furthermore because units may be detected on electrodes up to 50 µm away. Note that several modules spanned across hemispheres (see Extended Data Fig. 2g). The cell counts shown for Rat 'R' are from Recording Day 1. The same set of recording sites was used for both recording sessions, and therefore the anatomical distributions of recorded cells were similar between the two sessions. Source data
Extended Data Fig. 2
Extended Data Fig. 2. Grid module identification and properties.
ad, Clustering of grid modules (a, Rat 'Q'; b, Rat 'R', day 1; c, Rat 'R', day 2; d, Rat 'S'). For all experiments, coarse spatial autocorrelograms were first calculated from all cells’ OF firing rate maps (n cells as shown in g). UMAP was then used to reduce the M-dimensional autocorrelograms (where M = 668 spatial bins) to a two-dimensional point cloud, where each point represented the autocorrelogram of a single cell, and distances between points represented the similarity between autocorrelograms. Left scatterplot in ad: 2D point cloud, with points colour-coded according to cluster ID. Clusters were identified by applying the density-based clustering algorithm DBSCAN to the 2D point cloud. In every recording, the largest cluster (in grey, labelled “main”) comprised mainly non-grid cells, and the remaining smaller clusters (coloured) represented different modules of grid cells. The black crosses (“noise”) are identified as outlier data points. The well-isolated clusters formed by grid cells support the notion that these cells are a distinct functional class, in contrast to the claim that grid-like characteristics are expressed by MEC cells to different extents. Right pair of scatterplots in ad: Combinations of three grid parameters (grid score, grid spacing and grid orientation) for co-recorded cells from each recording. Each dot corresponds to one autocorrelogram (one cell). Dots are coloured by cluster ID as in a. e, Comparison of grid-cell spatial periodicity in the open-field arena (OF) and on the wagon-wheel track (WW). Top: firing rate map and corresponding autocorrelogram for an example grid cell in OF (left) and WW (right). For the purposes of this comparison, the same position bins were applied to both environments, resulting in cropping of the outermost parts of WW. Colour coding as indicated by scale bar; peak rates 16.1 Hz (OF) and 15.8 Hz (WW); range of autocorrelation values: −0.56 to 0.83 and −0.58 to 0.71, respectively. Note the more irregular appearance of the autocorrelogram for WW. Bottom: scatter plots showing grid scores of all grid cells in OF (x axis) and WW (y axis). Colours refer to the module assignment in a. Note the bias for points to lie in the lower-right quadrant, reflecting generally higher grid scores in OF than in WW. f, As for e, but controlling for differences in behavioural coverage of OF and WW environments. It is possible that the lower WW grid scores in e were a product of sparser behavioural coverage of the WW environment (animals visited only positions on the track). To control for this possibility, we created “masked OF” (MOF) rate maps by removing spatial bins from the original OF rate map which were not visited by the animal in WW. In all modules, grid scores in the “masked” OF condition were higher than in WW (grid score mean ± S.E.M. across all cells: OF: 0.677 ± 0.017, WW: 0.360 ± 0.017, N = 618 cells, P values for the 6 modules ranged from 1.26 × 10⁻¹⁴ to 0.03, Z-values ranged from 2.12 to 7.71, Wilcoxon signed-rank test). Top row shows the same example cell as in e after leaving the same subset of position bins in OF as in WW. Bottom row shows comparison of grid scores for MOF and WW. As in e, grid scores are lower for WW, indicating that grid periodicity is reduced in WW even when differences in spatial coverage are accounted for. g, Table showing total number of cells and number of pure grid cells and conjunctive grid × direction cells. h, Number of cells (as in g) broken down on recording sessions, with session lengths in minutes indicated for open field (OF), wagon wheel (WW), slow-wave sleep (SWS) and REM sleep. Source data
Extended Data Fig. 3
Extended Data Fig. 3. Preprocessing steps for visualization and detection of toroidal topology.
A, Flow diagram showing method for extracting low-dimensional embeddings of neural activity. The animal foraged in an OF arena while spikes from 149 grid cells shown in Fig. 1a were recorded (Aa; cells are ordered arbitrarily). A 5-second example behavioural trajectory is highlighted, with colour indicating elapsed time. The spike trains were binned in time (N bins) and then smoothed and normalized, yielding a matrix of N-dimensional population activity vectors (Ab). After temporally downsampling and z-scoring the neural activity, PCA was applied to the N-dimensional neural activity, yielding a six-dimensional linear embedding (Ac). This preserved the grid structure in the activity (Extended Data Fig. 4b, c), while mitigating drawbacks associated with high-dimensional spaces (the “curse of dimensionality”). The six principal components were then passed through a second, nonlinear, dimensionality reduction step by UMAP, which generated a three-dimensional nonlinear embedding (Ae(i)) allowing the toroidal structure to be visualized. UMAP consists of two steps: first, a fuzzy topological graph representation is constructed (i.e. a “Uniform Manifold Approximation” - UMA) using a distance metric in the high-dimensional space (Ad); second, to obtain the lower-dimensional projection (P), the coordinates of corresponding points in fewer dimensions are optimized to have a similar fuzzy topological representation. In the persistence analysis, we applied persistent cohomology to the fuzzy topological representation of the high-dimensional point cloud (Ae(ii)) and subsequently used cohomological decoding to obtain a two-dimensional projection of the original N-dimensional point cloud (Ae(iii); right, showing a 5-second snippet; left, embedded in 3D, points are coloured by each angular coordinate, whose direction is indicated by a red arrow). B, Cohomology can help differentiate topological spaces such as the union of three discs (upper left), a circle (upper right), a sphere (lower left) and a torus (lower right) by counting the number of topological holes (𝛽) in different dimensions. A disc has a 0D hole (a connected component); a circle additionally has a 1D hole; a (hollow) sphere is a connected component and has a 2D hole (a cavity); a torus is a connected component with two 1D holes (illustrated with red circles) and one 2D hole (a cavity in the interior of the torus). C, Persistent cohomology tracks the lifetime of topological holes in spaces associated with point clouds. Top: The radius of balls centred at each data point in the point cloud is continuously increased (left to right). The union of the balls forms a space with possible holes. The lifetime of a hole during expansion of the radius is defined as the radial interval from when the hole first appears until it is filled in. Note the short lifetime of the hole marked with a red circle and the long lifetime of the hole indicated with a yellow circle. Second and third row: The lifetime of each hole of dimension zero (H0) and one (H1) in the example in the top row is indicated by the length of a bar (in green) in the barcode diagram. Two 1D holes are detected: the first bar, corresponding to the red hole in the top row, is short and regarded as noise, and the second, corresponding to the yellow hole, is substantially longer and captures the prominent topology of the point cloud. Source data
Extended Data Fig. 4
Extended Data Fig. 4. Analysis of principal components, number of cells and number of toroidal peaks.
a, Variance explained by the first 15 principal components (PCs) after applying PCA to the n-dimensional neural activity, shown for each module. Note that during OF, a particularly large amount of variance is explained by the first 6 PCs, followed by a sharp drop in the 7th PC, in all modules. A drop in variance explained is also seen after the 6th PC in REM and SWS. b, The first six PCs contain a grid-like representation at the population level. Each panel shows the mean value of one PC as a function of the animal’s position in the OF. PC value is colour-coded as indicated by the scale bar. The 8 first PCs are arranged in descending order of explained variance (columns, from left to right), and are shown for each module (in rows). Note the presence of grid-like structure, which is particularly strong in the first six PCs, irrespective of the grid spacing. These six grid-like PCs correspond to the set with the highest explained variance in a. z-scored PC values are indicated by the scale bar (see Supplementary Methods for theoretical explanation of the six-dimensionality). c, Line plots showing the goodness-of-fit of a Gaussian GLM model based on the position in the spatial environment (OF) fitted to each principal component (components as in a). This is measured (as in Fig. 2d) as the explained deviance of the model showing that the six first components are better explained by space than the subsequent components for each module. d, Line plots showing the lifetime of the two longest-lived H1-bars (longest-lived – “1st”, black; second longest-lived – “2nd”, blue) divided by the lifetime of the third longest-lived H1-bar as a function of number of principal components kept in the persistence analysis of R1 day 1 OF (n = 93 cells). This heuristic measures how clearly the two longest-lived H1-bars (expected to be long for a torus) separates from the third (expected to be short), thus indicating how clearly the barcode displays toroidal topology. This is clearly the case when using 6 principal components in this dataset. e, The percentage of subsamples of R2 (resampled randomly 1,000 times per number of cells; total n = 149 cells) for which toroidal structure was detected in the parameterization given by the two most persistent 1D bars in the barcode (as in Extended Data Fig. 5). Note that approximately 60 cells were needed for the probability of detecting toroidal structure exceed 50%. f, Effect of varying spatial smoothing on the number of peaks in toroidal rate maps. The y axis displays the percentage of single-peaked (black) and multi-peaked (blue) toroidal rate maps of all grid cells (n = 2,727 cells) pooled across modules and behaviour conditions. The vertical dashed line marks the smoothing width used in Extended Data Fig. 10, and the horizontal dashed line marks 100%. Note that cells with single peaks quickly describe the majority of the pooled cells. Source data
Extended Data Fig. 5
Extended Data Fig. 5. Mapping of decoded circular coordinates onto the open field allows geometrical interpretation of toroidal structure.
a, Top row: Toroidal coordinates given by cohomological decoding from activity of grid module R2 during OF foraging, mapped onto the recording box. In each plot, colour indicates the mean value of the cosine of each of the two circular coordinates. The mappings of both coordinates show 2D striped patterns, with similar periods but distinct angles. Bottom row: A cosine wave is fitted to each coordinate to obtain the direction of the toroidal axes. The period and angle of the cosine wave in the plane may be represented by spatial vectors, v and w, with corresponding length and orientation. Note the clear transversality of the two circles, expressed in the directions of the two vectors, further confirming the toroidal identification of the data. b, The periods and angles of the cosine waves in a reflect the scale and orientation of the grid module. Taking the origin of the vectors in a to be alike, we see that the vectors span a parallelogram with approximately equal side lengths (0.67m and 0.72m) and an angle of 60 degrees, suggesting a rhomboidal tile representing the toroidal structure (top left). When repeated across the environment, the tile depicts the hexagonal grid pattern of the grid-cell module, confirming that the product of the two decoded circles defines a hexagonal (“twisted”) torus. As the orientation of the circular coordinates is arbitrary, the directions of the axes may be any of the following: reversely oriented (blue arrows), a different 60-degree pair of axes (green), or have a relative angle of 120 degrees (yellow). c, Rhombi of each module for each OF session (n cells as in Extended Data Fig. 2g), given by the cosine wave fitted to the toroidal coordinates (as in b). The toroidal parametrizations were obtained independently in different behavioural conditions (colour-coded), then used to decode the module’s activity during OF foraging, and subsequently mapped as a function of the rat’s position in the environment (see f). Positions of downsampled spikes from example cells of each module are shown in greyscale to illustrate grid scale and orientation. The consistent angle and side lengths suggest the geometry of the rhombus is retained across brain states and environments, with a constant scale relationship between modules. d, Mean value of a single neuron in rhomboidal coordinates displays a single bump (as in Fig. 2a), which, when repeated and arranged to tesselate a 2D surface, reveals a grid-like pattern in the activity of the grid cell, akin to its spatial firing. e, Table of side lengths and angles of the cosine waves that form the rhombi in c, shown for each grid module and each condition (n cells as in Extended Data Fig. 2g). f, Visualization of the cohomological decoding of toroidal coordinates as a function of physical space (one visualization for each grid module during each condition, with the toroidal parametrizations aligned to the same axes before creating the rate maps; n cells as in Extended Data Fig. 2g). All barcodes which indicated toroidal structure exhibited periodic stripes in the OF, with phase and orientation corresponding to the two-dimensional periodicity of the grid pattern of the respective module. SWS* refers to the decoding when considering only “bursty” (B) cells of R1 as given by the correlation clustering method described in Fig 4b. Source data
Extended Data Fig. 6
Extended Data Fig. 6. Barcodes and toroidal tuning statistics for grid modules or recording sessions not included in Figs. 2–4.
Data are shown for six grid-cell modules: R1, R3, Q1, Q2, S1 and R2 (n cells as in Extended Data Fig. 2g). Toroidal structure is clearly present across environments and behavioural states. Aa–Ad, Barcode diagrams (as in Fig 1e, f) showing the results of the persistent cohomology analysis on open-field (OF), wagon-wheel track (WW) or sleep (REM or SWS) data. Ba–Bc, Preservation of toroidal field centres between conditions: OF vs WW (1), OF vs REM (2) OF vs SWS (3). Top row in each panel: Distribution of grid cells’ receptive field centres on the inferred torus for OF and WW as well as sleep states, similar to Fig 2e. Each dot signifies the field centre of an individual grid cell. Grey lines connect field centres of the same cell across conditions. Note the proximity of red-black pairs (after separate alignment for the two recording sessions of each panel). Middle and bottom rows: Cumulative distributions showing stability of grid cells’ toroidal tuning between brain states, as in Fig. 2f, g. Distributions show peak field distance (middle) and Pearson correlation of pairs of toroidal rate maps (bottom). Labelling as in Fig. 2e–g. C, Top: Histograms of the information content carried by individual cells’ activity about position on the inferred torus during REM (left) and SWS (right). Counts (fractions of the cell sample) are shown as a function of information content (in bins of 0.28 bits/spike) for all grid modules (colour-coded). The vertical dashed line (close to zero) shows mean information content for shuffled distributions (n = 1,000 shuffles). The majority of cells have a higher information content. Bottom: Explained deviance of a GLM model fitted to the spike count with toroidal coordinates during REM (left) and SWS (right) as regressor. Distributions show counts (fractions of the cell sample) as a function of explained deviance, in bins of 0.035, for all grid modules. Values larger than 0 indicate that the fitted model explains the data better than a null model that assumes a constant firing rate. Source data
Extended Data Fig. 7
Extended Data Fig. 7. Barcodes and decoding of simulated firing activity for two grid-cell CAN models (with no noise), and for two point clouds randomly sampled on a hexagonal and a square torus.
a, Persistent cohomology analysis of a simulated grid-cell network based on the CAN model from Couey et al (2013) during OF foraging. Left: Colour-coded firing rates for a single time frame of the 56 × 44 grid cells, shown at their respective positions on the neural sheet. Middle: Barcode of the simulated data. Arrows point to one 0D, two 1D and one 2D bar with long lifetimes, indicating toroidal structure. Right: Each coordinate of the toroidal parametrization of the two longest lived 1D features is mapped onto the spatial trajectory, colour-coded by its cosine value (as in Extended Data Fig. 5a, f). The resulting striped patterns of the two maps are oriented approximately 60 degrees relative to each other, as expected from a hexagonal torus network structure (see d). b, Analysis of a random sample of 100 grid cells (of a total of 400 cells) of a simulated grid cell network, using the twisted torus CAN model formulated by Guanella et al (2007). Left: Firing rates of the cells in the network at a single time frame. The model generates a single bump of activity based on both inhibitory and excitatory, asymmetric connections representing a twisted torus. Barcode (middle) and cohomological decoding of toroidal position (right) are shown as in a. The barcode shows four prominent bars: one 0D bar, two 1D bars and one 2D bar, similar to that of a torus. Note that the pair of stripes in toroidal coordinates are oriented 60 degrees relative to each other. c, d, To verify the expected barcodes and decoding of a torus and compare with both real and synthetic grid cell data, we performed the same topological analysis on point clouds sampled from two idealized toroidal parametrizations (n = 2,500 points): a 4D description of a square torus (c) and a 6D embedding of a hexagonal torus (d). Left: Representing the firing of a cell as a Gaussian function centred at a single toroidal coordinate on the toroidal sheet results in a square (c) and hexagonal (d) firing pattern, when arranged to tesselate a 2D surface. Middle: The expected barcode of a torus (one 0D, two 1D, and one 2D bar clearly longer than the other bars) is seen in both cases. Right: each sampled angle is coloured according to the decoded toroidal coordinates. Note the difference in the relative angle of the pair of stripes between the square and the hexagonal torus. Source data
Extended Data Fig. 8
Extended Data Fig. 8. Subpopulations of grid cells with different temporal spiking statistics have different degrees of toroidal selectivity.
a, Geometry of grid-cell pattern of all six modules with classes of grid cells (B, bursty; T, theta-modulated; N, non-bursty; as defined in Fig. 4). Each plot shows the locations of the innermost six peaks of the spatial autocorrelogram for every grid cell in one module. Each dot indicates the position of one peak from one cell (total of 6 dots per cell); dots are coloured by the cell’s class. The grey crosshair indicates the centre of the autocorrelogram. b, Correlation matrix showing pairwise correlation of firing rates for all grid cells belonging to S1 (left; n = 73 cells) and R1 (right – same data as for autocorrelogram distance matrix in Fig. 4b; n = 111 cells). Correlation is colour-coded according to the scale bar, with minimum and maximum defined as the 1st and 99th percentile, respectively, of the pairwise correlation distribution for each module. Rows and column (cells) are ordered according to class, as assigned by the clustering analysis shown in Fig. 4. Each cluster displays strong inner correlation structure for both modules during SWS. Cluster boundaries are indicated on the x axis of the correlation matrix. c, Summary of pairwise correlations of SWS activity for grid cells in modules R1 and S1, shown according to cell class. In each matrix plot, rows and columns indicate cell classes, and each element represents all pairs of grid cells from the classes corresponding to the row and column. Matrix elements are colour-coded to represent (top) the median of the spike train Pearson correlation r value across all cell pairs, (middle) Spearman rank correlation between cell pairs’ grid (toroidal) phase offsets and their spike train Pearson correlation r values, (bottom) same as middle, but for head-direction phase instead of grid phase. Number of cell pairs were as follows: module R1, B-B 2346, B-T 6348, B-N 1932, T-T 4186, T-N 2576, N-N 378; module S1 B-B 378, B-T 1680, B-N 1456, T-T 1770, T-N 3120, N-N 1326. Note that, in agreement with the topological analyses, the correlation between cell pairs’ grid phases and their spike-time correlations are weaker for theta-modulated cells than non-bursty and particularly bursty cells. This drop is explained by an increase in the correlation with head direction, suggesting, as expected in conjunctive cells, that head direction accounts for much of the variation in these cells, unlike the other classes. Furthermore, the median spike correlation for pairs of theta-modulated and non-bursty cells is higher than for bursty cells, indicating a stronger positive correlation bias, consistent with more global fluctuations of activity in these populations. d, Cumulative distributions showing distance between toroidal field centres (upper) and Pearson correlation r values (lower) for toroidal rate maps of grid cells in each class as in Fig. 2f, g, but here comparing awake behaviour in OF with SWS, n cells = 523(B), 229(T) and 95(N) cells for OF and 495(B), 169(T), 43(N) cells for REM and SWS. n = 1,000 shuffles. e, Cumulative distributions showing toroidal explained deviance (left) and information content (right) for all grid cells in each class – bursty (B), theta-modulated (T) and non-bursty (N) – and for each of three conditions – OF, REM and SWS. Cells are from all modules. n cells as in d. f, Barcode of T-class grid cells from modules R1 (left; n = 92 cells) and S1 (right; n = 60 cells) during SWS reveals a single prominent long-lived H1 bar (indicated by black arrow). g, Cohomological decoding of the longest-lived H1 bar in each barcode in f reveals strong correlation with recorded head direction. Recorded head direction (black) and decoded direction (blue) are shown as a function of time (total snippet length 10 s). Source data
Extended Data Fig. 9
Extended Data Fig. 9. Classification of sleep and wake states based on behavioural and neural activity during rest sessions.
A, Example traces of MEC multi-unit activity (upper; coloured lines), and rasters of spike times of 444 grid cells (lower; black dots) recorded from rat 'R' during OF foraging, REM sleep and slow-wave sleep (SWS). Cells are ranked from top to bottom by the number of spikes fired during the example time window. Note the presence of regular theta waves (5–10 Hz) during OF and REM, and presence of slower, more irregular fluctuations between active "up-states" and silent “down-states” during SWS. Middle: times of population activity vectors (calculated in 10 ms time bins) which were selected for persistent cohomology analysis, for each module (R1-R3). Each dot indicates a vector which was included in the initial downsampled set of 15,000 vectors with the highest mean firing rate across cells in the module. Vertical ticks indicate the subset of these vectors which were retained after using a density-based method to reduce the data to a representative point cloud. Note that during SWS, all of the selected population activity vectors occurred during up-states. B, Classification of sleep/wake states based on behavioural and neural activity during rest sessions. Each of the three horizontal blocks shows a recording from one animal. Rat 'R' day 1 did not contain a rest session and is not shown on this figure. Ba, Detection of REM and SWS sleep epochs in the rest session. The plots show the time courses of the three variables used for detecting REM and SWS epochs. Top panel of each block: animal locomotion speed; middle panel: the animal’s head angular speed; bottom panel: the ratio of the amplitude of theta (5–10 Hz) and delta (1–4 Hz) frequency bands in the multi-unit spiking activity (theta/delta ratio, TDR). Bb, Log-power spectra of MEC multi-unit activity during each sleep/wake state. The line and shaded area indicate the mean and 95% bootstrap confidence intervals, calculated across time windows (confidence intervals are narrow). Note the pronounced peak corresponding to the theta band (5–10 Hz) during OF and REM, and the higher power in the delta band (1–4 Hz) during SWS. Bc, Histograms showing distributions of firing rates for all grid cells during each sleep/wake state (number of grid cells: rat 'Q' 159, rat 'R' 428, rat 'S' 72). C, Table showing total time and median bout length of recorded sleep for each animal. Source data
Extended Data Fig. 10
Extended Data Fig. 10. Tuning to coordinates in space and on the inferred torus for all grid cells of module R2 (separated into pure and conjunctive categories) on recording day 2.
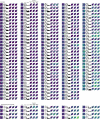
Plots show all 152 cells in module R2, a subset of which is shown in Fig. 3b. Plots from left to right: OF firing rate map, head-direction tuning curve (black) compared to occupancy of head directions (light grey), temporal autocorrelogram, toroidal firing rate maps for OF, REM and SWS. The full set of plots, for all remaining grid cells of all recordings, is shown in Supplementary Information. Source data

References

    1. McNaughton BL, Battaglia FP, Jensen O, Moser EI, Moser M-B. Path integration and the neural basis of the ‘cognitive map’. Nat. Rev. Neurosci. 2006;7:663–678. - PubMed
    1. Hafting T, Fyhn M, Molden S, Moser M-B, Moser EI. Microstructure of a spatial map in the entorhinal cortex. Nature. 2005;436:801–806. - PubMed
    1. Stensola H, et al. The entorhinal grid map is discretized. Nature. 2012;492:72–78. - PubMed
    1. Fyhn M, Hafting T, Treves A, Moser M-B, Moser EI. Hippocampal remapping and grid realignment in entorhinal cortex. Nature. 2007;446:190–194. - PubMed
    1. Yoon K, et al. Specific evidence of low-dimensional continuous attractor dynamics in grid cells. Nat. Neurosci. 2013;16:1077–1084. - PMC - PubMed

Publication types