. 2022 Feb;17(2):476-512.
doi: 10.1038/s41596-021-00653-8. Epub 2022 Jan 12.

Pooled genetic perturbation screens with image-based phenotypes

Affiliations

Pooled genetic perturbation screens with image-based phenotypes

David Feldman et al. Nat Protoc. 2022 Feb.

Abstract

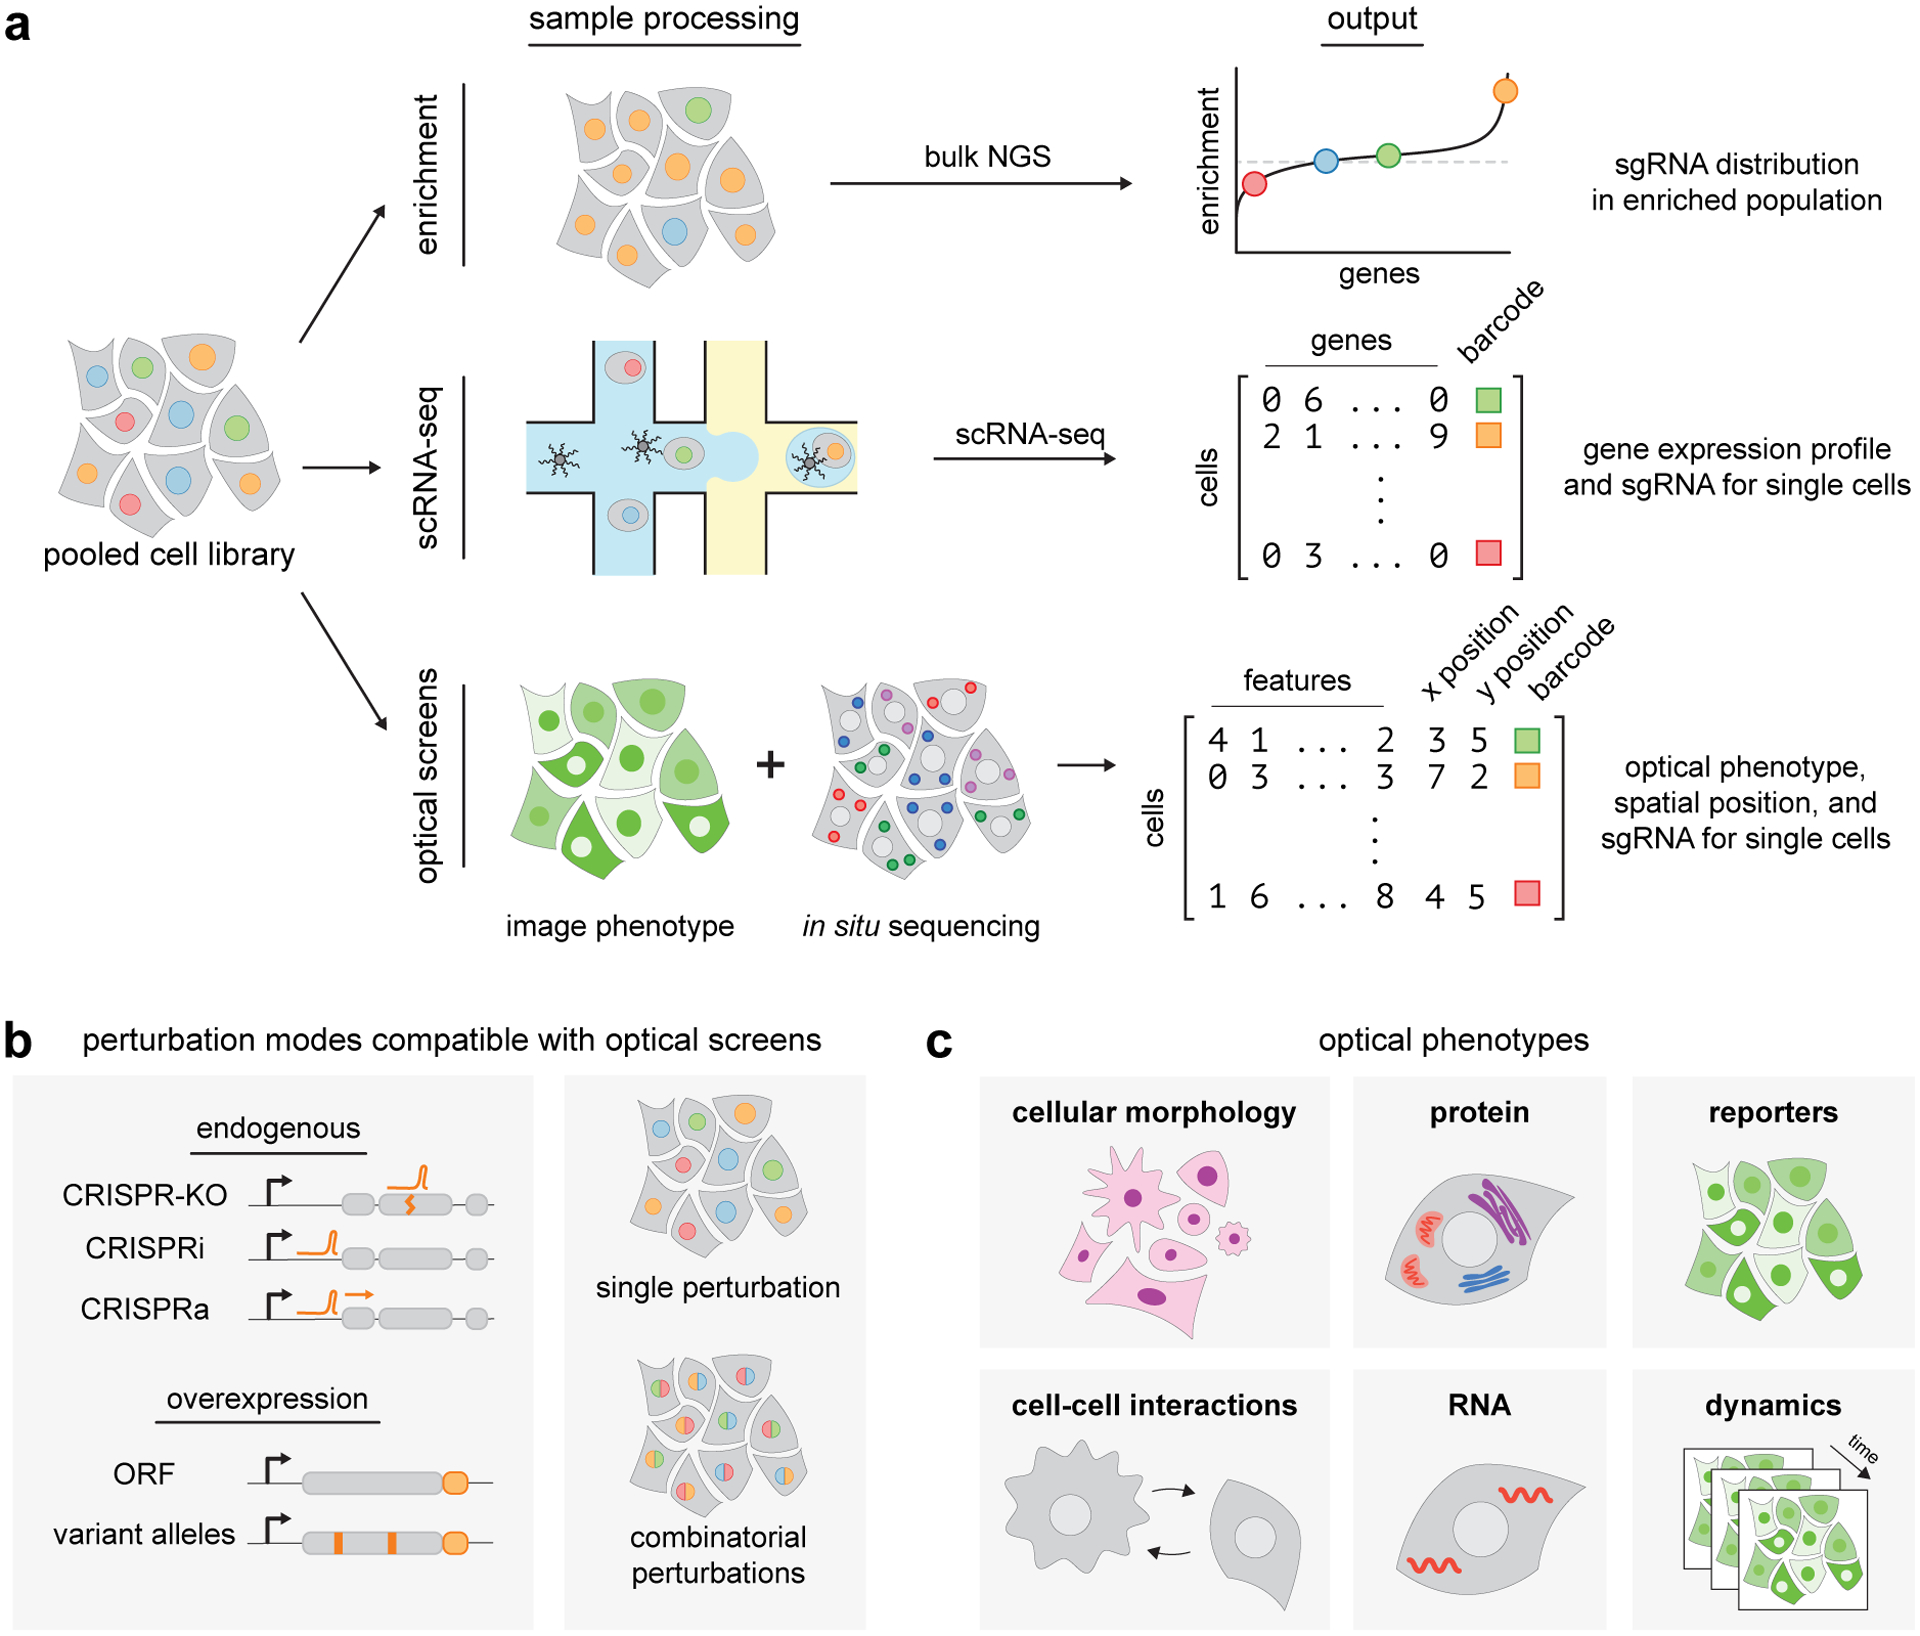
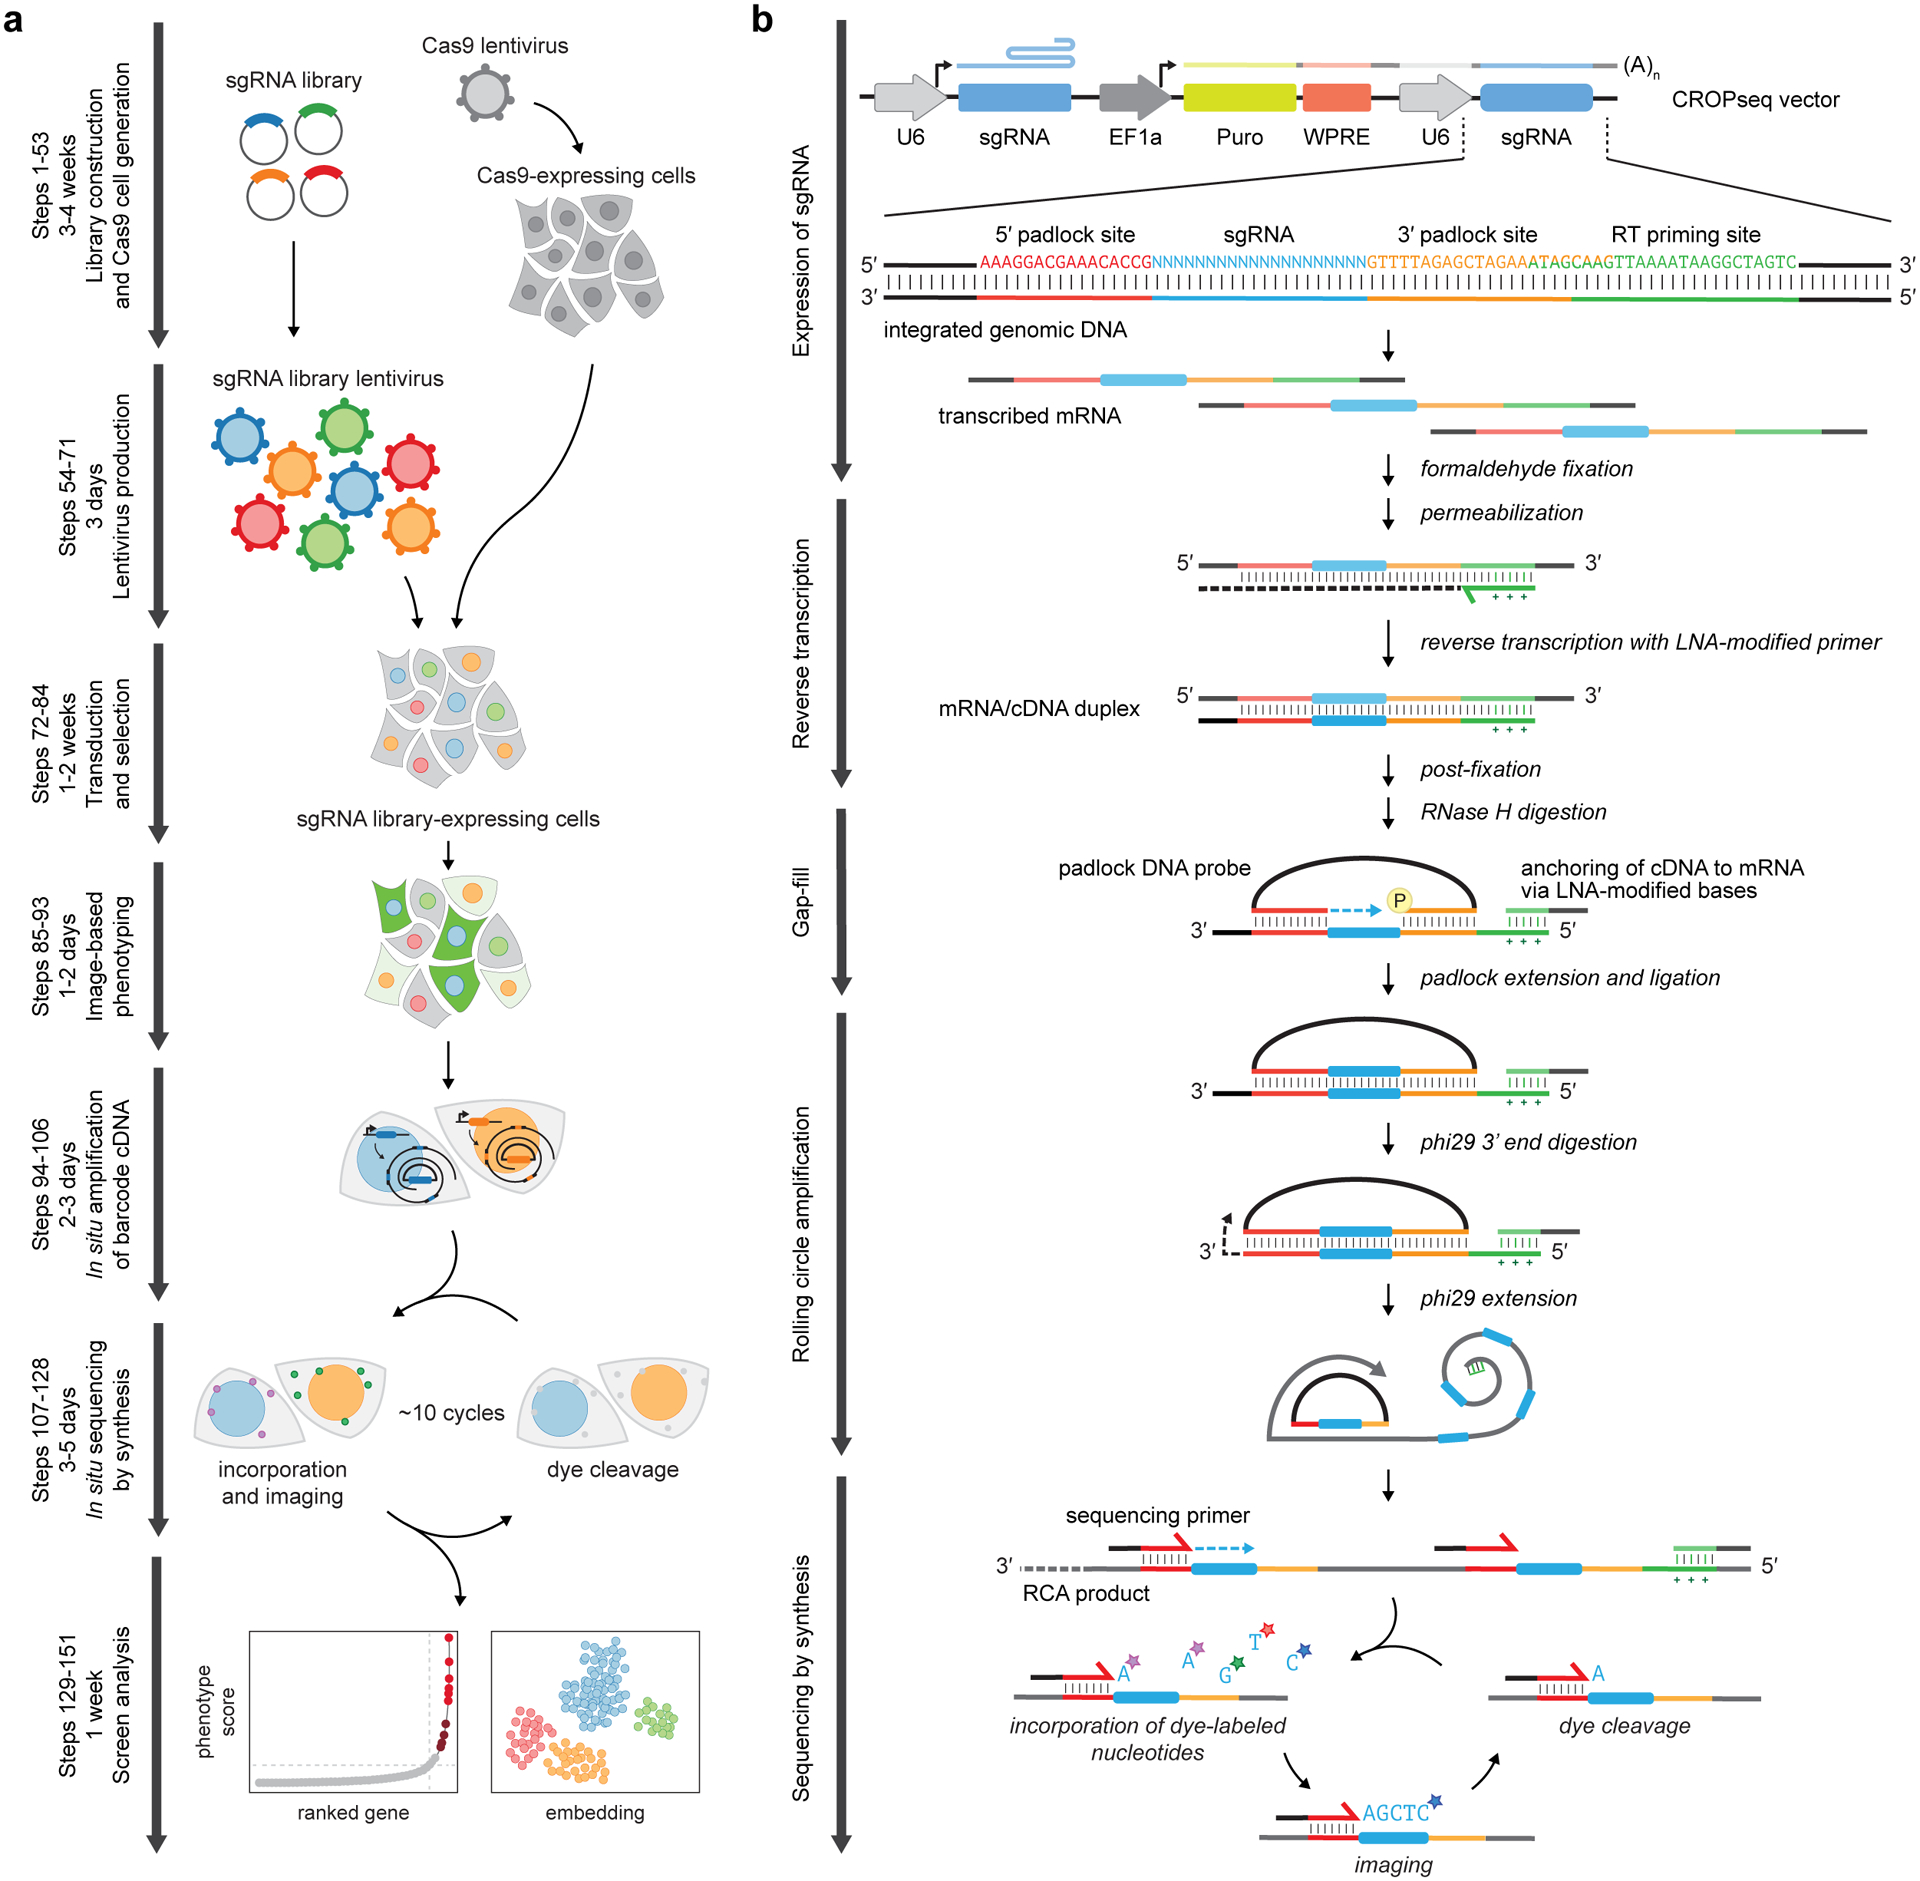
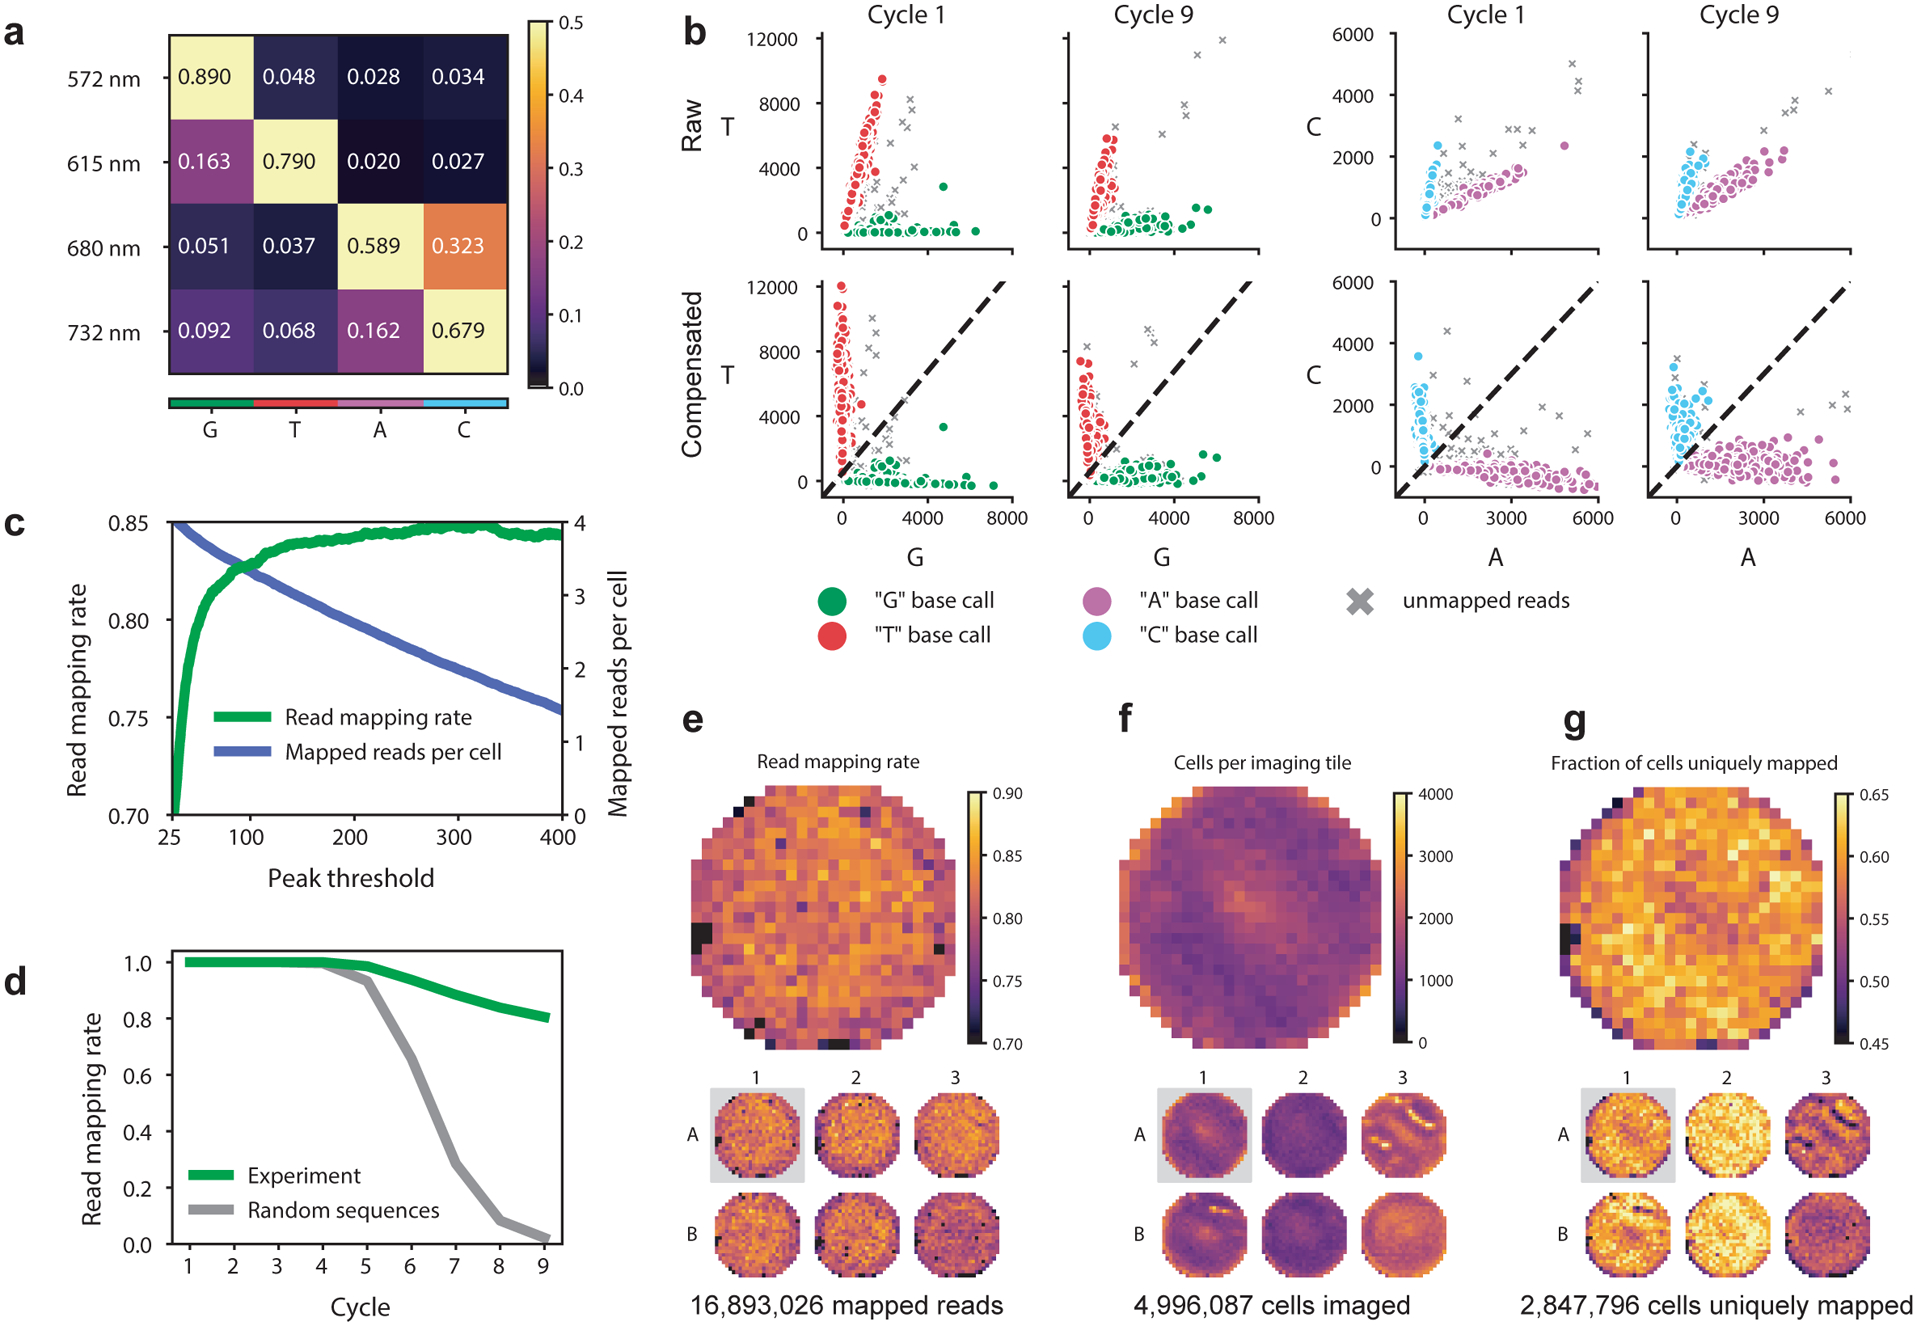
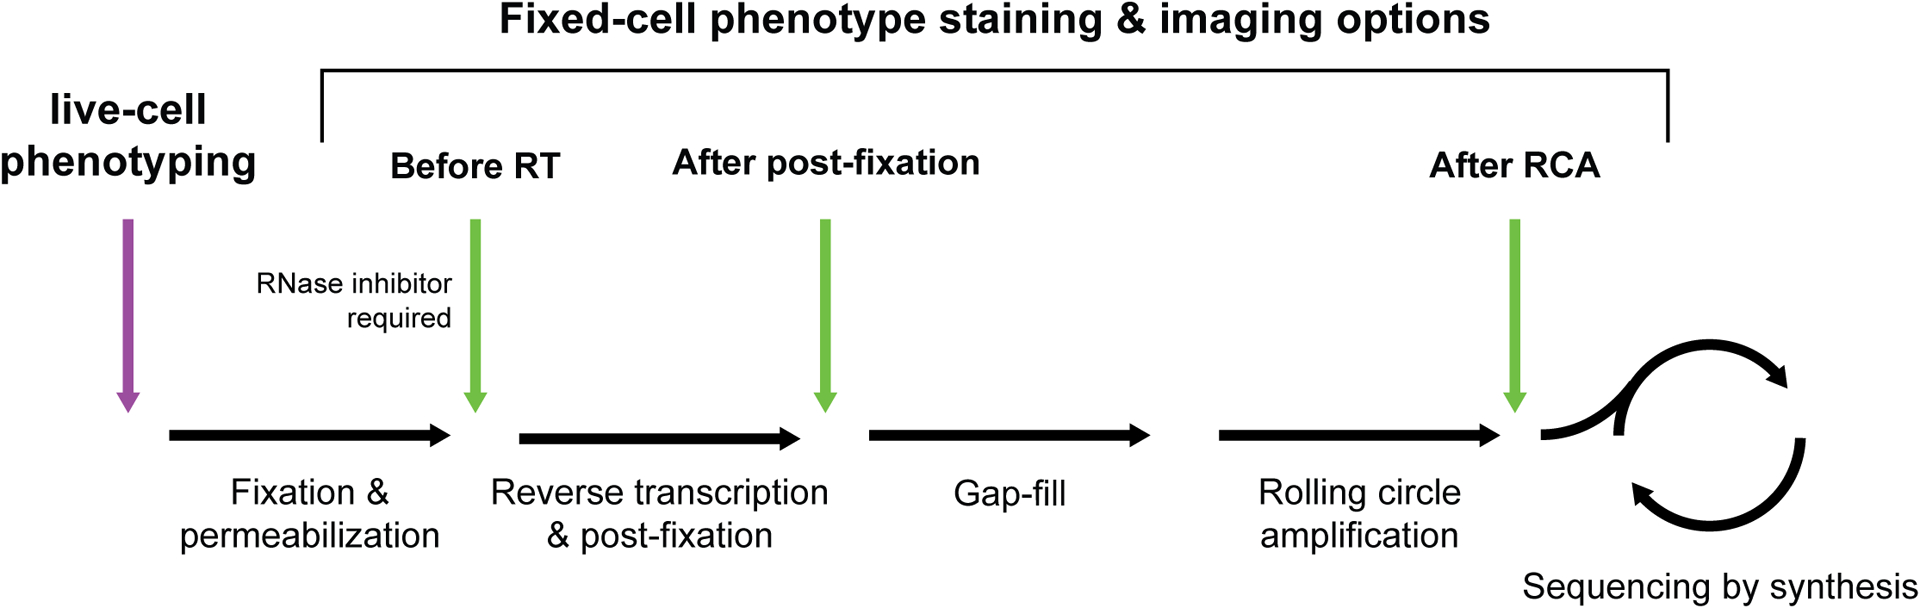
Discovery of the genetic components underpinning fundamental and disease-related processes is being rapidly accelerated by combining efficient, programmable genetic engineering with phenotypic readouts of high spatial, temporal and/or molecular resolution. Microscopy is a fundamental tool for studying cell biology, but its lack of high-throughput sequence readouts hinders integration in large-scale genetic screens. Optical pooled screens using in situ sequencing provide massively scalable integration of barcoded lentiviral libraries (e.g., CRISPR perturbation libraries) with high-content imaging assays, including dynamic processes in live cells. The protocol uses standard lentiviral vectors and molecular biology, providing single-cell resolution of phenotype and engineered genotype, scalability to millions of cells and accurate sequence reads sufficient to distinguish >106 perturbations. In situ amplification takes ~2 d, while sequencing can be performed in ~1.5 h per cycle. The image analysis pipeline provided enables fully parallel automated sequencing analysis using a cloud or cluster computing environment.


Conflict of interest statement

COMPETING INTERESTS

P.C.B. is a consultant to and/or equity holder in companies in the life sciences industries including 10X Genomics, GALT, Celsius Therapeutics, Next Generation Diagnostics, Cache DNA, and Concerto Biosciences. The Broad Institute and MIT have filed U.S. patent applications on work described here and may seek to license the technology.

Figures

Figure 1.
Figure 1.
Pooled screening approaches and applications of optical pooled screens. (a) In pooled screening, a population of cells is subjected to a library of genetic perturbations, such as guide RNAs for CRISPR screens. Enrichment, single-cell profiling, and optical-based assays are three common approaches for phenotypic readout. Enrichment-based screens determine population-level changes in perturbation abundance by bulk next-generation sequencing (NGS) following an applied selection. Single-cell profiling and optical screens do not require an enrichment step and instead rely on information-rich phenotypic measurements. Single-cell assays pair perturbation barcodes to a cell phenotype at single-cell resolution, such as cell transcriptome for single-cell RNA sequencing-based screens. Through in situ sequencing, optical pooled screens pair image-based phenotypes with perturbation barcodes, also at single-cell resolution. (b) Optical screens are compatible with multiple perturbation modalities, including CRISPR-based perturbations of endogenous genomic loci and exogenous overexpression of barcoded transgenes. The single-cell readout enables both single and combinatorial perturbation screens. (c) Optical screens enable rich phenotypic measurements, including cellular morphology, cell-cell interactions, dynamic behaviors, and abundance and localization of endogenous protein and RNA molecules and exogenous reporters.
Figure 2.
Figure 2.
Overview of optical pooled screening. (a) Experimental workflow. First, a pooled sgRNA library is designed, packaged into lentivirus, and delivered into Cas9-expressing cells. A live-cell or fixed-cell imaging assay is performed to generate an optical phenotypic profile of individual cells. The sgRNA spacer sequences in each cell are then amplified and read out by in situ sequencing by synthesis (SBS), consisting of cycles of dye incorporation, imaging, and cleavage. Finally, sgRNA-encoded perturbations are mapped to phenotypic scores at the single-cell level, with candidate genes identified through various statistical approaches. (b) Schematic of the in situ SBS process. The sgRNA is expressed as a polyadenylated mRNA transcript from an integrated copy of the CROPseq vector. After fixation and permeabilization, a locked nucleic acid (LNA)-modified primer is used to reverse transcribe a cDNA copy of the sgRNA sequence. After glutaraldehyde and formaldehyde post-fixation, the mRNA is digested and a padlock probe is hybridized to cDNA regions flanking the sgRNA sequence. The padlock probe is then extended and ligated to copy the sgRNA sequence into a single-stranded circularized DNA. This circularized DNA serves as a template for rolling circle amplification with Phi29 polymerase, the amplified product of which contains tandem repeats of the sgRNA spacer sequence. These sequences are read out by successive cycles of SBS.
Figure 3.
Figure 3.
Technical performance and quality control of in situ sequencing by synthesis (SBS). Data are from a screen in A549 cells with a CROPseq-puro library of 5,738 sgRNAs. (a) Example compensation matrix used for correcting spectral cross-talk between SBS imaging channels. (b) Spectral compensation of the two-channel combinations with the most cross-talk (T vs G and C vs A) at the first and last cycle of an SBS experiment. Mapped reads are those with barcode sequences exactly matching expected sequences from the designed sgRNA library. Dotted lines in the compensated plots demarcate the decision boundary for base calling. (c) Plotting read mapping rate and mapped reads per cell against increasing thresholds on the peak parameter demonstrate that most non-mapping reads are excluded by thresholding this value. (d) Longer read lengths provide increased confidence of mapped reads representing true sequencing spots from barcode mRNA. Plotting plate heatmaps of quality control metrics such as read mapping rate (e), total cells imaged (f), and fraction of cells with reads mapping to one expected barcode sequence (g) is useful for evaluating the quality of an experiment and identifying potential issues.
Figure 4.
Figure 4.
Anticipated results. (a) Example images from a CRISPR knockout screen for regulators of NFkB activation in A549 cells. Sequencing and phenotyping data (p65 localization) are shown for a single field of view. White outlines in sequencing images represent individual cells; colored outlines in the phenotype image represent clusters of neighboring cells with identical sgRNA assignments (scale bar, 50 μm). (b) Distribution of per-cell nuclear translocation scores after TNFɑ stimulation for non-targeting sgRNAs and sgRNAs targeting TNFRSF1A (TNFa receptor), MAP3K7 (downstream NFkB regulator), and IL1R1 (not involved in TNFa signaling). All sgRNAs were downsampled to a maximum of 100 cells to more easily compare distributions. (c) Kinetics of NFkB activation from a separate live-cell optical pooled screen performed in HeLa cells. In unperturbed cells, p65 translocates from the cytoplasm to the nucleus ~45 min after stimulation, followed by a slower, partial relaxation back to the cytoplasm. Top, translocation traces for individual cells mapped to sgRNAs targeting TNFRSF1A, RIPK1, and TNFAIP3 (negative regulator of TNFa signaling). The gray curve indicates the average of cells assigned to non-targeting controls. Middle, per-sgRNA averages, with error bars indicating standard error of the mean (data downsampled to 300 cells per sgRNA). Bottom, per-gene distributions at fixed time points of all cells mapped to sgRNAs targeting the respective gene (green) or non-targeting sgRNAs (gray). The single-cell resolution of optical pooled screens reveals distribution features of perturbation effects, including bimodality and distribution width.
Box 3 – Figure.
Box 3 – Figure.
Options for phenotype acquisition between in situ amplification steps.

References

    1. Shalem O et al. Genome-Scale CRISPR-Cas9 Knockout Screening in Human Cells. Science 343, 84–87 (2014). - PMC - PubMed
    1. Wang T, Wei JJ, Sabatini DM & Lander ES Genetic Screens in Human Cells Using the CRISPR-Cas9 System. Science 343, 80–84 (2014). - PMC - PubMed
    1. Joung J et al. Genome-scale CRISPR-Cas9 knockout and transcriptional activation screening. Nat. Protoc 12, 828–863 (2017). - PMC - PubMed
    1. Parnas O et al. A Genome-wide CRISPR Screen in Primary Immune Cells to Dissect Regulatory Networks. Cell 162, 675–686 (2015). - PMC - PubMed
    1. Dixit A et al. Perturb-Seq: Dissecting Molecular Circuits with Scalable Single-Cell RNA Profiling of Pooled Genetic Screens. Cell 167, 1853–1866.e17 (2016). - PMC - PubMed

Publication types