. 2022 Aug 4;16(7):1097-1109.
doi: 10.1093/ecco-jcc/jjac003.

Detailed Transcriptional Landscape of Peripheral Blood Points to Increased Neutrophil Activation in Treatment-Naïve Inflammatory Bowel Disease

Affiliations

Detailed Transcriptional Landscape of Peripheral Blood Points to Increased Neutrophil Activation in Treatment-Naïve Inflammatory Bowel Disease

Simonas Juzenas et al. J Crohns Colitis. .

Abstract

Background and aims: Inflammatory bowel disease [IBD] is a chronic relapsing disorder of the gastrointestinal tract, which generally manifests as Crohn's disease [CD] or ulcerative colitis [UC]. These subtypes are heterogeneous in terms of disease location and histological features, while sharing common clinical presentation, genetic associations and, thus, common immune regulatory pathways.

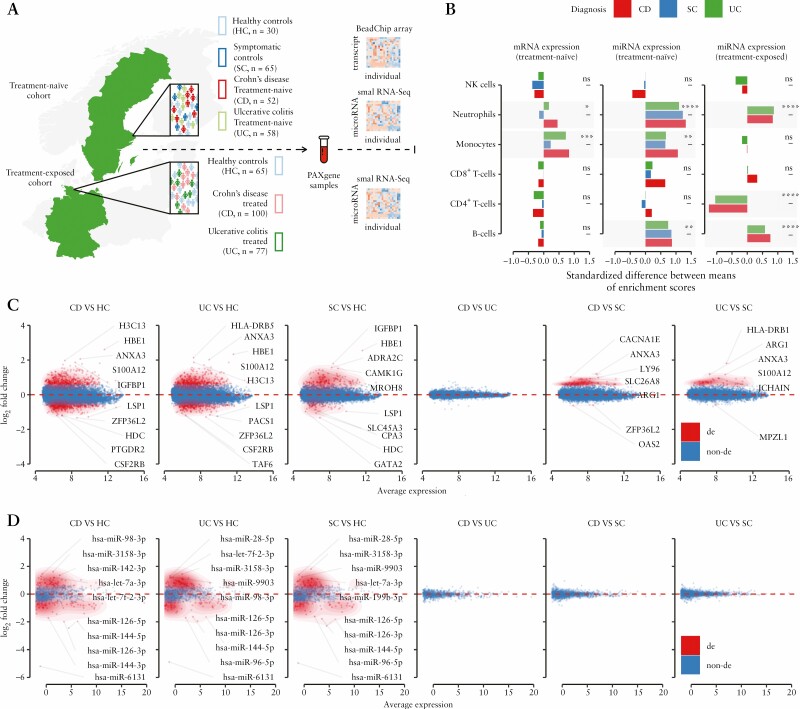
Methods: Using miRNA and mRNA coupled transcriptome profiling and systems biology approaches, we report a comprehensive analysis of blood transcriptomes from treatment-naïve [n = 110] and treatment-exposed [n = 177] IBD patients as well as symptomatic [n = 65] and healthy controls [n = 95].

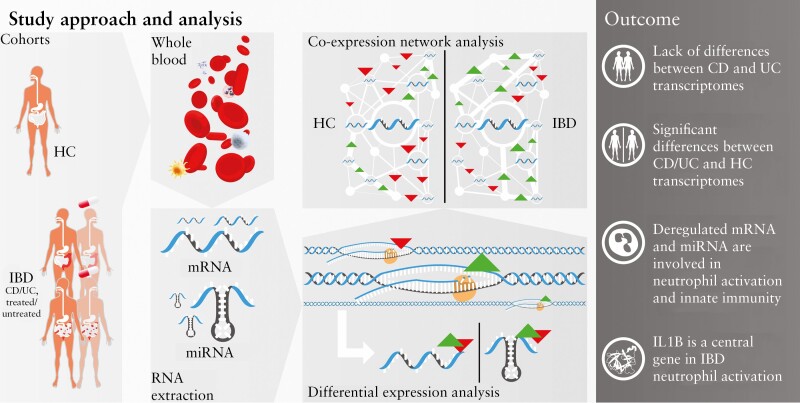
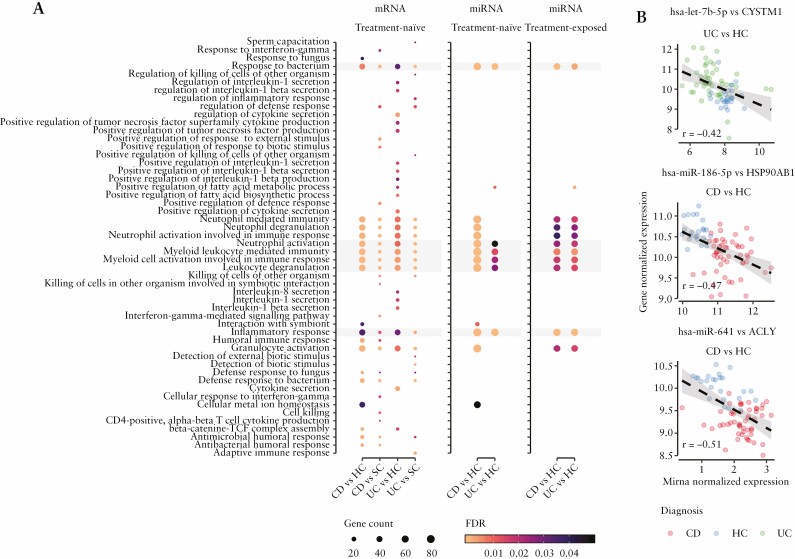
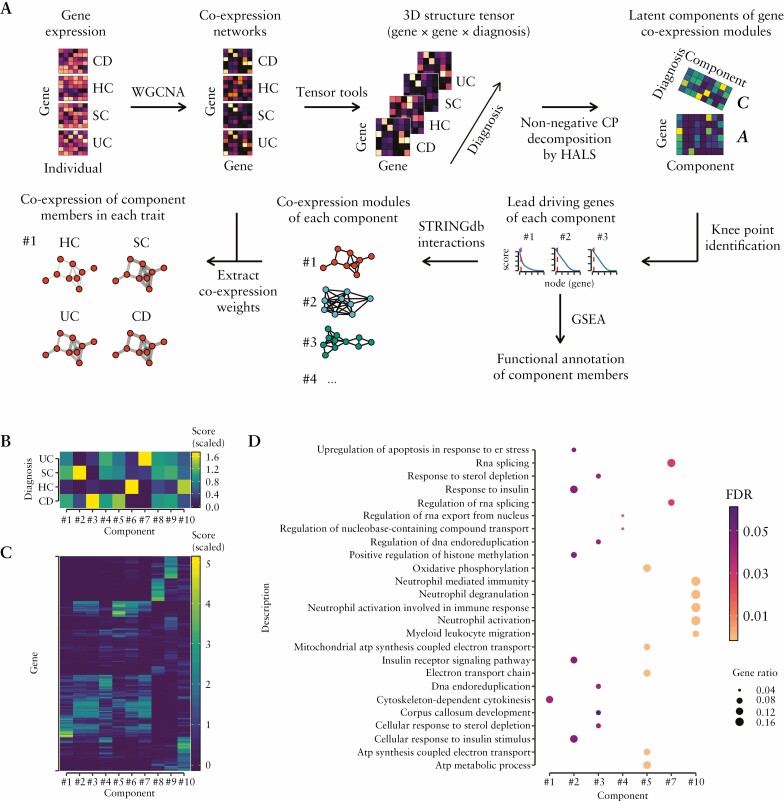
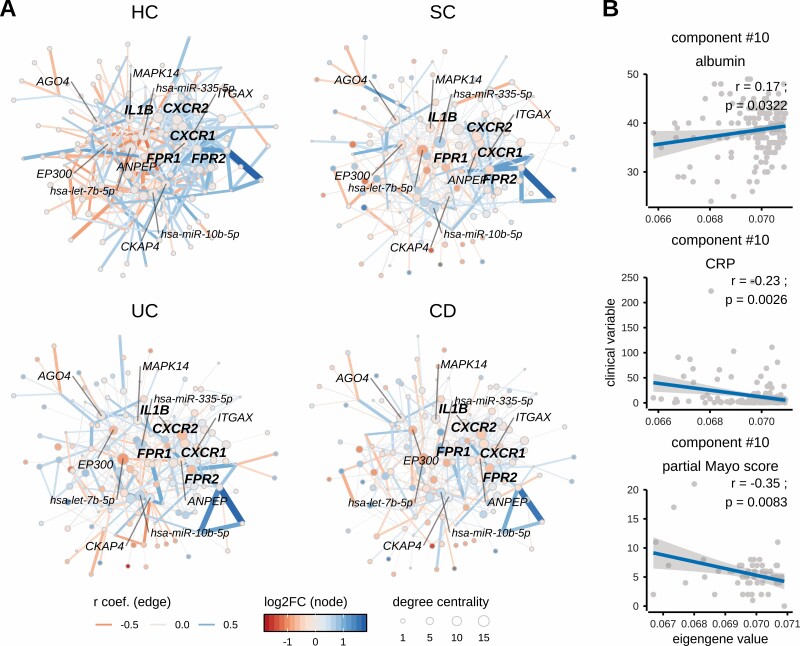
Results: Broadly, the peripheral blood transcriptomes of CD and UC patients were similar. However, there was an extensive gene deregulation in the blood of IBD patients, while only a slight deregulation in symptomatic controls, when compared with healthy controls. The deregulated mRNAs and miRNAs are mainly involved in the innate immunity and are especially enriched in neutrophil activation-related pathways. Oxidative phosphorylation and neutrophil activation-related modules were found to be differentially co-expressed among treatment-naïve IBD as compared to healthy controls. In the deregulated neutrophil activation-related co-expression module, IL1B was identified as the central gene. Levels of co-expression among IL1B and chemosensing receptor [CXCR1/2 and FPR1/2] genes were reduced in the blood of IBD patients when compared with healthy controls.

Conclusions: Immune dysregulation seen in peripheral blood transcriptomes of treatment-naïve IBD patients is mainly driven by neutrophil activation.

Keywords: Inflammatory bowel disease; gene expression; peripheral blood.


Figures

None
Graphical abstract
Figure 1.
Figure 1.
Characterization of peripheral blood miRNA/mRNA transcriptomes obtained from IBD treatment-naïve/-exposed patients and control individuals. [A] Schematic representation of the study design and included cohorts. The study consists of two independent cohorts – German and Swedish. The German cohort comprises treatment-exposed IBD patients [CD and UC subtypes] and healthy controls [HC], while the Swedish cohort comprises treatment-naïve patients [CD and UC], symptomatic [SC] and healthy controls [HC]. For both cohorts, miRNA expression profiles were generated using small RNA-seq, while the mRNA expression profiles were generated using the BeadChip array for the treatment-naïve cohort only. Significance levels: *p < 0.05; **p < 0.01; ***p < 0.001; ****p < 0.0001; ns, not significant. [B] Immune cell type enrichment analysis based on cell-specific multi-marker gene expression. Peripheral blood transcriptomes show relative increase in B cells [on the miRNA level] and myeloid cells, including neutrophils and monocytes [on mRNA and miRNA levels] in the treatment-naïve IBD patients. While treatment-exposed IBD patients also show an increase in B cells and neutrophils, monocyte levels remain unchanged compared to healthy controls [HC]. The treatment-exposed IBD patients also show a relative decrease in CD4+ T cells, suggesting treatment effects on cellular blood composition. Coupled mRNA [C] and miRNA [D] differential gene expression analysis of treatment-naïve IBD patients [CD and UC] and control individuals [SC and HC]. While an extensive transcript deregulation [FC > 1.5 and pFDR < 0.05] was observed in the peripheral blood of inflammatory [CD and UC] and symptomatic traits [SC] when compared to healthy controls [HC], there were no significantly deregulated transcripts between the CD and UC subtypes of IBD. This observation was consistent on mRNA [treatment-naïve] and miRNA [treatment-naïve and treatment-exposed] expression levels [see Supplementary Figure 1B and Table S4 for results for the treatment-exposed cohort]. Top five up- and downregulated transcripts are annotated as gene symbols or miRNA names.
Figure 2.
Figure 2.
Differentially expressed mRNAs as well as miRNAs are involved in inflammatory response and neutrophil activation signalling in the blood of IBD patients. [A] Gene set enrichment analysis [GSEA] of differentially expressed genes and validated target genes of significantly deregulated miRNAs. The figure displays the most significantly overrepresented biological pathways [GO biological process terms; y-axis] of differentially expressed protein-coding genes [mRNA] and significant terms that overlap with validated target genes of significantly deregulated miRNAs in each pairwise comparison [x-axis]. Dot size corresponds to the proportion of differentially expressed genes that overlap total genes of the particular pathway, while colour indicates statistical significance [FDR] of the pathway enrichment. Pathways highlighted in grey are overlapping in all pairwise comparisons of all three differential gene expression analyses (mRNA and miRNA results of treatment-naïve traits and miRNA results of treatment-exposed IBD patients compared to healthy controls [HC]). Complete results of GSEA are provided in Supplementary Table S5. [B] Example of negative correlations of miRNA and their target genes, which are involved in neutrophil activation pathways. The figure shows normalized miRNA expression on the x-axis, normalized expression values of its validated target gene on the y-axis and their regression line [see Methods]. Every data point corresponds to an individual whose diagnosis is indicated by colour. Overall, GSEA results of differentially expressed genes [and miRNAs] in blood of IBD patients show consistent overrepresentation of neutrophil activation pathways. These results are consistent independently of treatment status.
Figure 3.
Figure 3.
Differences of gene co-expression patterns in blood among different diagnoses, including IBD. [A] To identify gene co-expression modules, activity of which is different across blood transcriptomes of treatment-naïve UC, CD, SC diagnoses and healthy controls [HC], the following strategy was used: [1] to identify co-expressed gene pairs, weighted gene correlation networks [using WGCNA] were generated for each trait [gene × gene]; [2] to determine gene co-expression modules, whose activity is different among diagnoses, diagnosis-wise co-expression networks were assembled into 3D tensor [gene × gene × diagnosis] and decomposed into latent matrices A and C, which represent the membership of each gene in each component [gene × component] as well as the membership of each diagnosis [CD, UC, SC and HC] in each component [diagnosis × component], which indicates the co-expression activity of a particular gene module in a given diagnosis; [3] to retain only the genes that are driving a particular co-expression component, knee point detection was used to remove low scoring genes; [4] to determine biological function, co-expression components were functionally characterized using gene set enrichment analysis [GSEA] and gene ontology terms; [5] to obtain biologically meaningful gene–gene interactions of each component’s network, the component-driving genes were mapped to the STRING database; [6] to visualize co-expression patterns of each component in different diagnoses, weighted correlation values were added to diagnosis-wise component networks. [B] The latent matrix C of the decomposed tensor of the co-expression networks. The score [indicated by colour intensity] shows activity of a particular co-expression component in a given diagnosis. [C] Similarly, this heatmap represents the latent matrix A, which contains the membership score [indicated by colour intensity] of each gene in each co-expression component. This score was used to identify the lead driving genes of each component. The lead driving genes mapped to the STRING database of each component are provided in Supplementary Figure S3. [D] Dotplot displaying statistically significant results of the component’s functional annotation using GSEA. Dot size corresponds to the proportion of a component’s [x-axis] genes that overlap the total genes of the particular GO term [y-axis], while colour indicates statistical significance [FDR] of the overrepresentation test.
Figure 4.
Figure 4.
Neutrophil activation-related co-expression module in different diagnoses and its correlation with clinical variables such as albumin and C reactive protein [CRP]. [A] Networks displaying co-expression module [component #10] activity among diagnoses [CD, UC, SC] and healthy controls [HC]. The neutrophil activation-related component module shows strong co-expression (note edge widths [thickness of line] between nodes) in healthy controls [HC], while co-expression of its member genes is reduced in inflammatory traits with the weakest co-expression in CD followed by UC and SC. The most central [hub] genes of this co-expression module are IL1B, CXCR1, CXCR2, FPR1 and FPR2 [highlighted in bold], whose differential expression during inflammation may disturb the co-expression of other member genes. Negative correlation-based integration of miRNA and their known target mRNA expression revealed miR-10b-5p, miR-335-5p and let-7b-5p as being the most interconnected miRNAs of co-expression module #10. The correlation coefficient [r] corresponds to co-expression activity [indicated by edge width], while the direction of correlation corresponds to edge colour. Nodes of the network represent genes [or miRNAs], the differential expression [log2FC] of which, compared to healthy controls [HC], is indicated by the colour gradient. The size of a node indicates its degree centrality, i.e. number of gene–gene interactions of a given gene [node]. The most central genes and miRNAs [hubs; having highest values of centrality degree] are annotated using gene or miRNA symbols. [B] Correlation of clinical variables [serum albumin concentration, serum and CRP concentration in CD and UC patients and partial Mayo score only in UC patients] and component [#10] eigengenes [summarized expression values, see Methods].

References

    1. Martin P, Leibovich SJ. Inflammatory cells during wound repair: the good, the bad and the ugly. Trends Cell Biol 2005;15:599–607. - PubMed
    1. de Souza HS, Fiocchi C. Immunopathogenesis of IBD: current state of the art. Nat Rev Gastroenterol Hepatol 2016;13:13–27. - PubMed
    1. Franke A, Balschun T, Karlsen TH, et al. ; IBSEN study group. Sequence variants in IL10, ARPC2 and multiple other loci contribute to ulcerative colitis susceptibility. Nat Genet 2008;40:1319–23. - PubMed
    1. Ungaro R, Mehandru S, Allen PB, Peyrin-Biroulet L, Colombel JF. Ulcerative colitis. Lancet 2017;389:1756–70. - PMC - PubMed
    1. Doecke JD, Simms LA, Zhao ZZ, et al. . Genetic susceptibility in IBD: overlap between ulcerative colitis and Crohn’s disease. Inflamm Bowel Dis 2013;19:240–5. - PubMed