. 2022 Jan 26;24(4):2504-2520.
doi: 10.1039/d1cp03305k.

Dipolar pathways in dipolar EPR spectroscopy

Affiliations

Dipolar pathways in dipolar EPR spectroscopy

Luis Fábregas-Ibáñez et al. Phys Chem Chem Phys. .

Abstract

Dipolar electron paramagnetic resonance (EPR) experiments such as double electron-electron resonance (DEER) measure distributions of nanometer-scale distances between unpaired electrons, which provide valuable information for structural characterization of proteins and other macromolecular systems. To determine these distributions from the experimental signal, it is critical to employ an accurate model of the signal. For dilute samples of doubly spin-labeled molecules, the signal is a product of an intramolecular and an intermolecular contribution. We present a general model based on dipolar pathways valid for dipolar EPR experiments with spin-1/2 labels. Our results show that the intramolecular contribution consists of a sum and the intermolecular contribution consists of a product over individual dipolar pathway contributions. We examine several commonly used dipolar EPR experiments in terms of dipolar pathways and show experimental results confirming the theoretical predictions. This multi-pathway model makes it possible to analyze a wide range of dipolar EPR experiments within a single theoretical framework.


Conflict of interest statement

Conflicts of interest

There are no conflicts to declare.

Figures

Fig. 1
Fig. 1
General pulse sequence. The sequence consists of N pulses (black boxes) with flip angles ϑn and phase ϕn separated by the time intervals Tn. The spin echo after the last time interval TN is detected.
Fig. 2
Fig. 2
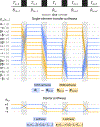
Dipolar pathways as a condensed descriptor of dipolar EPR experiments. (Top) A subset of 10’240 single-element transfer pathways Bi is shown as colored lines connecting the basis operators B^i,n represented as dashed lines, for different time intervals Tn between the pulses. (Bottom) All the single-element transfer pathways shown can be collected according to their net dipolar phase accumulation trajectories into two dipolar pathways sk shown as colored lines, with distinct progressions of sk,n = 0,±1. All single-element transfer pathways are colored according to their corresponding dipolar pathway.
Fig. 3
Fig. 3
Schematic illustration of dipolar pathways in 3-pulse DEER. (Top left) Pulse sequence and dipolar pathways. All detectable modulated dipolar pathway pairs sp consisting of sk (solid lines) and −sk (fainter lines) are shown along with their refocusing times tp. (Top right) The full signal V(t) is shown as a solid line and its unmodulated component as a dashed red line. (Bottom) Decomposition of the dipolar signal. The individual intramolecular (left) and intermolecular contributions (right) are shown as colored lines. The combined inter- and intramolecular contributions are shown as black lines on the top axes.
Fig. 4
Fig. 4
Schematic illustration of dipolar pathways in 4-pulse DEER. (Top left) Pulse sequence and dipolar pathways. All detectable modulated dipolar pathway pairs sp consisting of sk (solid lines) and −sk (fainter lines) are shown along with their refocusing times tp. The most commonly encountered pathways are highlighted in color. (Top right) The full signal V(t) is shown as a solid line and its unmodulated component as a dashed red line. (Bottom) Decomposition of the dipolar signal. The individual intramolecular (left) and intermolecular (right) contributions are shown as colored lines. The combined inter- and intramolecular contributions are shown as black lines on the top axes.
Fig. 5
Fig. 5
Schematic illustration of dipolar pathways in 5-pulse DEER. (Left) Pulse sequence and dipolar pathways. All detectable modulated dipolar pathway pairs sp consisting of sk (solid lines) and −sk (fainter lines) are shown along with their refocusing times tp. The most commonly encountered pathways are highlighted in color. (Right) Decomposition of the dipolar signal. The primary signal V(t) is shown as a solid line and its constant unmodulated component as a dashed red line on the top panel. The individual intramolecular (top) and intermolecular (bottom) contributions from the most commonly encountered dipolar pathway are shown as colored lines in the two bottom panels. The combined inter and intramolecular contributions are shown as black lines on the top axes.
Fig. 6
Fig. 6
Global analysis with DeerLab of experimental 4-pulse DEER signals obtained from a 50 μM solution of maltose-binding protein (MBP) using different configurations with varying pump–probe overlap (see SI for details) with τ1 = 0.4 μs and τ2 = 3.0 μs. The experimental data are shown as grey dots. The experimental data corresponding to moving echoes are shown as fainter dots marked with a dark asterisk and were omitted from the analysis. The data was fitted to the full 4-pulse DEER multi-pathway model, with a global non-parametric distance distribution. The resulting fit to the data is shown as a black line. The fitted contributions to each signal are displayed for each fit as colored lines using the same notation as in Fig. 4. The simulated inversion efficiency profiles of the probe (red) and pump (green) pulses are superimposed on the nitroxide spectrum (grey) are shown on top for each dataset. The fitted distance distribution is shown in the SI.
Fig. 7
Fig. 7
Global analysis with DeerLab of experimental 4-pulse DEER signals obtained from a 80 μM oligoPPE bi-radical solution using different configurations with varying pump–probe overlap (see SI for details). with τ1 = 0.75 μs and τ2 = 7.5 μs. The experimental data are shown as grey dots. The experimental data corresponding to moving echoes are shown as fainter dots marked with a dark asterisk and were omitted from the analysis. The data was fitted to the full 4-pulse DEER multi-pathway model, with a global worm-like chain distance distribution. For the orientational distribution, a phenomenological model based on a cubic spline was used. The resulting fit to the data is shown as a black line. The fitted contributions to each signal are displayed for each fit as colored lines using the same notation as in Fig. 4. The inversion efficiency profiles of the probe (red) and pump (green) pulses are superimposed on the nitroxide spectrum (grey) are shown on top for each dataset. The fitted distance distribution is shown in the SI.
Fig. 8
Fig. 8
Global analysis with DeerLab of experimental 5-pulse DEER signals obtained from a 50 μM solution of maltose-binding protein (MBP) using different configurations with varying pump–probe overlap (see SI for details) with τ1 = 1.8 μs, τ2 = 2.3 μs, and τ3 = 0.2 μs. The experimental data are shown as grey dots. The experimental data corresponding to moving echoes are shown as fainter dots marked with a dark asterisk and were omitted from the analysis. The data was fit with a 5-pulse DEER multi-pathway model consisting of the first five dipolar pathways, with a global non-parametric distance distribution. The resulting fit to the data is shown as a black line. The fitted contributions to each signal are displayed for each fit as colored lines using the same notation as in Fig. 4. The simulated inversion efficiency profiles of the probe (red) and pump (green) pulses are superimposed on the nitroxide spectrum (grey) are shown on top for each dataset. The fitted distance distribution is shown in the SI
Fig. 9
Fig. 9
Global analysis with DeerLab of experimental 5-pulse DEER signals from a A7R1/W22R1 mutant of the membrane-inserting peptide WALP23, acquired and published by Breitgoff et al., using different configurations with varying pump–probe overlap (see SI for details) The left panel correspond to a 5-pulse DEER experiment with τ1 = τ2 = 1.5 μs and τ3 = 0.2 μs, and the right panel to τ1 = τ2 = 2.0 μs and τ3 = 0.5 μs. The experimental data are shown as grey dots. The data was fit with a 5-pulse DEER multi-pathway model consisting of the first five dipolar pathways, with a non-parametric distance distribution. The resulting fit to the data is shown as a black line. The fitted contributions to each signal are displayed for each fit as colored lines using the same notation as in Fig. 5. The insets show the fitted dipolar pathway amplitudes λk as colored bars. The simulated inversion efficiency profiles of the probe (red) and pump (green) pulses are superimposed on the nitroxide spectrum (grey) are shown on top for each dataset. The fitted distance distributions is shown in the SI.
Fig. 10
Fig. 10
Global analysis with DeerLab of experimental 5-pulse DEER signals obtained from a 400 μM TEMPOL solution using different pulse configurations (see SI for details). The experimental data are shown as grey dots. The experimental data corresponding to moving echoes are shown as fainter dots marked with a dark asterisk and were omitted from the analysis. The data was fit with a 5-pulse DEER multi-pathway model consisting of the first five dipolar pathways. The resulting fit to the data is shown as a black line. The fitted contributions to each signal are displayed for each fit as colored lines using the same notation as in Fig. 4. The simulated inversion efficiency profiles of the probe (red) and pump (green) pulses are superimposed on the nitroxide spectrum (grey) are shown on top for each dataset. The fitted distance distribution is shown in the SI.
Fig. 11
Fig. 11
Matrix representation of the spin density operator ρ^ and precession frequencies . (Left) The 16 operators B^j in the single-element Zeeman product basis for a coupled spin-pair are shown. αα indicates S^A,αS^B,α, etc. (Right) The precession frequencies of the individual components during the free evolution time between pulses are shown. The matrix elements are color-coded according to the type of spin system state: polarization (blue), zero-quantum coherence (ZQC, purple), single-quantum coherence (SQC, yellow), or double-quantum coherence (DQC, red).

References

    1. Milov AD, Salikhov KM and Shchirov MD, Soviet Physics Solid State, 1981, 23, 565–569.
    1. Martin RE, Pannier M, Diederich F, Gramlich V, Hubrich M and Spiess HW, Angewandte Chemie International Edition, 1998, 37, 2833–2837. - PubMed
    1. Emshwiller M, Hahn EL and Kaplan D, Physical Review, 1960, 118, 414–424.
    1. Wang P-K, Slichter CP and Sinfelt JH, Physical Review Letters, 1984, 53, 82–85.
    1. Pannier M, Schädler V, Schöps M, Wiesner U, Jeschke G and Spiess HW, Macromolecules, 2000, 33, 7812–7818.