. 2022 Jan 13:11:e74623.
doi: 10.7554/eLife.74623.

ACE2 is the critical in vivo receptor for SARS-CoV-2 in a novel COVID-19 mouse model with TNF- and IFNγ-driven immunopathology

Affiliations

ACE2 is the critical in vivo receptor for SARS-CoV-2 in a novel COVID-19 mouse model with TNF- and IFNγ-driven immunopathology

Riem Gawish et al. Elife. .

Abstract

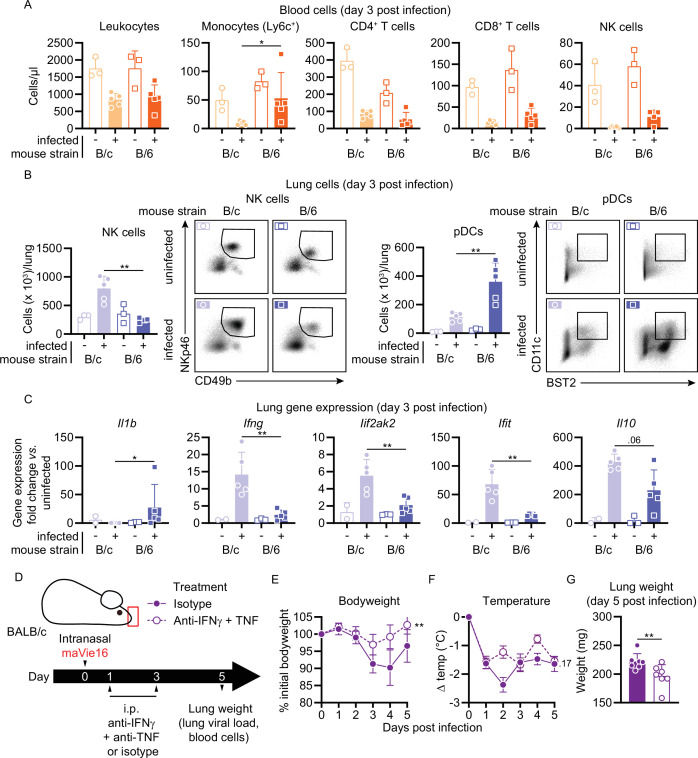
Despite tremendous progress in the understanding of COVID-19, mechanistic insight into immunological, disease-driving factors remains limited. We generated maVie16, a mouse-adapted SARS-CoV-2, by serial passaging of a human isolate. In silico modeling revealed how only three Spike mutations of maVie16 enhanced interaction with murine ACE2. maVie16 induced profound pathology in BALB/c and C57BL/6 mice, and the resulting mouse COVID-19 (mCOVID-19) replicated critical aspects of human disease, including early lymphopenia, pulmonary immune cell infiltration, pneumonia, and specific adaptive immunity. Inhibition of the proinflammatory cytokines IFNγ and TNF substantially reduced immunopathology. Importantly, genetic ACE2-deficiency completely prevented mCOVID-19 development. Finally, inhalation therapy with recombinant ACE2 fully protected mice from mCOVID-19, revealing a novel and efficient treatment. Thus, we here present maVie16 as a new tool to model COVID-19 for the discovery of new therapies and show that disease severity is determined by cytokine-driven immunopathology and critically dependent on ACE2 in vivo.

Keywords: COVID-19 mouse model; COVID-19 therapy; cytokine storm; immunology; inflammation; maVie16; mouse; mouse-adapted SARS-CoV-2; recombinant soluble ace2.


Conflict of interest statement

RG, PS, LP, AH, KL, FO, SC, AO, BA, LE, TC, JP, DC, RK, AH, NM, AM, LB, HS, AB, CO, SK No competing interests declared, GW is an employee of Apeiron Biologics. Apeiron holds a patent on the use of ACE2 for the treatment of lung, heart, or kidney injury and is currently testing soluble ACE2 for treatment in COVID-19 patients, JP declares a conflict of interest as a founder and shareholder of Apeiron Biologics. Apeiron holds a patent on the use of ACE2 for the treatment of lung, heart, or kidney injury and is currently testing soluble ACE2 for treatment in COVID-19 patients.(patent #WO2021191436A1)

Figures

Figure 1.
Figure 1.. Serial pulmonary passaging of SARS-CoV-2 through BALB/c mice leads to mouse adaptation and generation of the mouse-virulent virus maVie16.
(A) Experimental strategy for generation of maVie16. BALB/c mice were intranasally inoculated with BavPat1 (passage 0/P0), followed by serial passaging of virus-containing cell-free lung homogenates of infected mice every 3 days. Passaging was repeated 15 times. (B) Lung tissue virus genome copy numbers (determined by real-time PCR) of mice 3 days after infection with virus of different passages as indicated. (C) Body weight (percentage of initial) of mice 3 days after infection. (D) Body temperature before and 3 days after infection. (E) Lung tissue expression fold change (compared to P0 mean; analyzed by real-time PCR) of indicated genes 3 days after infection. (B–E) n = 1–3; (B, C, E) symbols represent individual mice; Kruskal–Wallis test (vs. P0) with Dunn’s multiple comparisons test; (D) mean ± SD; two-way ANOVA with Sidak test (vs. the respective initial body temperature); *p≤0.05; **p≤0.01; ***p≤0.001; numbers above bars show the actual p-value.
Figure 2.
Figure 2.. maVie16 possesses a distinct pattern of mutations and mediates in vivo pathology via angiotensin-converting enzyme-2 (ACE2).
(A) Overview of allele frequencies of mutated amino acids detected in maVie16 by sequencing. Labels on top indicate the associated protein (SGP, Spike glycoprotein; ORF, open reading frame; MGP, membrane glycoprotein). (B) Spike protein mutation dynamics. (C) Modeling and location of Spike mutations. Spike trimer in cyan blue and green, mACE2 in magenta cartoon representation. Glycans in stick representations. (D) Modeling of specific BavPat1 (upper row) and maVie16 (lower row) amino acid regions in green (respective mutated positions are highlighted in yellow and labeled in green) and their interaction with mouse ACE2 (in magenta; positions of interest are labeled in magenta or black).
Figure 2—figure supplement 1.
Figure 2—figure supplement 1.. Mouse versus human angiotensin-converting enzyme-2 (ACE2) glycosylation and maVie16 in vitro proliferation.
(A) Surface representation of the binding interface of human (gray cartoon) and mouse (magenta cartoon) ACE2, colored according to the electrostatic potential. Red surface corresponds to a negative potential and blue surface to a positive potential. Note the more distinct pattern of negatively charged areas in the mouse ACE2 protein. A bundle of glycan conformations is shown in sticks for the glycans at N53 (blue), N90 (yellow), N322 (black), and N546 (red) in human ACE2 and at N53 (blue), N536 (green), and N546 (red) in mouse ACE2. (B) SARS-CoV-2 genome copy numbers in Vero and Caco-2 cells at indicated time points after infection with a multiplicity of infection (MOI) 0.5 of BavPat1 or maVie16.
Figure 3.
Figure 3.. Respiratory maVie16 infection causes dose-dependent pathology in BALB/c and C57BL/6 mice.
(A–C, G) BALB/c (B/c) or (D–F, H) C57BL/6 (B/6) mice were intranasally inoculated with different doses of maVie16 as indicated and monitored for (A, D) body weight, (B, E) survival and (C, F) body temperature over 7 days; dashed lines in (A) and (C) indicate trajectories of groups lacking full group size due to death of animals (see B). (G, H) Lung sections (hematoxylin and eosin stain) from mice 3 days after infection with 105 TCID50 maVie16; black rectangles in the upper pictures indicate the area magnified in the respective lower row picture; scale bars indicate 100 µm. (I) Histological score for analysis of lung sections as described in (G) and (H); symbols represent individual mice; (A, C, D, F) mean ± SD; (B) Mantel–Cox test (vs. 4 × 10³ TCID50); **p≤0.01; the number next to the symbol shows the actual p-value.
Figure 3—figure supplement 1.
Figure 3—figure supplement 1.. Disease kinetics of BavPat1-infected KRT18-hACE2 mice.
(A–F) Mice expressing human ACE2 under control of the human KERATIN-18 promoter (KRT18-hACE2/+) and control animals (+/+) were intranasally inoculated with (A, C, E) 103 or (B, D, F) 104 TCID50 of BavPat1 and monitored over 7 days. (A, B) Survival; (C, D) body weight; (E, F) temperature; (AF) n = 4–7; (E, F) mean ± SD.
Figure 4.
Figure 4.. Mouse COVID-19 (mCOVID-19) is associated with transient lymphopenia, pulmonary dendritic cell, and T cell infiltration and pneumonia.
C57BL/6 mice were intranasally infected with PBS ( = group 0) or 5 × 10⁵ TCID50 maVie16 and sacrificed after 2, 5, 7, or 14 days for subsequent analysis. (A) Flow cytometry analysis of blood cell populations. (B) Density plot representation of blood plasmacytoid dendritic cells (pDCs; identified as live/CD45+/CD11c+/BST2+) analyzed by flow cytometry. (C) Flow cytometry analysis of whole lung cell populations (see Figure 4—figure supplement 1 for gating strategies). (D) Lung tissue expression fold change (compared to group 0 mean; analyzed by real-time PCR) of indicated genes from mice at the respective time points after infection. (A, C, D): symbols represent individual mice; Kruskal–Wallis test (vs. group 0) with Dunn’s multiple comparisons test; *p≤0.05; **p≤0.01; ***p≤0.001.
Figure 4—figure supplement 1.
Figure 4—figure supplement 1.. Flow cytometry gating strategy for lung cells.
C57BL/6 mice were intranasally infected with PBS ( = group 0) or 5 × 10⁵ TCID50 maVie16 and sacrificed after 2, 5, 7, or 14 days for subsequent analysis. (A) Example of the flow cytometry gating strategy for immune cell populations (shown in Figure 4C and Figure 4—figure supplement 2B). The sample is derived from an infected mouse 2 days post infection.
Figure 4—figure supplement 2.
Figure 4—figure supplement 2.. Cellular, transcriptional, and spleen weight kinetics of maVie16-infected C57BL/6 mice.
C57BL/6 mice were intranasally infected with PBS ( = group 0) or 5 × 10⁵ TCID50 maVie16 and sacrificed after 2, 5, 7, or 14 days for subsequent analysis. (A) Flow cytometry analysis of blood cell populations. (B) Flow cytometry analysis of whole lung cell populations (see Figure 4—figure supplement 1 for gating strategies). (C) Lung tissue expression fold change (compared to group 0 mean; analyzed by real-time PCR) of indicated genes from mice at the respective time points after infection. (D) Spleen weight at indicated time points after infection. (A–D) symbols represent individual mice; Kruskal–Wallis test (vs. group 0) with Dunn’s multiple comparisons test; *p≤0.05; **p≤0.01; ***p≤0.001.
Figure 5.
Figure 5.. Mouse COVID-19 (mCOVID-19) is associated with transient pneumonia and antigen-specific adaptive immunity.
C57BL/6 mice were intranasally infected with PBS ( = group 0 or PBS) or 5 × 10⁵ TCID50 maVie16 and sacrificed after 2, 5, 7, or 14 days for subsequent analysis. (A) Lung tissue virus genome copy numbers (determined by real-time PCR). (B) Lung tissue weight. (C) Representative lung immunohistochemistry (anti-SARS-CoV-2 nucleocapsid stain, counterstained with hematoxylin) pictures; black rectangles in the upper pictures indicate the area magnified in the respective lower row picture; scale bars represent 100 µm. (D) Lung pathology score based on histological analysis of lung tissue sections. (E) Analysis (by ELISA) of SARS-CoV-2 Spike-specific IgG1, IgG2b, and IgA plasma antibody titers 14 days after infection. (A, B, D, E) Mean + SD; symbols represent individual mice; (A, B, D): Kruskal–Wallis test (vs. [A] day 2 or [B, D] group 0) with Dunn’s multiple comparisons test; (E) Mann–Whitney test; *p≤0.05; **p≤0.01; ***p≤0.001.
Figure 6.
Figure 6.. BALB/c mouse COVID-19 (mCOVID-19) is associated with an increased NK cell and interferon response and is ameliorated by IFNγ and TNF blockade.
BALB/c (B/c) and C57BL/6 (B/6) mice were intranasally inoculated with 105 TCID50 maVie16 (+) or PBS (-). Samples for analyses were collected 3 days after infection. (A) Flow cytometry analysis of blood cell populations. (B) Flow cytometry analysis of whole lung NK cells and plasmacytoid dendritic cells (pDCs). Density plots represent examples of respective cell populations (NK cells pre-gated from live/CD45+/Ly6G-/CD3-; pDCs pre-gated from live/CD45+) (C) Lung tissue expression fold change (compared to the respective mean of uninfected samples; analyzed by real-time PCR) of indicated genes. (D) Experimental scheme for (E–G). BALB/c mice were infected with 105 TCID50 maVie16 and treated intraperitoneally on days 1 and 3 post infection (p.i.) with a mix of 500 µg anti-IFNγ and anti-TNF or with isotype control antibody. (E) Body weight and (F) temperature kinetics over 5 days after infection. (G) Lung weight on day 5 after infection. (A–C, G) Mean + SD; symbols represent individual mice; differences between infected groups were assessed using the Mann–Whitney test; (E, F) mean ± SD; two-way ANOVA with Dunnett’s multiple comparisons test (vs. the respective initial body weight or temperature); in panels without respective labels, the groups were not significantly different (p<0.05); *p≤0.05; **p≤0.01.
Figure 6—figure supplement 1.
Figure 6—figure supplement 1.. Comparison of cellular, transcriptional, and organ weight of maVie16-infected BALB/c versus C57BL/6 mice.
BALB/c (B/c) and C57BL/6 (B/6) mice were intranasally inoculated with 105 TCID50 maVie16 (+) or PBS (-). Samples for analyses were collected 3 days after infection. (A) Flow cytometry analysis of blood cell populations. (B) Flow cytometry analysis of indicated lung cell populations in whole tissue. (C) Lung tissue expression fold change (compared to the respective mean of uninfected samples; analyzed by real-time PCR) of indicated genes. (D) Plasma levels of indicated cytokines (assessed by multiplex cytokine analysis). (E) Lung tissue virus genome copy numbers (determined by real-time PCR). (F) Weight of spleen and lung. (A–F) Mean + SD; symbols represent individual mice; differences between infected groups were assessed using the Mann–Whitney test; in panels without respective labels, the groups were not significantly different (p<0.05); *p≤0.05.
Figure 6—figure supplement 2.
Figure 6—figure supplement 2.. Disease parameters of maVie16-infected Ace2-deficient mice, and of infected BALB/c and C57BL/6 mice treated with anti-IFNγ and -TNF blocking antibodies.
(A) Experimental scheme for (B) and (C). BALB/c mice were infected with 105 TCID50 maVie16 and treated intraperitoneally on days 1 and 3 post infection (p.i.) with a mix of 500 µg anti-IFNγ and anti-TNF or with isotype control antibody. (B) Lung viral load and (C) blood cell numbers 5 days p.i.; (D) experimental scheme for (EI). C57BL/6 mice were infected with 5 × 10⁵ TCID50 maVie16 and treated intraperitoneally on days 1 and 3 p.i. with a mix of 500 µg anti-IFNγ and anti-TNF or with isotype control antibody. (E) Body weight and (F) temperature kinetics over 5 days after infection. (G) Lung weight, (H) lung viral load, and (I) blood cell numbers 5 days p.i.; (B, C, G–I) mean + SD; Mann–Whitney test; (E, F) mean ± SD; two-way ANOVA with Dunnett’s multiple comparisons test (vs. the respective initial body weight or temperature); *p≤0.05; ns, not significant (p>0.05).
Figure 7.
Figure 7.. Mouse COVID-19 (mCOVID-19) pathology depends on Ace2 and is improved by recombinant angiotensin-converting enzyme-2 (ACE2) administration.
(A) Experimental scheme for (B–E): male Ace2-deficient (Ace2-/y) or control (Ace2+/y) mice were infected with 5 × 10⁵ TCID50 maVie16. (B) Body weight and (C) temperature kinetics over 3 days after infection. (D) Lung tissue weight 3 days post infection (p.i.). (E) Lung histology 3 days after infection (left panels: hematoxylin and eosin stain; right panels: anti-SARS-CoV-2 nucleocapsid immune-stain); black rectangles in the upper pictures indicate the area magnified in the respective lower row picture; scale bars represent 100 µm. (F) Experimental scheme for (GL). BALB/c mice were infected with 105 TCID50 maVie16 and treated daily intranasally up to day 4 p.i. with 100 µg recombinant murine soluble (rms) ACE2 or vehicle (the first treatment was administered together with virus). (G) Body weight and (H) temperature kinetics over 5 days after infection. (I) Lung weight, (J) lung histology (hematoxylin and eosin stain), (K) lung viral load, and (L) blood cells on day 5 after infection. (M) Experimental scheme for (N) and (O). BALB/c mice were infected with 105 TCID50 maVie16 and treated daily, intranasally up to day 5 p.i. with 100 µg rms ACE2 or vehicle. The first treatment was administered either 12 hr, 24 hr, or 48 hr p.i. (N) Body weight and (O) survival over 7 days of infection. (B, C, G, H, N, O) mean ± SD; two-way ANOVA with Dunnett’s multiple comparisons test (vs. the respective initial body weight or temperature); (D, I, K, L) Mann–Whitney test; * p≤0.05; **p≤0.01; ***p≤0.001; ns, not significant (p>0.05).
Figure 7—figure supplement 1.
Figure 7—figure supplement 1.. Disease parameters of maVie16-infected Ace2-deficient mice, and of infected BALB/c and C57BL/6 mice treated with recombinant mouse angiotensin-converting enzyme-2 (ACE2).
(A) Experimental scheme for (B): male Ace2-deficient (Ace2-/y) or control (Ace2+/y) mice were infected with 5 × 10⁵ TCID50 maVie16. (B) Lung viral load 3 days post infection (p.i.). (C) Experimental scheme for (D). BALB/c mice were infected with 105 TCID50 maVie16 and treated daily intranasally up to day 4 p.i. with 100 µg recombinant murine soluble (rms) ACE2 or vehicle (the first treatment was administered together with virus). (D) Lung histology (anti-SARS-CoV-2 nucleocapsid immune stain) on day 5 after infection; black rectangles in the upper pictures indicate the area magnified in the respective lower row picture; arrowheads indicate infected (nucleocapsid-positive) cells; scale bars represent 100 µm. (E) Experimental scheme for (F–J). C57BL/6 mice were infected with 5 × 10⁵ TCID50 maVie16 and treated daily intranasally up to day 4 p.i. with 100 µg rms ACE2 or vehicle (the first treatment was administered together with virus). (F) Body weight and (G) temperature kinetics over 5 days after infection. (H) Lung weight, (I) lung viral load, and (J) blood cells on day 5 after infection; (K) Experimental scheme for LBALB/c mice were infected with 105 TCID50 maVie16 and treated daily, intranasally up to day 5 p.i. with 100 µg recombinant murine soluble (rms) ACE2 or vehicle. The first treatment was administered either 12h, 24h or 48h p.i. (L) Body temperature over 7 days of infection. (B, H–J) mean + SD; Mann–Whitney test; (F, G, L) mean ± SD; two-way ANOVA with Dunnett’s multiple comparisons test (vs. the respective initial body weight or temperature); **p≤0.01; ***p≤0.001; ns, not significant (p>0.05).

References

    1. Adams LE, Dinnon KH, Hou YJ, Sheahan TP, Heise MT, Baric RS. Critical ACE2 Determinants of SARS-CoV-2 and Group 2B Coronavirus Infection and Replication. MBio. 2021;12:e03149-20. doi: 10.1128/mBio.03149-20. - DOI - PMC - PubMed
    1. Agerer B, Koblischke M, Gudipati V, Montaño-Gutierrez LF, Smyth M, Popa A, Genger JW, Endler L, Florian DM, Mühlgrabner V, Graninger M, Aberle SW, Husa AM, Shaw LE, Lercher A, Gattinger P, Torralba-Gombau R, Trapin D, Penz T, Barreca D, Fae I, Wenda S, Traugott M, Walder G, Pickl WF, Thiel V, Allerberger F, Stockinger H, Puchhammer-Stöckl E, Weninger W, Fischer G, Hoepler W, Pawelka E, Zoufaly A, Valenta R, Bock C, Paster W, Geyeregger R, Farlik M, Halbritter F, Huppa JB, Aberle JH, Bergthaler A. SARS-CoV-2 mutations in MHC-I-restricted epitopes evade CD8+ T cell responses. Science Immunology. 2021;6:eabg6461. doi: 10.1126/sciimmunol.abg6461. - DOI - PMC - PubMed
    1. Baazim H, Antonio-Herrera L, Bergthaler A. The interplay of immunology and cachexia in infection and cancer. Nature Reviews. Immunology. 2021;21:624. doi: 10.1038/s41577-021-00624-w. - DOI - PMC - PubMed
    1. Björkström NK, Strunz B, Ljunggren HG. Natural killer cells in antiviral immunity. Nature Reviews. Immunology. 2021;10:558. doi: 10.1038/s41577-021-00558-3. - DOI - PMC - PubMed
    1. Cai Y, Zhang J, Xiao T, Lavine CL, Rawson S, Peng H, Zhu H, Anand K, Tong P, Gautam A, Lu S, Sterling SM, Walsh RM, Rits-Volloch S, Lu J, Wesemann DR, Yang W, Seaman MS, Chen B. Structural basis for enhanced infectivity and immune evasion of SARS-CoV-2 variants. Science. 2021;373:642–648. doi: 10.1126/science.abi9745. - DOI - PMC - PubMed

Publication types

Substances