. 2022 Jan 13:11:e70382.
doi: 10.7554/eLife.70382.

GWAS and ExWAS of blood mitochondrial DNA copy number identifies 71 loci and highlights a potential causal role in dementia

Affiliations

GWAS and ExWAS of blood mitochondrial DNA copy number identifies 71 loci and highlights a potential causal role in dementia

Michael Chong et al. Elife. .

Abstract

Background: Mitochondrial DNA copy number (mtDNA-CN) is an accessible blood-based measurement believed to capture underlying mitochondrial (MT) function. The specific biological processes underpinning its regulation, and whether those processes are causative for disease, is an area of active investigation.

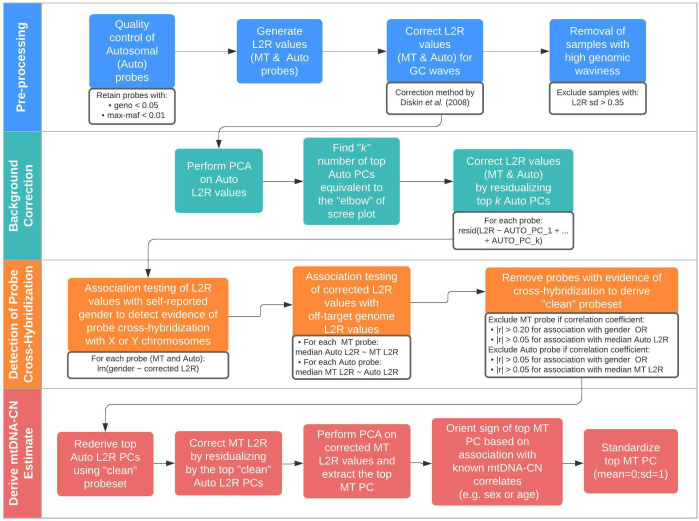
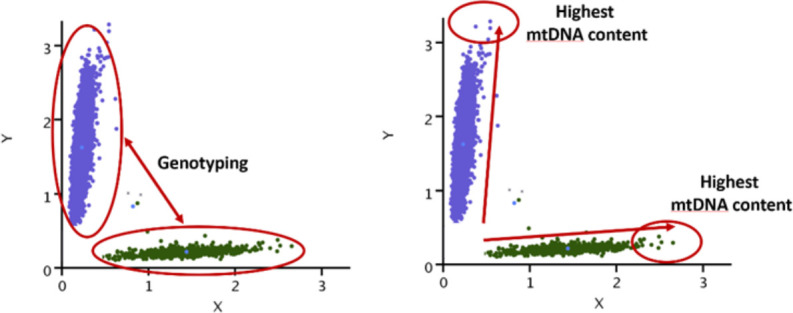
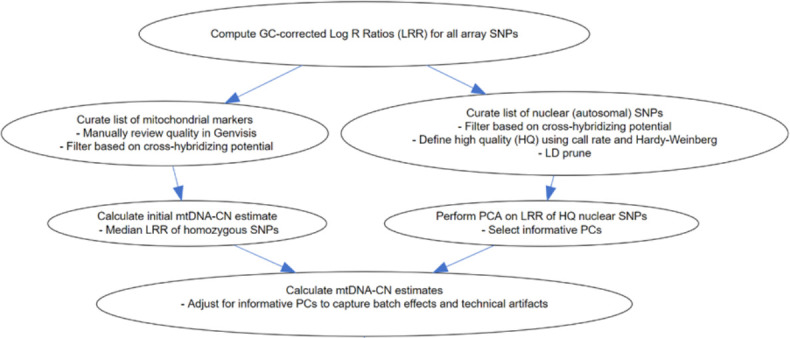
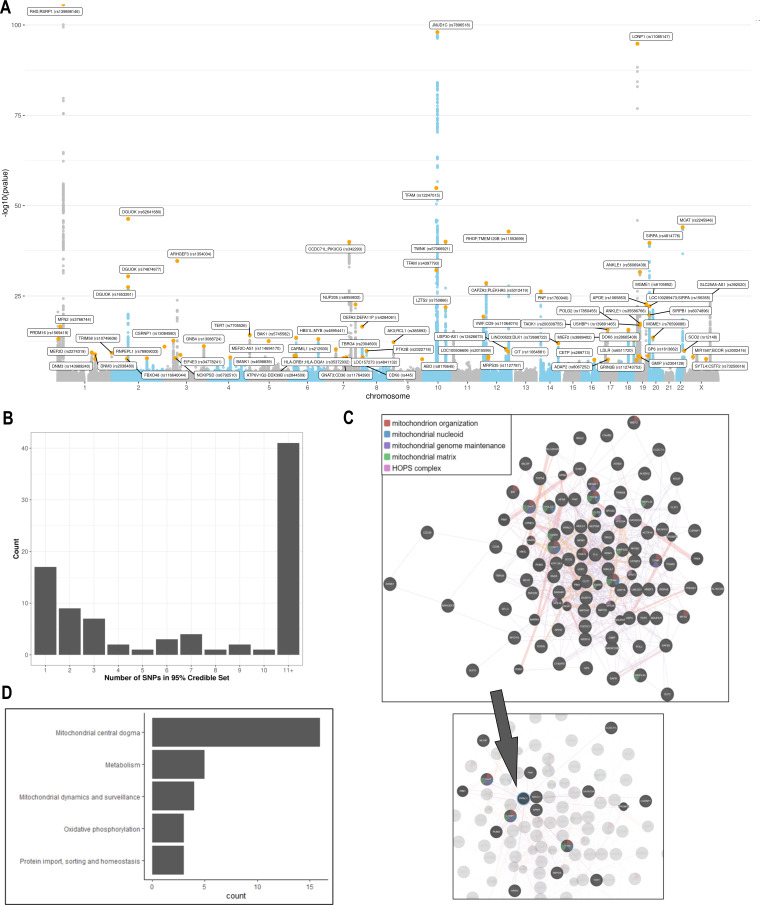
Methods: We developed a novel method for array-based mtDNA-CN estimation suitable for biobank-scale studies, called 'automatic mitochondrial copy (AutoMitoC).' We applied AutoMitoC to 395,781 UKBiobank study participants and performed genome- and exome-wide association studies, identifying novel common and rare genetic determinants. Finally, we performed two-sample Mendelian randomization to assess whether genetically low mtDNA-CN influenced select MT phenotypes.

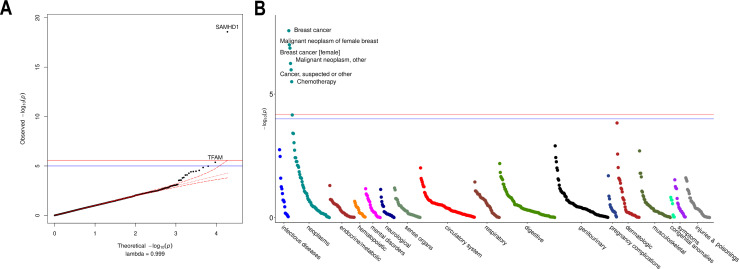
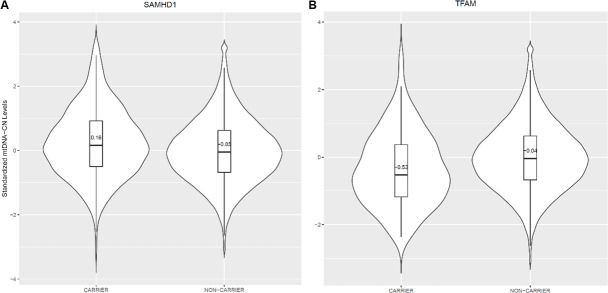
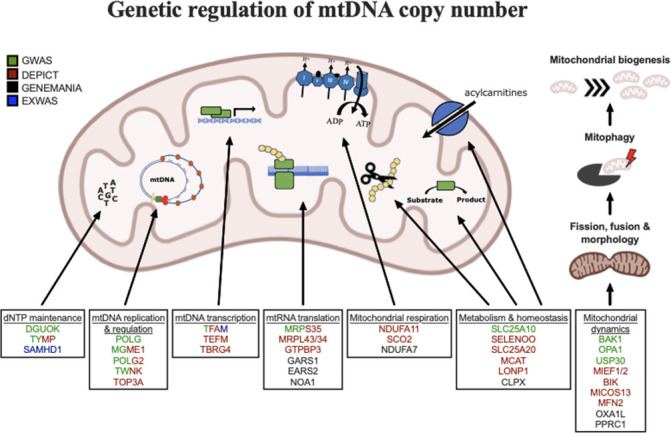
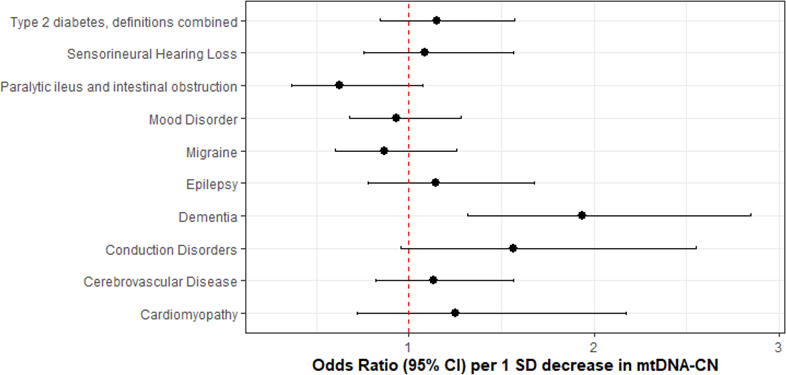
Results: Overall, genetic analyses identified 71 loci for mtDNA-CN, which implicated several genes involved in rare mtDNA depletion disorders, deoxynucleoside triphosphate (dNTP) metabolism, and the MT central dogma. Rare variant analysis identified SAMHD1 mutation carriers as having higher mtDNA-CN (beta = 0.23 SDs; 95% CI, 0.18-0.29; p=2.6 × 10⁻¹⁹), a potential therapeutic target for patients with mtDNA depletion disorders, but at increased risk of breast cancer (OR = 1.91; 95% CI, 1.52-2.40; p=2.7 × 10⁻⁸). Finally, Mendelian randomization analyses suggest a causal effect of low mtDNA-CN on dementia risk (OR = 1.94 per 1 SD decrease in mtDNA-CN; 95% CI, 1.55-2.32; p=7.5 × 10⁻⁴).

Conclusions: Altogether, our genetic findings indicate that mtDNA-CN is a complex biomarker reflecting specific MT processes related to mtDNA regulation, and that these processes are causally related to human diseases.

Funding: No funds supported this specific investigation. Awards and positions supporting authors include: Canadian Institutes of Health Research (CIHR) Frederick Banting and Charles Best Canada Graduate Scholarships Doctoral Award (MC, PM); CIHR Post-Doctoral Fellowship Award (RM); Wellcome Trust Grant number: 099313/B/12/A; Crasnow Travel Scholarship; Bongani Mayosi UCT-PHRI Scholarship 2019/2020 (TM); Wellcome Trust Health Research Board Irish Clinical Academic Training (ICAT) Programme Grant Number: 203930/B/16/Z (CJ); European Research Council COSIP Grant Number: 640580 (MO); E.J. Moran Campbell Internal Career Research Award (MP); CISCO Professorship in Integrated Health Systems and Canada Research Chair in Genetic and Molecular Epidemiology (GP).

Keywords: Mendelian randomization; dementia; genetics; genome-wide association study; genomics; human; medicine; mitochondrial DNA copy number.

Plain language summary

Our cells are powered by small internal compartments known as mitochondria, which host several copies of their own ‘mitochondrial’ genome. Defects in these semi-autonomous structures are associated with a range of severe, and sometimes fatal conditions: easily checking the health of mitochondria through cheap, quick and non-invasive methods can therefore help to improve human health. Measuring the concentration of mitochondrial DNA molecules in our blood cells can help to estimate the number of mitochondrial genome copies per cell, which in turn act as a proxy for the health of the compartment. In fact, having lower or higher concentration of mitochondrial DNA molecules is associated with diseases such as cancer, stroke, or cardiac conditions. However, current approaches to assess this biomarker are time and resource-intensive; they also do not work well across people with different ancestries, who have slightly different versions of mitochondrial genomes. In response, Chong et al. developed a new method for estimating mitochondrial DNA concentration in blood samples. Called AutoMitoC, the automated pipeline is fast, easy to use, and can be used across ethnicities. Applying this method to nearly 400,000 individuals highlighted 71 genetic regions for which slight sequence differences were associated with changes in mitochondrial DNA concentration. Further investigation revealed that these regions contained genes that help to build, maintain, and organize mitochondrial DNA. In addition, the analyses yield preliminary evidence showing that lower concentration of mitochondrial DNA may be linked to a higher risk of dementia. Overall, the work by Chong et al. demonstrates that AutoMitoC can be used to investigate how mitochondria are linked to health and disease in populations across the world, potentially paving the way for new therapeutic approaches.


Conflict of interest statement

MC, PM, NP, WN, RM, SN, RL, IK, MK, CJ, TM, NC, MO, MP, LA, GP No competing interests declared

Figures

Figure 1.
Figure 1.. Schematic summary of the automatic mitochondrial copy (AutoMitoC) pipeline.
The AutoMitoC pipeline is comprised of four major steps: (i) preprocessing, (ii) background correction, (iii) detection of probe cross-hybridization, and (iv) final derivation of mitochondrial DNA copy number (mtDNA-CN) estimates. First, preprocessing is simplified by restricting analysis of autosomal variants to those that have low minor allele frequency ( <0.01) and low genotype missingness ( <0.05). For probes passing quality control, MT and autosomal log2ratio (L2R) values undergo an initial correction for guanine cytosine (GC) waves using the method by Diskin et al., 2008. Samples exhibiting high genomic waviness post GC-correction (L2R SD >0.35) are removed. Second, background correction consists of performing principal component analysis of the autosomal probe L2R values and finding the top k principal components (PCs) that correspond to the ‘elbow’ of the scree plot. In our case, ~70% variance in autosomal L2R values was explained by the top k PCs in both UKbiobank and INTERSTROKE datasets. GC-corrected MT and L2R values are then further adjusted for the top autosomal PCs (representing technical background noise) by taking the residuals of the association between the L2R values versus the k autosomal PCs. Third, we derive a ‘clean’ set of autosomal and MT probes without signs of off-target probe cross-hybridization by empirically testing the GC-corrected and background-corrected L2R values for association with either the sample medians of off-target genome L2R values or self-reported gender (to capture off-target hybridization to sex chromosomes). Fourth, using the ‘clean’ probeset, we repeat the autosomal background correction, extract the top MT PC as a crude measure of mtDNA-CN, change the sign of the MT PC according to association of the MT PC with known predictors of mtDNA-CN that are commonly reported (sex or age), and last, standardize the MT PC values as the final AutoMitoC estimate.
Figure 1—figure supplement 1.
Figure 1—figure supplement 1.. Intuition behind differentiation of genotypes and determination of mitochondrial DNA copy number (mtDNA-CN).
Contrast in the intensities of mitochondrial probes ‘X’ and ‘Y’ discriminate genotypes (left). Intracluster variation in signal intensities may reflect differences in mtDNA-CN (right). (Adapted from Lane, 2014).
Figure 1—figure supplement 2.
Figure 1—figure supplement 2.. Overview of the MitoPipeline (Source: http://genvisis.org/MitoPipeline/) (Lane, 2014).
Figure 1—figure supplement 3.
Figure 1—figure supplement 3.. Minor allele frequency (MAF)-stratified analyses demonstrating utility of rare vs common autosomal variants for signal normalization.
(A) Density plot illustrating the correlation (R2) between autosomal probe log2ratio (L2R) values and median MT L2R stratified by common (MAF >0.01) and rare (MAF <0.01) variant status. (B) Cumulative variance explained by inclusion of top eigenvectors for sets of common (M = 86,677) and rare (M = 79,611) autosomal probe sets.
Figure 1—figure supplement 4.
Figure 1—figure supplement 4.. Distribution of log10 transformed coefficients of determination (r2) from the association between autosomal probe intensities and median mitochondrial (MT) signal with (blue) or without (red) correction for background noise (i.e. 120 autosomal principal components [PCs]).
The dashed vertical line represents the threshold corresponding to ‘moderate’ correlation (|r| > 0.05 or r2 >0.0025), which is used to remove outlying probes that are associated with MT signal. Without correction for top PCs, most autosomal probes exhibit some correlation with MT signal.
Figure 1—figure supplement 5.
Figure 1—figure supplement 5.. Validation of automatic mitochondrial copy in an ethnically diverse cohort with qPCR measurements.
Both qPCR and array-based mitochondrial DNA copy number estimates are presented as standardized units (mean = 0; SD = 1). The sample consisted of 2431 Europeans, 1704 Latin Americans, 542 Africans, 471 South East Asians, 186 South Asians, and 360 participants of other ancestry. Correlations between array and qPCR estimates were comparable for European (r = 0.60; p=2.7 × 10–238), Latin American (r = 0.70; p=3.9 × 10–251), African (R = 0.66; p=1.8 × 10–68), South East Asian (r = 0.59; p=6.2 × 10–46), South Asian (r = 0.53; p=4.2 × 10⁻¹⁵), and other (r = 0.72; p=5.4 × 10–59) ethnic groups. The blue line indicates the linear trendline and the surrounding shaded region indicates the 95% CI for the trendline.
Figure 1—figure supplement 6.
Figure 1—figure supplement 6.. Bland Altman plots illustrating the extent of agreement between array and qPCR measurements.
The black solid line indicates perfect agreement. The dashed blue line indicates the mean difference (or bias) between estimates. The horizontal red line corresponds to the 95% upper and lower limits of agreement (U/L LOA) for the observed data. The dashed black lines indicate the 95% U/L LOA that is expected under the null for two unrelated variables.
Figure 2.
Figure 2.. Distribution of automatic mitochondrial copy (AutoMitoC) estimates and the influence of blood cell counts.
(A) Histogram illustrating AutoMitoC mitochondrial DNA copy number (mtDNA-CN) estimates in 395,781 UKBiobank participants expressed per SD change in mtDNA-CN. Associations between blood cell counts with mtDNA-CN levels as conveyed by forest plots illustrating effect estimates (left) and a bar plot showing the proportion of variance in mtDNA-CN explained (right). Models were adjusted for age, age2, sex array type, 20 genetic principal components, and ethnicity. Both blood cell counts and mtDNA-CN levels were standardized (mean = 0; SD = 1).
Figure 3.
Figure 3.. Analyses of common genetic loci associated with mitochondrial DNA copy number (mtDNA-CN).
(A) Manhattan plot illustrating common genetic variant associations with mtDNA-CN. (B) Size distribution of 95% credible sets defined for 80 independent genetic signals. (C) GENE-MANIA-mania protein network interaction exploration showing all DEPICT and gene-mania prioritized genes (top) with functions color coded and a zoom-in highlighting interactors of the key mitochondrial (MT) regulator gene, PPRC1 (bottom). (D) ‘MitoPathway’ counts corresponding to 27 prioritized MitoCarta3 genes encoding proteins with known MT localization.
Figure 3—figure supplement 1.
Figure 3—figure supplement 1.. Minor allele frequency (MAF) and ethnicity-stratified genome-wide association study quantile-quantile plots.
Variants are stratified per MAF quartile.
Figure 3—figure supplement 2.
Figure 3—figure supplement 2.. Manhattan plot for transethnic genome-wide association study meta-analysis (N = 395,781).
Figure 3—figure supplement 3.
Figure 3—figure supplement 3.. Correlation between conditionally independent mitochondrial DNA copy number loci effect estimates derived from European genome-wide association study (GWAS) meta-analyses (x-axes) vs effect estimates from non-European GWAS (y-axes).
Comparisons for African (A) and South Asian (B) GWAS analyses are presented. Of the total 80 conditionally independent signals identified using the European GWAS meta-analysis, 73 and 75 variants were available for comparison in African and South Asian GWAS, respectively.
Figure 4.
Figure 4.. Rare variant gene burden association testing with mitochondrial DNA copy number and disease risk.
(A) QQ plot illustrating expected vs observed -log10 p-values for exome-wide burden of rare (MAF <0.001) and nonsynymous mutations. (B) Manhattan plot showing phenome-wide significant associations between SAMHD1 carrier status and cancer-related phenotypes.
Figure 4—figure supplement 1.
Figure 4—figure supplement 1.. Effect of rare mutation carrier status for SAMHD1 and TFAM genes on mitochondrial DNA copy number (mtDNA-CN) levels.
Violin plots showing the distribution of mtDNA-CN for carriers and noncarriers of (A) SAMHD1 and (B) TFAM rare nonsynonymous and deleterious (MCAP >0.025) variants.
Figure 5.
Figure 5.. Graphical summary of mitochondrial genes and pathways implicated by genetic analyses.
Color coding indicates through which set(s) of analyses genes were identified. The image was generated using BioRender (https://biorender.com/).
Figure 6.
Figure 6.. Association of genetically lower mitochondrial DNA copy number with mitochondrial (MT) disease phenotypes.
Coefficient plots for Mendelian randomization analyses of MT disease traits. In the absence of heterogeneity (Egger intercept p>0.05; MR-PRESSO global heterogeneity p>0.05), the inverse variance weighted result was reported. In the presence of balanced pleiotropy (MR-PRESSO global heterogeneity p<0.05), the weighted median result was reported. No set of analyses had evidence for directional pleiotropy (Egger intercept p<0.05).

Comment in

References

    1. 1000 Genomes Project Consortium. Abecasis GR, Auton A, Brooks LD, DePristo MA, Durbin RM, Handsaker RE, Kang HM, Marth GT, McVean GA. An integrated map of genetic variation from 1,092 human genomes. Nature. 2012;491:56–65. doi: 10.1038/nature11632. - DOI - PMC - PubMed
    1. Ali AT, Boehme L, Carbajosa G, Seitan VC, Small KS, Hodgkinson A. Nuclear genetic regulation of the human mitochondrial transcriptome. eLife. 2019;8:e41927. doi: 10.7554/eLife.41927. - DOI - PMC - PubMed
    1. Altschul SF, Gish W, Miller W, Myers EW, Lipman DJ. Basic local alignment search tool. Journal of Molecular Biology. 1990;215:403–410. doi: 10.1016/S0022-2836(05)80360-2. - DOI - PubMed
    1. Andrews SJ, Goate AM. Mitochondrial DNA copy number is associated with cognitive impairment. Alzheimer’s & Dementia. 2020;16:S5. doi: 10.1002/alz.047543. - DOI
    1. Ashar FN, Zhang Y, Longchamps RJ, Lane J, Moes A, Grove ML, Mychaleckyj JC, Taylor KD, Coresh J, Rotter JI, Boerwinkle E, Pankratz N, Guallar E, Arking DE. Association of Mitochondrial DNA Copy Number With Cardiovascular Disease. JAMA Cardiology. 2017;2:1247–1255. doi: 10.1001/jamacardio.2017.3683. - DOI - PMC - PubMed

Publication types