. 2022 Jan 13:11:e71802.
doi: 10.7554/eLife.71802.

Epigenetic scores for the circulating proteome as tools for disease prediction

Affiliations

Epigenetic scores for the circulating proteome as tools for disease prediction

Danni A Gadd et al. Elife. .

Erratum in

  • Correction: Epigenetic scores for the circulating proteome as tools for disease prediction.
    Gadd DA, Hillary RF, McCartney DL, Zaghlool SB, Stevenson AJ, Cheng Y, Fawns-Ritchie C, Nangle C, Campbell A, Flaig R, Harris SE, Walker RM, Shi L, Tucker-Drob EM, Gieger C, Peters A, Waldenberger M, Graumann J, McRae AF, Deary IJ, Porteous DJ, Hayward C, Visscher PM, Cox SR, Evans KL, McIntosh AM, Suhre K, Marioni RE. Gadd DA, et al. Elife. 2023 Nov 20;12:e94481. doi: 10.7554/eLife.94481. Elife. 2023. PMID: 37982710 Free PMC article.

Abstract

Protein biomarkers have been identified across many age-related morbidities. However, characterising epigenetic influences could further inform disease predictions. Here, we leverage epigenome-wide data to study links between the DNA methylation (DNAm) signatures of the circulating proteome and incident diseases. Using data from four cohorts, we trained and tested epigenetic scores (EpiScores) for 953 plasma proteins, identifying 109 scores that explained between 1% and 58% of the variance in protein levels after adjusting for known protein quantitative trait loci (pQTL) genetic effects. By projecting these EpiScores into an independent sample (Generation Scotland; n = 9537) and relating them to incident morbidities over a follow-up of 14 years, we uncovered 137 EpiScore-disease associations. These associations were largely independent of immune cell proportions, common lifestyle and health factors, and biological aging. Notably, we found that our diabetes-associated EpiScores highlighted previous top biomarker associations from proteome-wide assessments of diabetes. These EpiScores for protein levels can therefore be a valuable resource for disease prediction and risk stratification.

Keywords: aging; biomarker; epidemiology; epigenetic; genetics; genomics; global health; human; morbiditiy; prediction; proteomics.

Plain language summary

Although our genetic code does not change throughout our lives, our genes can be turned on and off as a result of epigenetics. Epigenetics can track how the environment and even certain behaviors add or remove small chemical markers to the DNA that makes up the genome. The type and location of these markers may affect whether genes are active or silent, this is, whether the protein coded for by that gene is being produced or not. One common epigenetic marker is known as DNA methylation. DNA methylation has been linked to the levels of a range of proteins in our cells and the risk people have of developing chronic diseases. Blood samples can be used to determine the epigenetic markers a person has on their genome and to study the abundance of many proteins. Gadd, Hillary, McCartney, Zaghlool et al. studied the relationships between DNA methylation and the abundance of 953 different proteins in blood samples from individuals in the German KORA cohort and the Scottish Lothian Birth Cohort 1936. They then used machine learning to analyze the relationship between epigenetic markers found in people’s blood and the abundance of proteins, obtaining epigenetic scores or ‘EpiScores’ for each protein. They found 109 proteins for which DNA methylation patterns explained between at least 1% and up to 58% of the variation in protein levels. Integrating the ‘EpiScores’ with 14 years of medical records for more than 9000 individuals from the Generation Scotland study revealed 130 connections between EpiScores for proteins and a future diagnosis of common adverse health outcomes. These included diabetes, stroke, depression, various cancers, and inflammatory conditions such as rheumatoid arthritis and inflammatory bowel disease. Age-related chronic diseases are a growing issue worldwide and place pressure on healthcare systems. They also severely reduce quality of life for individuals over many years. This work shows how epigenetic scores based on protein levels in the blood could predict a person’s risk of several of these diseases. In the case of type 2 diabetes, the EpiScore results replicated previous research linking protein levels in the blood to future diagnosis of diabetes. Protein EpiScores could therefore allow researchers to identify people with the highest risk of disease, making it possible to intervene early and prevent these people from developing chronic conditions as they age.


Conflict of interest statement

DG, DM, SZ, AS, YC, CF, CN, AC, RF, SH, RW, LS, ET, CG, AP, MW, JG, AM, ID, DP, CH, PV, SC, KE, AM, KS No competing interests declared, RH has received consultant fees from Illumina, RM has received speaker fees from Illumina and is an advisor to the Epigenetic Clock Development Foundation

Figures

Figure 1.
Figure 1.. EpiScores for plasma proteins as tools for disease prediction study design.
DNA methylation scores were trained on 953 circulating plasma protein levels in the KORA and LBC1936 cohorts. There were 109 EpiScores selected based on performance (r > 0.1, p < 0.05) in independent test sets. The selected EpiScores were projected into Generation Scotland, a cohort that has extensive data linkage to GP and hospital records. We tested whether levels of each EpiScore at baseline could predict the onset of 12 leading causes of morbidity, over a follow-up period of up to 14 years; 130 EpiScore-disease associations were identified, for 10 morbidities. We then assessed whether EpiScore associations reflected protein associations for diabetes, which is a trait that has been well characterised using SOMAscan protein measurements. Of the 34 SOMAscan-derived EpiScore-diabetes associations, 28 highlighted previously reported protein-diabetes associations.
Figure 2.
Figure 2.. Test performance for the 109 selected protein EpiScores.
Test set correlation coefficients for associations between protein EpiScores for (a) inflammatory Olink, (b) neurology Olink, and (c) SOMAmer protein panel EpiScores and measured protein levels are plotted. 95% confidence intervals are shown for each correlation. The 109 protein EpiScores shown had r > 0.1 and p < 0.05 in either one or both of the GS:STRADL (n = 778) and LBC1921 (n = 162) test sets, wherever protein data was available for comparison. Data shown corresponds to the results included in Supplementary file 1B-C. Correlation heatmaps between the 109 EpiScore measures (Figure 2—figure supplement 1) are provided, along with a summary of the most enriched functional pathways for the genes of the 109 proteins used to train EpiScores (Figure 2—figure supplement 2).
Figure 2—figure supplement 1.
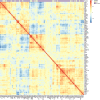
Figure 2—figure supplement 1.. Correlation heatmap for protein EpiScore measures in Generation Scotland.
Correlation heatmap for EpiScore measures projected into Generation Scotland (N = 9537) for the 109 protein EpiScores selected in the test sample (r > 0.1, p < 0.05). At the top of the heatmap, an annotation bar is displayed. Olink proteins are shown in pale green and Somalogic proteins are shown in purple.
Figure 2—figure supplement 2.
Figure 2—figure supplement 2.. GeneSet enrichment of canonical pathways common to the genes encoding proteins that were used to train the 109 selected EpiScores.
Genes selected for pathway enrichment (false discovery rate [FDR]-adjusted p < 0.05) are summarised, with the proportion of overlapping genes enriched in the gene-set also shown. The corresponding data for this figure can be accessed in full in Supplementary file 1H.
Figure 3.
Figure 3.. Nested Cox proportional hazards assessment of protein EpiScore-disease prediction.
Mixed effects Cox proportional hazards analyses in Generation Scotland (n = 9537) tested the relationships between each of the 109 selected EpiScores and the incidence of 12 leading causes of morbidity (Supplementary file 1I-J). The basic model was adjusted for age and sex and yielded 286 associations between EpiScores and disease diagnoses, with false discovery rate (FDR)-adjusted p < 0.05. In the fully adjusted model, which included common risk factors as additional covariates (smoking, deprivation, educational attainment, body mass index (BMI), and alcohol consumption), 130 of the basic model associations remained significant with p < 0.05. In a sensitivity analysis, the addition of estimated white blood cells (WBCs) to the fully adjusted models led to the attenuation of 31 of the 130 associations. In a further sensitivity analysis, 78 associations remained after adjustment for both immune cell proportions and GrimAge acceleration.
Figure 3—figure supplement 1.
Figure 3—figure supplement 1.. Phenotypic trait and estimated white blood cell proportion correlations with EpiScores.
Heatmap of Pearson's correlations (r) between the 70 protein EpiScore measures that were associated with incident disease (with p < 0.05 in the fully adjusted Cox mixed effects proportional hazards models) and continuous phenotypic/lifestyle trait variables and Houseman-estimated white blood cell proportions in Generation Scotland (total N = 9537). Protein measurements used to train the predictors were adjusted for age and sex. The maximum sample size available was used for each correlation. GrimAge: GrimAge acceleration. Units: weekly units of alcohol. EpiSmoker: DNAm-derived score for smoking. SIMD: Scottish Index of Multiple Deprivation. EA: educational attainment. Mono: monocytes. Gran: granulocytes. NK: natural killer cells.
Figure 4.
Figure 4.. Protein EpiScore associations with incident disease.
EpiScore-disease associations for 9 of the 11 morbidities with associations where p < 0.05 in the fully adjusted mixed effects Cox proportional hazards models in Generation Scotland (n = 9537). Hazard ratios are presented with confidence intervals for 92 of the 130 EpiScore-incident disease associations reported. Models were adjusted for age, sex, and common risk factors (smoking, body mass index (BMI), alcohol consumption, deprivation, and educational attainment). IBD: inflammatory bowel disease. IHD: ischaemic heart disease. COPD: chronic obstructive pulmonary disease. For EpiScore-diabetes associations, see Figure 6. Data shown corresponds to the results included in Supplementary file 1J.
Figure 5.
Figure 5.. Protein EpiScores that associated with the greatest number of morbidities.
EpiScores with a minimum of three relationships with incident morbidities in the fully adjusted Cox models. The network includes 16 EpiScores as dark blue (SOMAscan) and grey (Olink) nodes, with disease outcomes in black. EpiScore-disease associations with hazard ratios < 1 are shown as blue connections, whereas hazard ratios > 1 are shown in red. COPD: chronic obstructive pulmonary disease. IHD: ischaemic heart disease. Data shown corresponds to the results included in Supplementary file 1J.
Figure 6.
Figure 6.. Replication of known protein-diabetes associations with protein EpiScores.
EpiScore-incident diabetes associations in Generation Scotland (n = 9537). The 34 SOMAscan (top panel) and four Olink (bottom panel) associations shown with p < 0.05 in fully adjusted mixed effects Cox proportional hazards models. Of the 34 SOMAscan-derived EpiScores, 28 associations were consistent with protein-diabetes associations (pink) in one or more of the comparison studies that used SOMAscan protein levels. Six associations were novel (blue). Data shown corresponds to the results included in Supplementary files 1J and M.
Author response image 1.

Comment in

  • Getting closer to the clinic.
    Tanaka T, Ferrucci L. Tanaka T, et al. Elife. 2022 Feb 25;11:e77180. doi: 10.7554/eLife.77180. Elife. 2022. PMID: 35212264 Free PMC article.

References

    1. Alatab S, Sepanlou SG, Ikuta K, Vahedi H, Bisignano C, Safiri S, Sadeghi A, Nixon MR, Abdoli A, Abolhassani H, Alipour V, Almadi MAH, Almasi-Hashiani A, Anushiravani A, Arabloo J, Atique S, Awasthi A, Badawi A, Baig AAA, Naghavi M. The global, regional, and national burden of inflammatory bowel disease in 195 countries and territories, 1990-2017: a systematic analysis for the Global Burden of Disease Study 2017. The Lancet. Gastroenterology & Hepatology. 2020;5:17–30. doi: 10.1016/S2468-1253(19)30333-4. - DOI - PMC - PubMed
    1. Alawieh A, Langley EF, Tomlinson S. Targeted complement inhibition salvages stressed neurons and inhibits neuroinflammation after stroke in mice. Science Translational Medicine. 2018;10:eaao6459. doi: 10.1126/scitranslmed.aao6459. - DOI - PMC - PubMed
    1. Amador C, Huffman J, Trochet H, Campbell A, Porteous D, Wilson JF, Hastie N, Vitart V, Hayward C, Navarro P, Haley CS, Generation Scotland Recent genomic heritage in Scotland. BMC Genomics. 2015;16:437. doi: 10.1186/s12864-015-1605-2. - DOI - PMC - PubMed
    1. Aryee MJ, Jaffe AE, Corrada-Bravo H, Ladd-Acosta C, Feinberg AP, Hansen KD, Irizarry RA. Minfi: a flexible and comprehensive Bioconductor package for the analysis of Infinium DNA methylation microarrays. Bioinformatics. 2014;30:1363–1369. doi: 10.1093/bioinformatics/btu049. - DOI - PMC - PubMed
    1. Bollepalli S, Korhonen T, Kaprio J, Anders S, Ollikainen M. EpiSmokEr: a robust classifier to determine smoking status from DNA methylation data. Epigenomics. 2019;11:1469–1486. doi: 10.2217/epi-2019-0206. - DOI - PubMed

Publication types