. 2021 Dec 11:27:335-348.
doi: 10.1016/j.omtn.2021.12.013. eCollection 2022 Mar 8.

Mechanism of action of hepatitis B virus S antigen transport-inhibiting oligonucleotide polymer, STOPS, molecules

Affiliations

Mechanism of action of hepatitis B virus S antigen transport-inhibiting oligonucleotide polymer, STOPS, molecules

C Cheng Kao et al. Mol Ther Nucleic Acids. .

Abstract

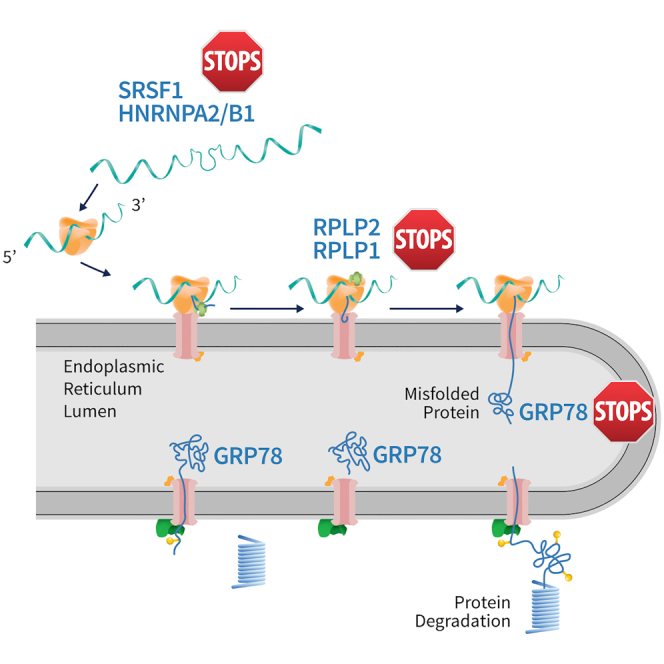
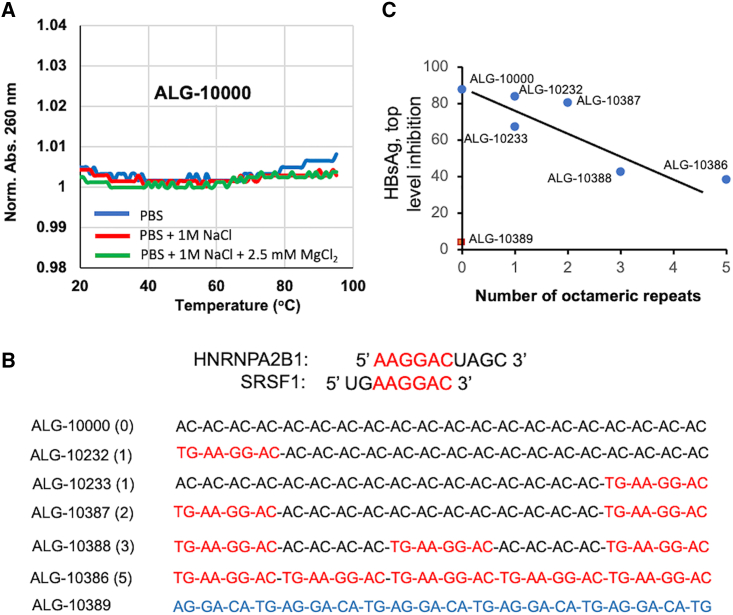
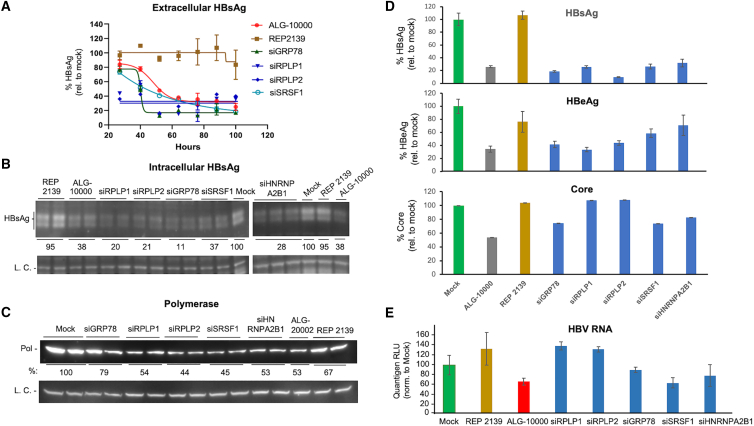
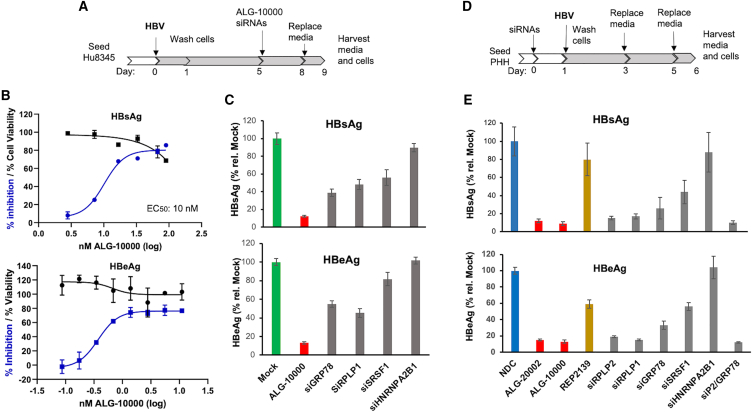
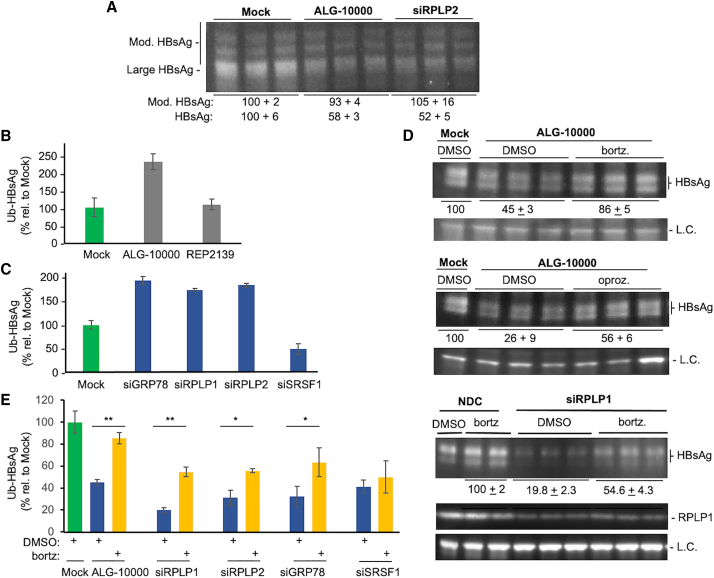
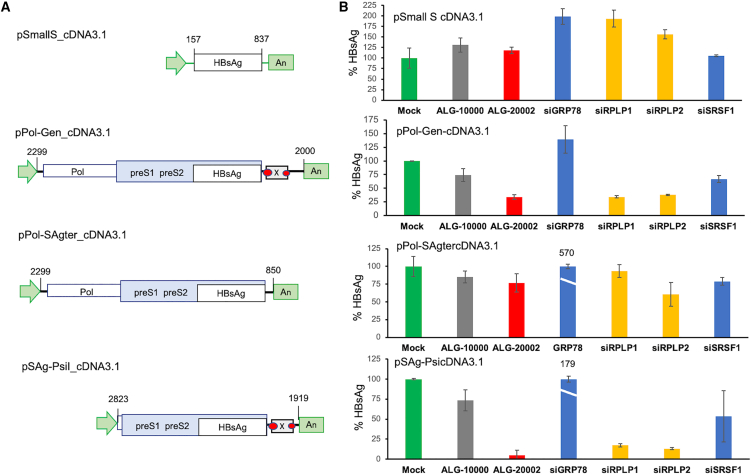
A functional cure of chronic hepatitis B requires eliminating the hepatitis B virus (HBV)-encoded surface antigen (HBsAg), which can suppress immune responses. STOPS are phosphorothioated single-stranded oligonucleotides containing novel chemistries that significantly reduce HBsAgs produced by HBV-infected liver cells. The STOPS molecule ALG-10000 functions inside cells to reduce the levels of multiple HBV-encoded molecules. However, it does not bind HBV molecules. An affinity resin coupled with ALG-10000 was found to bind several proteins from liver cells harboring replicating HBV. Silencing RNAs targeting host factors SRSF1, HNRNPA2B1, GRP78 (HspA5), RPLP1, and RPLP2 reduced HBsAg levels and other HBV molecules that are concomitantly reduced by STOPS. Host proteins RPLP1/RPLP2 and GRP78 function in the translation of membrane proteins, protein folding, and degradation. ALG-10000 and the knockdowns of RPLP1/2 and GRP78 decreased the levels of HBsAg and increased their ubiquitination and proteasome degradation. GRP78, RPLP1, and RPLP2 affected HBsAg production only when HBsAg was expressed with HBV regulatory sequences, suggesting that HBV has evolved to engage with these STOPS-interacting molecules. The STOPS inhibition of HBsAg levels in HBV-infected cells occurs by sequestering cellular proteins needed for proper expression and folding of HBsAg.

Keywords: GRP78; HBV S antigen; RPLP1; RPLP2; antiviral; chronic hepatitis B; functional cure; hepatitis B virus; host factors; nucleic acid polymers.


Conflict of interest statement

All authors declare no competing interests.

Figures

None
Graphical abstract
Figure 1
Figure 1
ALG-10000, a prototype STOPS molecule (A) The chemical structure of ALG-10000. lnA denotes an LNA nucleotide of adenosine. ps denotes a phosphorothioate. ln(5m)C denotes an LNA 5-methylcytosine. (B) ALG-10000 can inhibit HBV infection of HepG2 cells expressing the HBV entry receptor NTCP. The schematic details the protocol used. The dose-response curve for the inhibition of extracellular HBsAg is shown in blue, while the effect on cell viability is shown in black. Each error bar represents one standard deviation of uncertainty. (C) ALG-10000 can reduce extracellular HBsAg produced by the integrated HBV genome in HepG2.2.15 cells. The dose response for inhibition of extracellular HBsAg is shown in blue, and the effect on cell viability is shown in black. Each error bar represents one standard deviation of uncertainty.
Figure 2
Figure 2
Properties of ALG-1000 inhibition of HBV replication (A) Kinetics of the inhibition of extracellular HBsAg by ALG-10000 and REP 2139. Each of the data points represents the HBsAg amount present in the HepG2.2.15 cell culture medium over a 12-h period. The amount is normalized to the levels in the mock-transfected cells. ALG-10000 was transfected into cells at 8 nM and REP 2139 at 20 nM. (B) Western blot image showing that ALG-10000 reduces intracellular large S antigen in HepG2.2.15 cells. L.C. denotes a loading control. (C) Dose response for the inhibition of HBeAg production by HepG2.2.15 cells. HBeAg cell viability shown in green and cell viability in black. (D) Western blot image showing that ALG-10000 can inhibit HBV polymerase accumulation. ALG-20002 was transfected at 5 nM. REP 2139 was transfected at 40 nM. The LC is the cellular GAPDH protein. (E) ALG-10000 can inhibit the accumulation of the HBV core in a concentration-dependent manner. (F) ALG-10000 can modestly reduce the accumulation of total HBV RNA present in the cell. HBV RNAs present in the cell lysate 72 h after transfection were quantified by detection of the HBx sequence found in all HBV RNAs. ALG-20002 is an antisense oligonucleotide that directly targets HBV RNA sequences for degradation. In the graphs in panel A, C, and F, each error bar represents one standard deviation of uncertainty.
Figure 3
Figure 3
Five host proteins that bind ALG-10000 affect extracellular HBsAg levels (A) Partial list of proteins that bind ALG-10000 affinity column. The proteins listed are identified with high confidence. (B) Dose responses for the inhibition of extracellular HBsAg levels and effects on cell viability by siRNA knockdowns of the host factors. Each error bar represents one standard deviation of uncertainty. (C) Recombinant proteins of RPLP1, RPLP2, GRP78, and HNRNPA2B1 can bind ALG-10000. The image is of a silver-stained polyacrylamide gel. The lane labeled “Proteins” contains the input proteins present in the analysis. The lane labeled “Tris” shows the amounts of the proteins pulled down by the affinity resin that lacks ALG-10000. (D) ALG-10000 can decrease the abundance of three of the cellular proteins that interact with ALG-10000. The image is from a western blot analysis of lysates from HepG2.2.15 cells that were transfected with 8 nM ALG-10000 and harvested 76 h after transfection.
Figure 4
Figure 4
STOPS interact with multiple host factors to maximally inhibit extracellular HBsAg (A) ALG-10000 lacks significant intramolecular or intermolecular base-pairing interactions. The absorbance of ALG-10000 under increasing temperature was measured with 2 μM ALG-10000 in three distinct buffers: PBS (blue line), PBS amended with 1 M NaCl (red line), and PBS amended with 1 M NaCl and 2.5 mM MgCl2 (green line). (B) Sequence recognized by host factors HNRNPA2B1 and SRSF1 and built into STOPS molecules. The sequences recognized by both proteins are shown in red. The STOPS molecule's names are followed by parentheses that contain the number of HNRNPA2B1/SFSR1 recognition sequences. The HNRNPA2B1/SRSF1 recognition sequence(s) in the STOPS molecule are shown in red. ALG-10389 is a STOPS molecule that contains five scrambled sequences recognized by HNRNPA2B1 and SRSF1 (blue). (C) The maximum level of HBsAg inhibition decreases with increasing number of the HNRNPA2B1/SFSR1 recognition sequences. ALG-10389 (red square), the STOPS molecule with scrambled nucleotides, was unable to inhibit HBsAg levels.
Figure 5
Figure 5
The five host factors affect the abundance of multiple HBV molecules (A) Kinetics of the decrease in extracellular HBsAg produced by HepG2.2.15 cells transfected with siRNAs. The amount of HBsAg produced was measured in 12-h intervals after siRNA transfection and normalized to the level produced by mock-treated cells. The siRNAs were transfected at a final concentration of 10 nM. REP 2139 was at 20 nM. (B) siRNAs that knock down the five host factors reduced the levels of intracellular HBsAg. The western blot image contains the signal for the large S antigen. The LC is of the β-actin protein. The knockdown of the host factors is shown in Figure S3. (C) The five host factor siRNAs can reduce the HBV polymerase levels. The western blot image shows the amounts of the HBV polymerase identified by a monoclonal antibody specific to the HBV polymerase. The L.C. shows the amount of β-actin protein. Additional western blots of cellular proteins are shown in Figure S6. HepG2.2.15 cells were transfected with a final concentration of10 nM siRNA, 5 nM ALG-20002, 8 nM ALG-10000, or 20 nM REP 2139. (D) The host factors have differential effects on the amounts of HBsAg, HBeAg, and core. ALG-10000 was transfected into HepG2.2.15 cells at 8 nM and the siRNAs at 10 nM. (E) Total HBV RNAs are modestly reduced by the knockdown of SRSF1 and HNRNPA2B1, but not by knockdown of RPLP1 or RPLP2. The cells were harvested 76 h after transfection. The amount of HBV RNA was normalized to the amount of GAPDH in the cells. In the graphs on panel A and D, each error bar represents one standard deviation of uncertainty.
Figure 6
Figure 6
Four of the five host factors have roles in the HBV infection of PHHs (A) Schematic detailing the manipulation of the PHH that applies to the results in (B) and (C) HBV infection used 200 viral genome equivalents. (B) Dose response on the inhibition of HBsAg and HBeAg produced by HBV infection of PHH. The effect of the ALG-10000 on cell viability is shown in black. Each error bar represents one standard deviation of uncertainty.(C) Effects of siRNA knockdown on the amount of extracellular HBsAg and HBeAg produced by HBV-infected PHH. The results are normalized to the amount of the molecules produced by mock-transfected, HBV-infected PHHs (green bars). ALG-10000 (red bars) and the siRNAs (gray bars) were transfected at 20 nM in this experiment. (D) Schematic for the manipulation of the PHH and HBV infection. HBV infection used 200 viral genome equivalents. (E) Effects of knockdown of host factor siRNAs on the amounts of extracellular HBsAg and HBeAg produced by infecting HBV. ALG-10000 and all siRNAs were transfected at 20 nM. In the samples labeled siP2/GRP78, 10 nM siRPLP2 and siGRP78 were transfected.
Figure 7
Figure 7
STOPS reduction of HBsAg involves ubiquitination of the HBsAg and proteasome degradation (A) HBsAg has post-translational modifications. The HBsAg was from HepG2.2.15 cells treated with 8 nM ALG-10000 or 10 nM siRPLP2 for 76 h. The most prominent band is the molecular mass expected of the large HBsAg. Additional higher-molecular-weight bands may be ubiquitinated forms of the HBsAg. (B) Intracellular HBsAg in HepG2.2.15 cells treated with ALG-10000 increased the amount of ubiquitin. The ubiquitinated HBsAg assayed was from cells treated for 76 h with 8 nM ALG-10000. (C) Knockdown of GRP78, RPLP1, and RPLP2 can increase HBsAg ubiquitination. All siRNAs were transfected into HepG2.2.15 cells at a final concentration of 10 nM. The amount of ubiquitinated HBsAg was normalized to the amount of HBsAg present in the cell lysate. (D) Proteasome inhibitors can partially reverse ALG-10000-mediated reduction of HBsAg and RPLP1 levels. The images of the western blot show the large HBsAg in HepG2.2.15 transfected with 10 nM ALG-10000 and treated with the proteasome inhibitor bortezomib (25 nM), or oprozomib (100 nM), or DMSO, the vehicle used to solubilize the proteasome inhibitors. The cells were treated for 24 h before their lysis for western blot analysis. The LC is the protein GAPDH. siRPLP1 was transfected at 10 nM and the cells treated with bortezomib are as described in (A). (E) The amount of ubiquitinated HBsAg present in HepG2.2.15 cells after treatment with ALG-10000 or knockdown of GRP78, RPLP1, and RPLP2 is increased by treatment with the proteasome inhibitor bortezomib. ∗p < 0.05, ∗∗p < 0.01. In the graphs in panels D, C, and E, each error bar represents one standard deviation of uncertainty.
Figure 8
Figure 8
RPLP1 and RPLP2 require regulatory HBV sequences to function on HBsAg production (A) Schematics of the HBV sequences cloned in plasmid pcDNA3.1 tested for HBsAg production. The nucleotide number of the HBV genome is shown at the flanks of the DNA sequence. The green arrow represents the human cytomegalovirus promoter. The green box labeled with “An” represents the polyadenylation sequence. Both the promoter and polyadenylation sequence are present in pcDNA3.1. Boxes represent the coding sequence for HBV genes. The two red ovals denote HBV enhancer sequences. (B) Relative amounts of the HBsAg produced in HEK 293 cells transfected with STOPS, siRNAs, or ALG-20002. HBsAg levels were reproducibly increased by the knockdown of GRP78 in cells transfected with pPol_SAgtercDNA3.1 and pSAg-PsicDNA3.1. The percentages of HBsAg expressed from these plasmids relative to the mock-treated control (pCDNA3.1) are shown above the blue bars. Each error bar represents one standard deviation of uncertainty.

References

    1. World Health Organization . World Health Organization; 2021. Global Progress Report on HIV, Viral Hepatitis and Sexually Transmitted Infections. ISBN: 978-92-4-002707-7.
    1. Tang L.S.Y., Covert E., Wilson E., Kottilil S. Chronic hepatitis B infection, a review. JAMA 319:1802-1813.6. Yip TC, Lok AS. 2020. How do we determine whether a functional cure of HBV infection has been achieved? Clin. Gastroenterol. Hepatol. 2018;18:548–550.
    1. Faure-Dupuy S., Lucifora J., Durantel D. Interplay between the hepatitis B virus and innate immunity: from an understanding to the development of therapeutic concepts. Viruses. 2017;9:95. - PMC - PubMed
    1. Tan A., Koh S., Bertoletti A. Immune response in hepatitis B virus infection. Cold Spring Harb Perspect. Med. 2015;5:a021428. - PMC - PubMed
    1. Kim W.R. Emerging therapies toward a functional cure for hepatitis B virus infection. Gastroenterol. Hepatol. 2018;14:439–442. - PMC - PubMed

LinkOut - more resources