. 2022 Mar 1;61(5):385-397.
doi: 10.1021/acs.biochem.1c00696. Epub 2022 Jan 13.

Anionic Lipids Confine Cytochrome c2 to the Surface of Bioenergetic Membranes without Compromising Its Interaction with Redox Partners

Affiliations

Anionic Lipids Confine Cytochrome c2 to the Surface of Bioenergetic Membranes without Compromising Its Interaction with Redox Partners

Chun Kit Chan et al. Biochemistry. .

Abstract

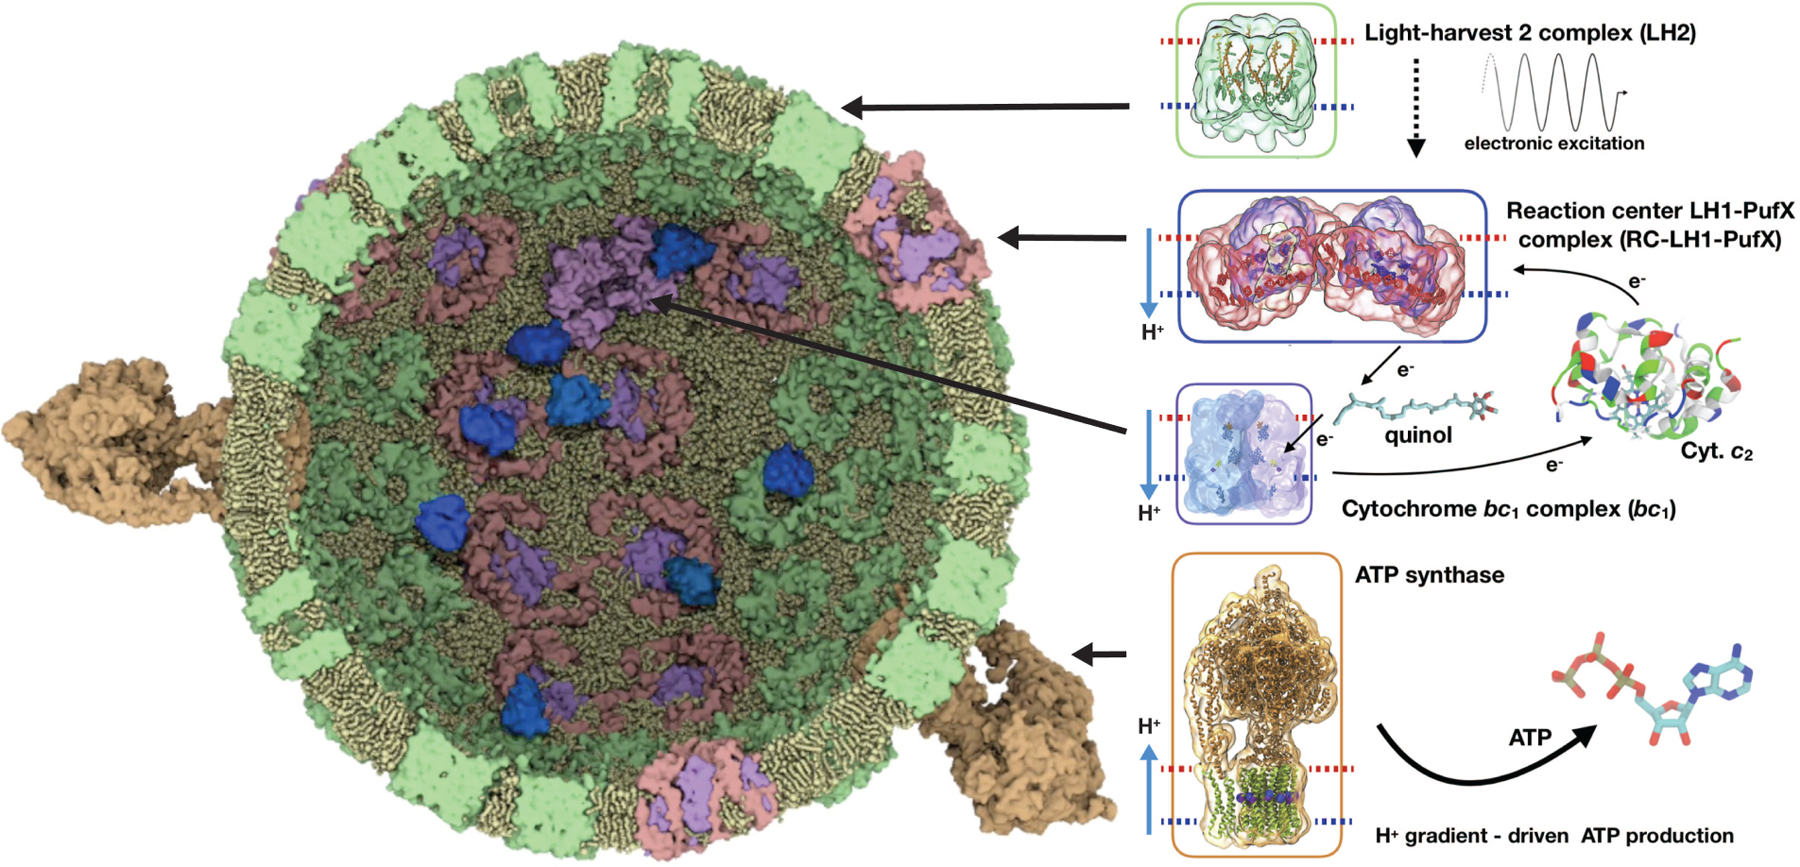
Cytochrome c2 (cyt. c2) is a major element in electron transfer between redox proteins in bioenergetic membranes. While the interaction between cyt. c2 and anionic lipids abundant in bioenergetic membranes has been reported, their effect on the shuttling activity of cyt. c2 remains elusive. Here, the effect of anionic lipids on the interaction and binding of cyt. c2 to the cytochrome bc1 complex (bc1) is investigated using a combination of molecular dynamics (MD) and Brownian dynamics (BD) simulations. MD is used to generate thermally accessible conformations of cyt. c2 and membrane-embedded bc1, which were subsequently used in multireplica BD simulations of diffusion of cyt. c2 from solution to bc1, in the presence of various lipids. We show that, counterintuitively, anionic lipids facilitate association of cyt. c2 with bc1 by localizing its diffusion to the membrane surface. The observed lipid-mediated bc1 association is further enhanced by the oxidized state of cyt. c2, in line with its physiological function. This lipid-mediated enhancement is salinity-dependent, and anionic lipids can disrupt cyt. c2-bc1 interaction at nonphysiological salt levels. Our data highlight the importance of the redox state of cyt. c2, the lipid composition of the chromatophore membrane, and the salinity of the chromatophore in regulating the efficiency of the electron shuttling process mediated by cyt. c2. The conclusions can be extrapolated to mitochondrial systems and processes, or any bioenergetic membrane, given the structural similarity between cyt. c2 and bc1 and their mitochondrial counterparts.


Figures

Figure 1:
Figure 1:. The role of cyt. c2 shuttling in the photon-induced ATP production in the chromatophore.
Cross-sectional view of a molecular model,, for the chromatophore in the purple bacteria is shown on the left, with bc1 (PDB: 2QJY), LH2 (PDB: 1NKZ), and ATP synthase (PDB: 3VR2) colored in purple, light green, and light brown, respectively. For the RC-LH1-PufX (PDB: 6ET5) sites, where RC and LH1 form complexes, RC are colored in light purple and LH1 in magenta. Cyt. c2 (PDB: 1L9B) proteins, colored in blue, are mobile and shuttle inside the chromatophore. On the right, processes of light energy transfer and electron transport are summarized. Proton (H+) translocation across the chromatophore membrane is indicated by blue arrows, with the side of the membrane facing the exterior (interior) of the chromatophore represented by a red (blue), dashed line. Reprinted with permission from ref. Copyright 2019 CELL Press.
Figure 2:
Figure 2:. Interplay of transmembrane redox proteins, soluble electron-shuttling proteins, and lipids in bioenergetic membranes.
(A) Respiratory and photosynthetic membranes employ soluble, shuttling proteins (yellow) to mediate electron (e) transport between transmembrane redox protein complexes (purple and blue). During this process, the shuttling protein diffuses between the electron-donor (magenta) and -acceptor (blue) proteins frequently. The lipid phase of the membrane, which is often rich in negative charges (red circles) in bioenergetic membranes, can both confine the diffusion of the soluble protein to the surface of the membrane and/or directly affect its mobility. Diffusing without interaction with membrane lipids (largely diffusing in bulk solution) is denoted as Path 1. In the case of diffusion on the surface of the membrane while interacting with anionic lipids (Path 2), the soluble protein remains close to the membrane surface, and its motion can be described as a 2D diffusion. Surface-bounded diffusion has been hypothesized to exist as a result of the ubiquitous presence of negative charges in bioenergetic membranes. In purple bacterial chromatophore, cyt. c2, the soluble protein, shuttles between bc1, the e donor, and RC, the e receptor. (B) Molecular representations of cyt. c2 (yellow) and bc1 (purple), and the two types of cyt. c2 diffusion (Paths 1 and 2) to bind to bc1. The phosphorus atoms of lipid molecules in the membrane are shown as red spheres for anionic lipids and as white spheres for other lipids.
Figure 3:
Figure 3:. Lipid-Mediated Association of cyt. c2 to bc1 (LMAC2→C1).
(A) Snapshots depicting an example of LMAC2→C1. The process involves initial association of cyt. c2 to the lipid bilayer, followed by its hopping onto bc1. These different stages are shown chronologically from the left to the right. The approximate surface of the lipid bilayer and bc1 are marked by cyan and red lines, respectively. The region between these lines is considered as the vicinity of the lipid bilayer (Sec.S1.5). The quantity, dC2−lipids (Sec. S1.5), denotes the separation of the center of mass (COM) of cyt. c2 from the membrane’s phosphorus plane on the periplasmic side. bc1 is shown in purple; the PC, PE, PG, and CL lipids are shown in blue, cyan, dark green, and orange, respectively. Same coloring scheme used in (D) and (E). (B) Distance travelled by cyt. c2 after its first lipid association during LMAC2→C1, calculated only in the xy plane (i.e., along the membrane surface). For each LMAC2→C1 event, the measurement starts from first binding of cyt. c2 to the lipid bilayer and ends when it associated with bc1. (C) Distribution of dC2−lipids distances defined in (A), for all cyt. c2 cases involved in LMAC2→C1. dC2−lipids was measured from the time cyt. c2 associates with the lipids until it binds bc1. The red and cyan lines are defined in (A). (D) A representative trajectory of LMAC2→C1. The COM of cyt. c2 at each time point is drawn as a sphere, with its color indicating the time (shown in the color bar). A surface representation for cyt. c2, instead of just its COM, at t = 0 is shown in black. (E) An example of a lipid-associated cyt. c2 located ∼110 Å from bc1, a distance that represents the average cyt. c2-bc1 separation at the first encounter of cyt. c2 with lipids during an LMAC2→C1 event. The electrostatic potential (red) of the bc1-embedded membrane is shown by its contour surface at −0.5kBT.
Figure 4:
Figure 4:. Impacts of anionic lipids on cyt. c2 - bc2 associations
(A)&(B) Time evolution of the fraction of cyt. c2 associated with bc1. The legend, ”C1xC2Y-Z”, indicates the redox state of bc1 (x), the redox state of cyt. c2 (Y), and the type of lipid bilayer employed in the specific set of BD simulations (Sec. 2.5 of Methods). An oxidized state is denoted as ”ox”, and a reduced state is denoted as ”red”. The control bilayer and the chromatophore-like bilayer are denoted as ”PC” and ”ChP”, respectively. In (B), the time evolution for BD simulations employing the ChP bilayer are shown as 2 types of time series, one with and another without contributions from LMAC2→C1 (Sec.3.1 of Results and Discussions). The ones without contributions from LMAC2→C1 only consist of contributions from which cyt. c2 diffuse to and associate with bc1 completely in the bulk solution without any lipid association. This type of associations is here coined as Direct Association of cyt. c2 to bc1 (DAC2→C1). Our data for C2red reveals a straight forward enhancement to cyt. c2 - bc1 associations upon the presence of an electro-negative membrane (CL); where as a more complicated condition is found for C2ox. This complication is discussed in the main text.
Figure 5:
Figure 5:. Effect of the redox state of cyt. c2 on its interactions with bc1 and lipids.
(A) Probabilities for individual residues of cyt. c2 to make contacts with an association partner for C2red and C2ox (Sec. S1.3). The probability threshold (> 0.25) used to classify hotspot residues is indicated by a dashed line. Basic hotspot residues are marked by a ‘+’ sign. No acidic hotspot residues were observed. (B) Hotspot residues for C2red (left) and C2ox (right) are shown in licorice representations and labeled. Basic residues are in blue, polar ones in green, and A34 from C2red (non-polar) is in white. (C) Residue-based root mean squared deviations (RMSDs) between C2red and C2ox, averaged over the MD simulations (Sec. 2.1). The Cα atoms of residues with RMSDs higher than 4 Å(dashed line) are shown as glassy spheres in the molecular image. The inset displays an overlay of C2ox (blue) and C2red (red) structures, obtained from the last frame of MD simulations, indicating high structural similarity between the two redox forms.
Figure 6:
Figure 6:. Impact of salinity on cyt. c2-bc1 association.
(A) and (B) Time evolution of the fraction of cyt. c2 associated with bc1 for BD simulations at 0.40M (A) and 0.02M (B) salinity. (C) Change in the electrostatic potential of bc1 upon reduction of salinity from 0.15M to 0.02M. The potential shown is derived from the control membranes to focus the comparison only on the electrostatic potential of bc1. Cross sectional views of contour surfaces corresponding to the potentials at −1 kBT, −0.5 kBT, and −0.1 kBT are shown in red, orange, and yellow, respectively. The outward expansion of the yellow contour surface upon the decreased salinity is around 30 Å, and is indicated by a black arrow. For cyt. c2 associating to bc1 through LMAC2→C1, their mean separation from bc1 at the beginning of respective BD simulations is 130 Å (Fig. S11). This separation is indicated by a cyan arrow in each sub-figure.

Similar articles

Cited by

References

    1. Madigan M In The purple phototrophic bacteria; Hunter CN, Daldal F, Thurnauer MC, and Beatty JT, Eds.; Advances in photosynthesis and respiration; Springer, 2008; Vol. 28; pp 1–15.
    1. Cartron ML, Olsen JD, Sener M, Jackson PJ, Brindley AA, Qian P, Dickman MJ, Leggett GJ, Schulten K, and Hunter CN (2014) Integration of energy and electron transfer processes in the photosynthetic membrane of Rhodobacter sphaeroides. Biochimica et Biophysica Acta (BBA) - Bioenergetics 1837, 1769–1780. - PMC - PubMed
    1. Sener M, Strümpfer J, Singharoy A, Hunter CN, and Schulten K (2016) Overall energÿ conversion efficiency of a photosynthetic vesicle. eLife 5, e09541. - PMC - PubMed
    1. Ritz T, Park S, and Schulten K (2001) Kinetics of excitation migration and trapping in the photosynthetic unit of purple bacteria. J. Phys. Chem. B 105, 8259–8267.
    1. Okamura M, Paddock M, Graige M, and Feher G (2000) Proton and electron transfer in bacterial reaction centers. Biochimica et Biophysica Acta (BBA) - Bioenergetics 1458, 148–163. - PubMed

Publication types