. 2022 Jan 14;375(6577):214-221.
doi: 10.1126/science.abg3067. Epub 2022 Jan 13.

Olfactory receptor 2 in vascular macrophages drives atherosclerosis by NLRP3-dependent IL-1 production

Affiliations

Olfactory receptor 2 in vascular macrophages drives atherosclerosis by NLRP3-dependent IL-1 production

Marco Orecchioni et al. Science. .

Abstract

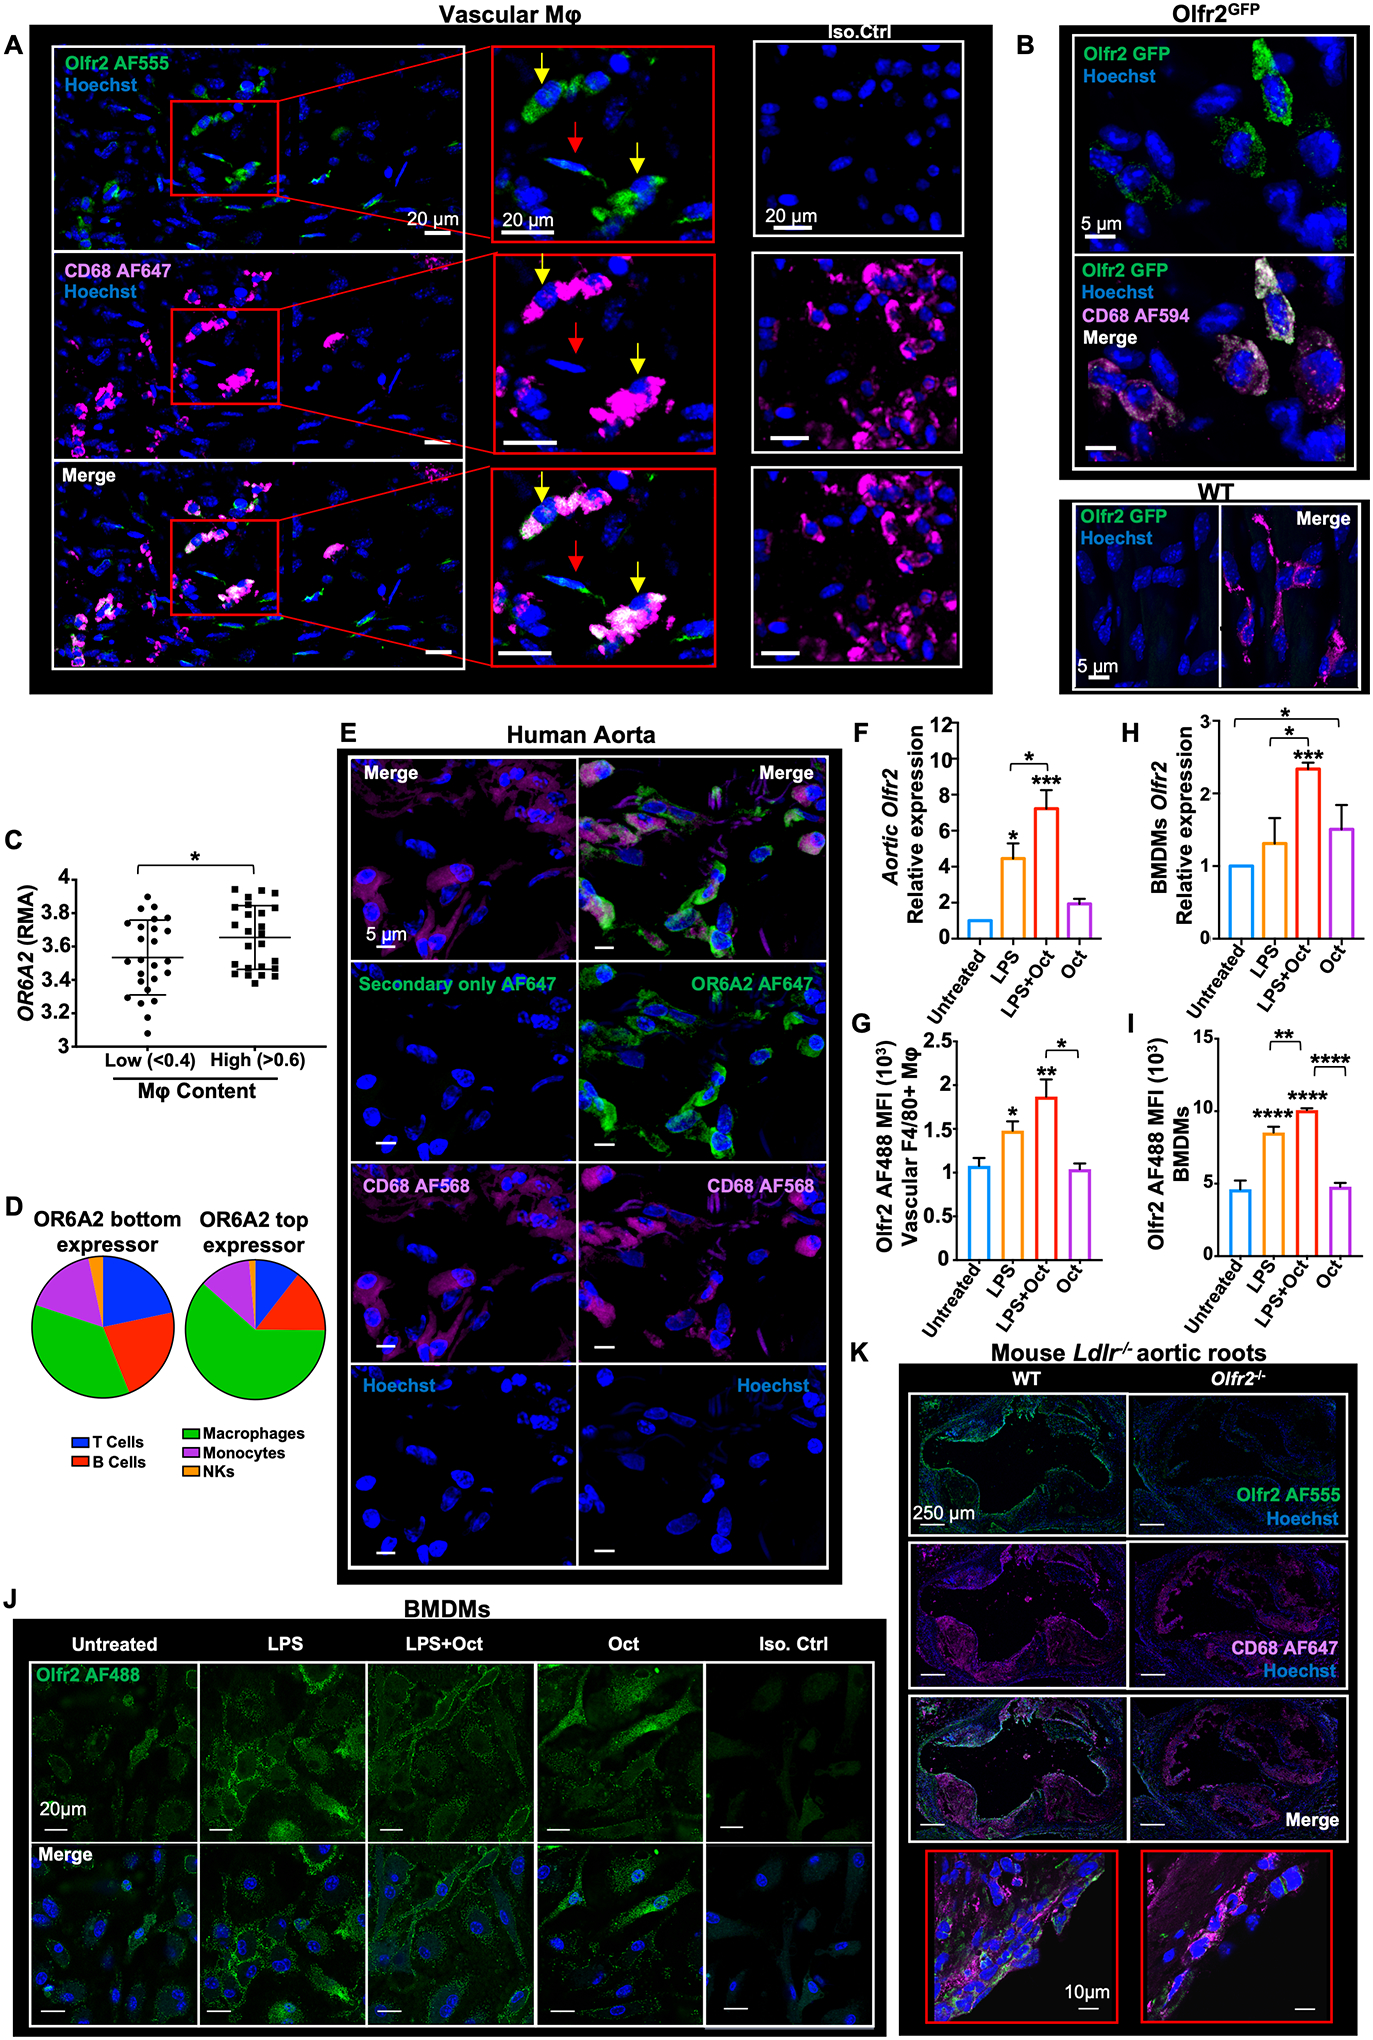
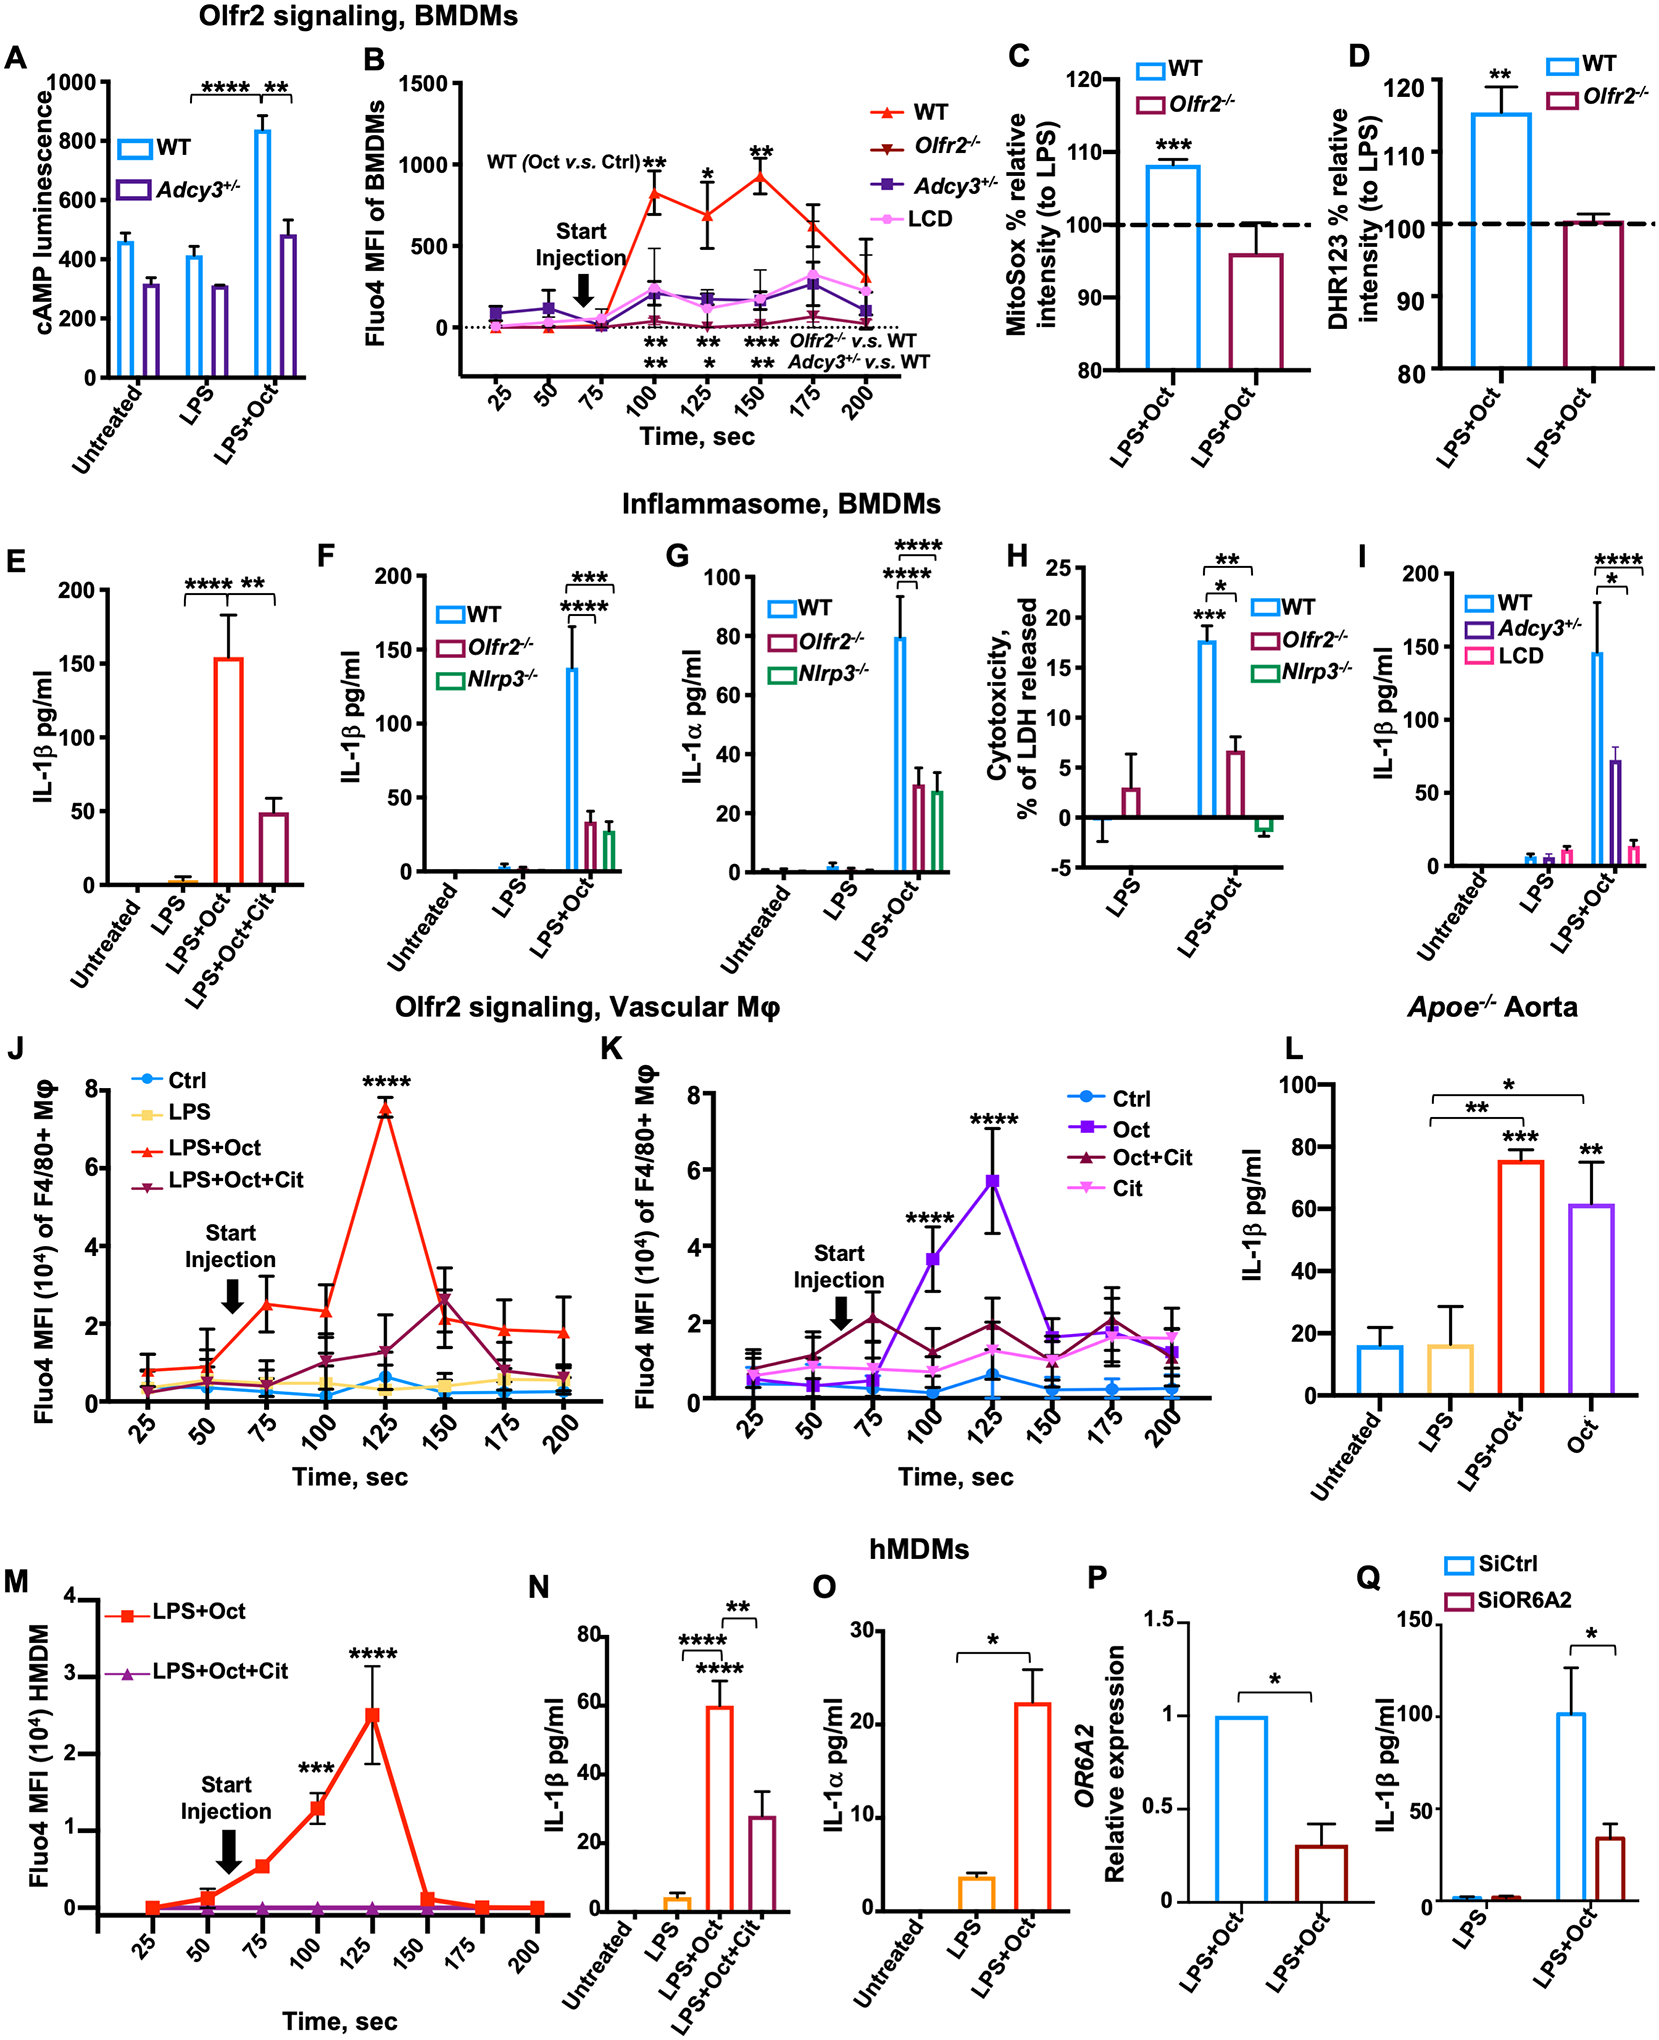
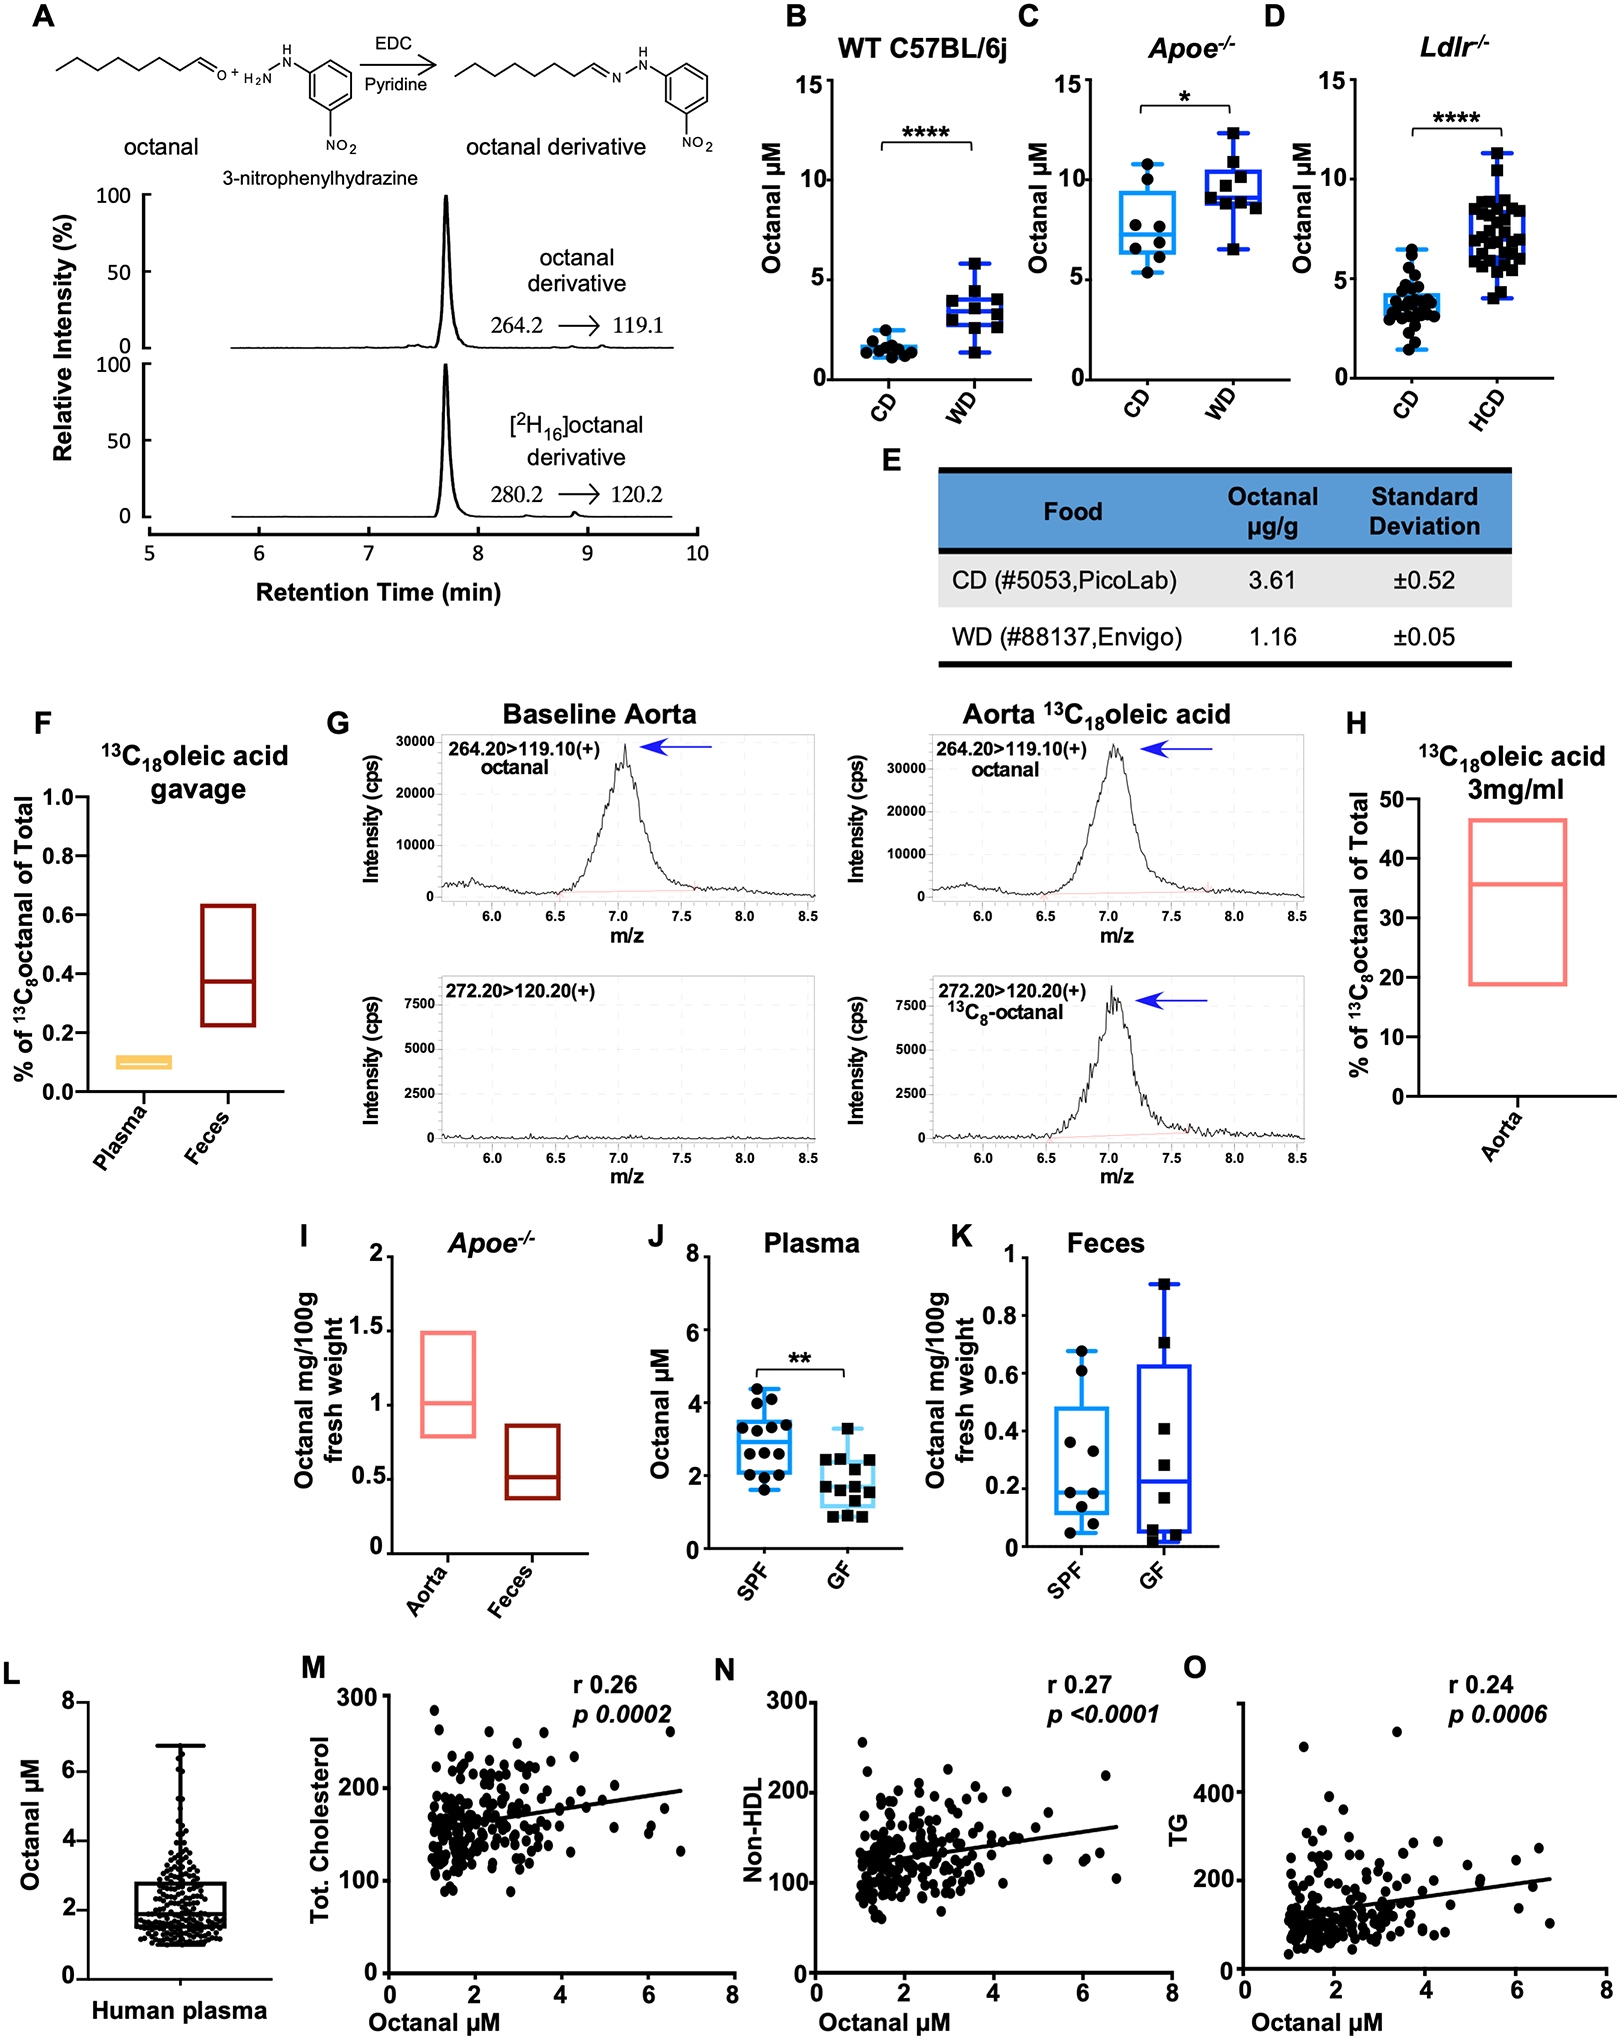
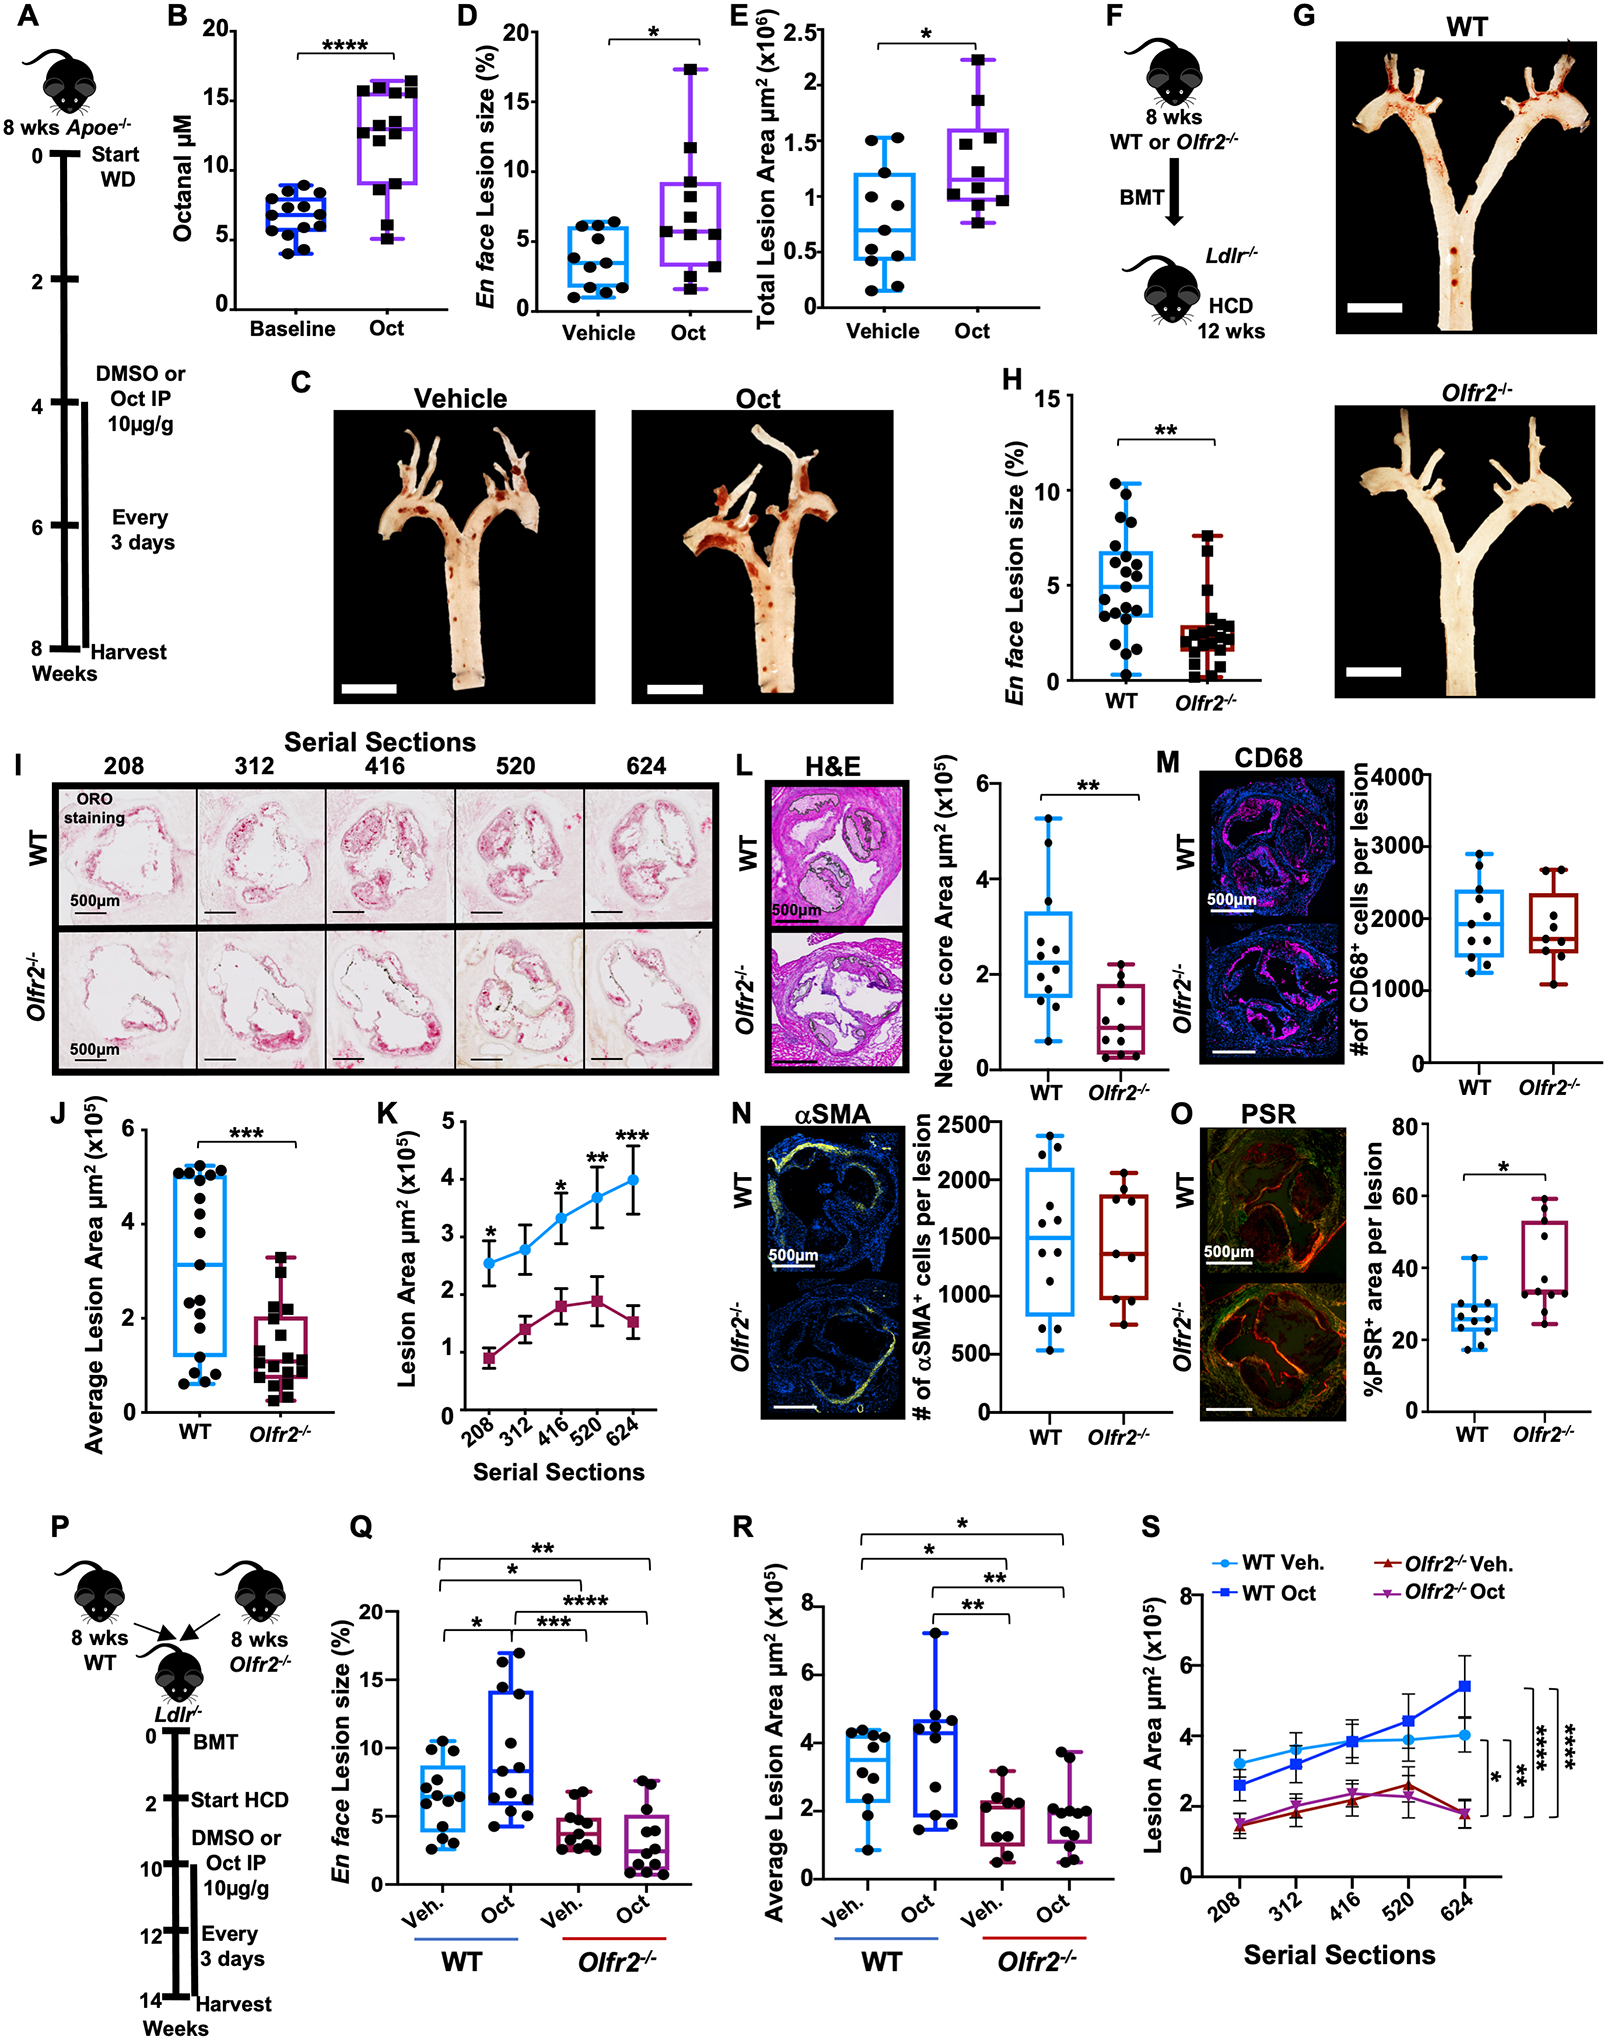
Atherosclerosis is an inflammatory disease of the artery walls and involves immune cells such as macrophages. Olfactory receptors (OLFRs) are G protein–coupled chemoreceptors that have a central role in detecting odorants and the sense of smell. We found that mouse vascular macrophages express the olfactory receptor Olfr2 and all associated trafficking and signaling molecules. Olfr2 detects the compound octanal, which activates the NLR family pyrin domain containing 3 (NLRP3) inflammasome and induces interleukin-1β secretion in human and mouse macrophages. We found that human and mouse blood plasma contains octanal, a product of lipid peroxidation, at concentrations sufficient to activate Olfr2 and the human ortholog olfactory receptor 6A2 (OR6A2). Boosting octanal levels exacerbated atherosclerosis, whereas genetic targeting of Olfr2 in mice significantly reduced atherosclerotic plaques. Our findings suggest that inhibiting OR6A2 may provide a promising strategy to prevent and treat atherosclerosis.


Figures

Fig. 1.
Fig. 1.. Olfactory receptor 2 (Olfr2) is expressed in vascular macrophages (Mφ), bone marrow–derived macrophages (BMDMs), and human aortic macrophages.
(A) Apoe−/− mice were fed a Western diet (WD) for 2 weeks. Confocal fluorescence micrographs are shown, depicting Olfr2 (green), CD68 (macrophage marker, magenta) immuno-reactivity, and Hoechst (blue) nuclear staining in whole-mount aorta. Olfr2+ CD68+ cells indicated with yellow arrows, Olfr2+ CD68 cells indicated with red arrows. Scale bars, 20 μm. (B) Olfr2GFP (green), CD68 (magenta), and Hoechst (blue) in whole-mount aorta from Olfr2GFP and WT mice. Scale bars, 5 μm. (C) OR6A2 expression measured by Affymetrix gene array (BiKE database, GSE21545) expressed as RMA (robust multi-array average; log scale) as a function of macrophage content ratio (low, <0.4, and high, >0.6; 50 subjects total) as determined by Cibersort. (D) Plaque composition extracted with Cibersort for representative OR6A2low (left) and OR6A2high (right) endarterectomy plaques. NKs, natural killer cells. (E) Human aorta from a surgical specimen, fixed and cut into transversal blocks. (Right column) Sections were stained for OR6A2 (AF647, green), CD68 (AF568, magenta), and nuclei (Hoechst, blue). (Left column) Control (no primary) for OR6A2 staining. 40× oil objective; scale bars, 5 μm. (F and G) Whole aortas were dissected from Apoe−/− mice fed a WD for 2 weeks or left untreated (vehicle control). Aortas were incubated with octanal (Oct, 10 μM), LPS (500 ng/ml), or both for 12 hours. (F) Aortic Olfr2 mRNA normalized to Gapdh, 2−ΔΔCT method. (G) Flow cytometry of Olfr2 expression in CD45+ live TCRβ CD19 F4/80+ vascular Mφ, median fluorescence intensity (MFI), isotype control-subtracted (n = 5 mice per group). (H and I) BMDMs from Apoe−/− mice were left untreated (vehicle), incubated with octanal (Oct, 10 μM), LPS (500 ng/ml), or both for 12 hours. (H) Olfr2 mRNA normalized to Gapdh. (I) Flow cytometry of Olfr2 cell surface expression on live F4/80+ BMDMs. (J) Confocal microscopy of BMDMs visualizing Olfr2 expression (AF488, green); treatments as indicated above photomicrographs. Scale bars, 20 μm. (K) Aortic roots of chimeric WT Ldlr−/−and Olfr2−/− Ldlr−/− mice stained for Olfr2 (AF555, green), CD68 (AF647, magenta), and Hoechst (blue). Scale bars, 250 μm. High magnification in red boxes (60× oil objective; scale bars, 10 μm). Data are presented as mean ± SEM. *P < 0.05, **P < 0.01, ***P < 0.001, ****P <0.0001. P calculated by one-way analysis of variance (ANOVA) test, Tukey’s multiple comparisons test for (F) to (I), or unpaired t test with Welch correction for (C).
Fig. 2.
Fig. 2.. Olfr2 ligation induces cAMP, Ca2+ flux, ROS, inflammasome activation, and IL-1 secretion in macrophages.
(A) cAMP in BMDMs from WT and Adcy3+/− mice assessed by cAMP glow assay. (B) Ca2+ flux in BMDMs from WT, Olfr2−/−, and Adcy3+/− mice or WT pretreated for 1 hour with l-cis-diltiazem (LCD, 100 μM). All cells were loaded with 2 μM Fluo-4, pretreated with LPS (100 ng/ml) for 1 hour, and then treated with octanal (10 μM) at “start injection.” Fluo-4 MFI averaged over 25-s intervals. Three biological replicates for each time point. (C and D) BMDMs from WT or Olfr2−/− mice were primed with LPS for 4 hours, treated with octanal (10 μM) for 8 hours, and then incubated with (C) 5 μM MitoSox for 30 min at 37°C or (D) 10 μM dihydrorhodamine 123 (DHR123) for 50 min at 37°C. ROS expressed as percent of response to LPS only. (E) BMDMs from WT mice treated with LPS (50 ng/ml) for 4 hours followed by octanal (Oct) or octanal and citral (Oct+Cit) for 8 hours. (F to H) BMDMs from WT, Olfr2−/−, and Nlrp3−/− mice treated with LPS (50 ng/ml) for 4 hours followed by octanal (Oct) for 8 hours. (F) IL-1β and (G) IL-1α protein in the supernatant by cytokine bead array. (H) Cytotoxicity by LDH release. (I) IL-1β secretion by BMDMs from WT mice, with or without pretreatment with 100 μM LCD for 1 hour, or Adcy3+/− mice. (J and K) Ca2+ in vascular macrophages. Freshly prepared mouse aortic cell suspensions were loaded with 2 μM Fluo-4, gated for CD45+ live dump channel–negative (TCRb, CD19) F4/80+ and analyzed by flow cytometry. Aortic macrophages were stimulated with LPS (100 ng/ml) for 1 hour (J) or not (K) and then treated with octanal (Oct, 10 μM), citral (Cit, 100 μM), neither (control, Ctrl), or both (Oct+Cit). (I) Mouse aortic cell suspensions from WT or Olfr2−/−, LPS prestimulated for 1 hour and treated with octanal (Oct, 10 μM) at 60 s after the start of acquisition. Fluo-4 MFI; SD calculated for 20 to 50 cells at each time point. (L) Whole aortas were untreated (vehicle) or incubated with octanal (10 μM), LPS (500 ng/ml), or both for 12 hours (n = 5 or 6 mice per group). IL-1β protein in supernatants of stimulated aortas by cytokine bead array. (M) hMDMs were loaded with 2 μM Fluo-4, pretreated with LPS for 1 hour, and then treated with octanal (10 μM) alone or combined with citral (100 μM, Cit) at “start injection.” Fluo-4 MFI averaged over 25-s intervals. Three biological replicates for each time point. (N) IL-1β and (O) IL-1α protein in supernatants of hMDM treated with LPS (50 ng/ml) for 4 hours, left untreated, or further treated, as indicated. (P and Q) hMDMs were transfected with OR6A2 siRNA or scrambled control siRNAs (SiCtrl) and treated with LPS+Oct for 12 hours. (P) OR6A2 mRNA normalized to GAPDH. (Q) IL-1β protein in silenced or control hMDM treated with LPS (10 ng/ml) for 4 hours and stimulated with octanal for 8 hours. Mean ± SEM. *P < 0.05, **P < 0.01, ***P < 0.001, ****P < 0.0001. P calculated by two-way ANOVA test, Tukey’s multiple comparisons for (A), (F) to (I), and (Q); one-way ANOVA test, Tukey’s multiple comparisons test for (C) to (E), (L), (N), and (O); unpaired t test with Welch correction for (B), (J), (K), (M), and (P).
Fig. 3.
Fig. 3.. Octanal is present in mouse and human plasma and increases with high-fat diet.
(A) Murine and human blood plasma was analyzed for octanal by derivatization and stable isotope dilution liquid chromatography with tandem mass spectrometry. [2H16] octanal was spiked into plasma before the derivatization reaction as internal standard. (B) Male WT C57BL/6J, (C) Apoe−/− and (D) Ldlr−/− mice were fed a chow diet (CD), western diet (WD), or high-cholesterol diet (HCD). Plasma was analyzed for octanal concentrations [n = 9 or 10 mice per group for (B) and (C), and n = 19 or 20 mice for (D)]. (E) Octanal concentration in pellets of CD and WD mouse food (n = 3 pellets). (F) Percentage of 13C8 octanal versus total octanal in blood plasma and feces of mice (n = 5 mice) gavaged with 3 mg 13C18 oleic acid. (G and H) 13C8 octanal detection in aorta harvested from Apoe−/− mice (n = 4 mice) and incubated with or without (baseline) 3 mg/ml 13C8 oleic acid for 12 hours. (G) Extracted chromatograms in positive-ion multiple reaction monitoring (MRM) mode of octanal (left) and 13C8 octanal (right) after reaction with 3-nitrophenylhydrazine with parent to daughter transitions, 264.2→119.1, 272.2→120.2, respectively. (H) 13C8 octanal, percent of total octanal detected in Apoe−/− mouse aortas. (I) Octanal in snap frozen aorta and feces from Apoe−/− mice on a CD (n = 3 mice each). Octanal in plasma (J) and feces (K) of germ-free (GF, n = 14) and conventional C57BL/6J (SPF, n = 14) mice. (L) Human blood plasma analyzed for octanal concentrations (n = 196 human specimens). Correlation of plasma octanal with (M) total cholesterol, (N) non-HDL cholesterol, and (O) triglycerides (TG). P values and correlation coefficients (r) were calculated by Spearman’s rank analysis. Data are presented as mean ± SEM, unless otherwise specified. *P < 0.05, **P < 0.01, ****P < 0.0001. P calculated by unpaired t test with Welch correction.
Fig. 4.
Fig. 4.. Octanal supplementation exacerbates atherosclerosis, whereas genetic targeting of Olfr2 ameliorates atherosclerosis.
(A) Treatment protocol for (B) to (E). (B) Octanal in the plasma before treatment (baseline) and after 4 weeks of octanal treatment (n = 14 mice per group). (C) Pinned aortic arches of vehicle- or octanal-treated mice. Scale bars, 5 mm. (D) En face atherosclerotic lesion size in aortic arches, percent of area (n = 10 or 11 mice per group). (E) Plaque area (square micrometers) in aortic root serial sections from the same mice. (F) Treatment protocol for (G) to (O). Ldlr−/− mice (n = 19 or 20 mice per group) were lethally irradiated and reconstituted with WT or Olfr2−/− bone marrow and fed a HCD for 12 weeks. (G) Pinned aortic arches of chimeric WT Ldlr−/−and Olfr2−/− Ldlr−/− mice. Scale bars, 5 mm. (H) Aortic arch lesion size as percent of analyzed arch area. (I) Aortic root sections starting from the valve plane stained for Oil Red O (ORO), representative out of 100 sections analyzed per group (n = 19 or 20 mice per group; distance from valve plane in micrometers). Plaque area (square micrometers) for (J) total sections and (K) each aortic root section as a function of position (n = 19 or 20 mice per position). Root lesions (G) to (K) (n = 11 or 12 mice per group): (L) Necrotic core area per lesion, H&E. (M) Total number (#) of CD68+ (magenta) macrophages per lesion. (N) Total number of smooth muscle cells per lesion (αSMA+ cells, yellow; Hoechst, blue). (O) Collagen content by picrosirius red (PSR) and circular dichroism. Scale bars, 500 μm. (P) Treatment protocol for (Q) to (S). Ldlr−/− mice (n = 11 to 13 per group) were lethally irradiated and reconstituted with WT or Olfr2−/− bone marrow. Mice were fed a HCD for 8 weeks, injected every 3 days intraperitoneally with octanal (Oct, 10 μg per gram of body weight) or vehicle for the remaining 4 weeks of the study. (Q) Aortic arch lesions en face, percent of analyzed area. (R) Plaque area (square micrometers) quantification for root sections (n = 9 to 12 per group) and (S) each aortic root section as a function of position. Data are presented as mean ± SEM. *P < 0.05, **P < 0.01, ***P < 0.001, ****P < 0.0001. P calculated by two-way ANOVA and Tukey’s multiple comparisons test for (K) and (Q) to (S) [only the comparisons vehicle (Veh.) versus octanal (Oct.) for section 624 are reported; for the full comparison analysis, see fig. S17B] and unpaired t test with Welch correction for (B), (D), (E), (H), (J), and (L) to (O).

Comment in

References

    1. Buck L, Axel R, Cell 65, 175–187 (1991). - PubMed
    1. Rouquier S, Blancher A, Giorgi D, Proc. Natl. Acad. Sci. U.S.A 97, 2870–2874 (2000). - PMC - PubMed
    1. Saito H, Kubota M, Roberts RW, Chi Q, Matsunami H, Cell 119, 679–691 (2004). - PubMed
    1. Li F et al., J. Neurosci 33, 7975–7984 (2013). - PMC - PubMed
    1. Silva Teixeira CS, Cerqueira NM, Silva Ferreira AC, Chem. Senses 41, 105–121 (2016). - PubMed

Publication types

MeSH terms