. 2022 Mar 1;132(5):e147301.
doi: 10.1172/JCI147301.

RECON syndrome is a genome instability disorder caused by mutations in the DNA helicase RECQL1

Affiliations

RECON syndrome is a genome instability disorder caused by mutations in the DNA helicase RECQL1

Bassam Abu-Libdeh et al. J Clin Invest. .

Abstract

Despite being the first homolog of the bacterial RecQ helicase to be identified in humans, the function of RECQL1 remains poorly characterized. Furthermore, unlike other members of the human RECQ family of helicases, mutations in RECQL1 have not been associated with a genetic disease. Here, we identify 2 families with a genome instability disorder that we have named RECON (RECql ONe) syndrome, caused by biallelic mutations in the RECQL gene. The affected individuals had short stature, progeroid facial features, a hypoplastic nose, xeroderma, and skin photosensitivity and were homozygous for the same missense mutation in RECQL1 (p.Ala459Ser), located within its zinc binding domain. Biochemical analysis of the mutant RECQL1 protein revealed that the p.A459S missense mutation compromised its ATPase, helicase, and fork restoration activity, while its capacity to promote single-strand DNA annealing was largely unaffected. At the cellular level, this mutation in RECQL1 gave rise to a defect in the ability to repair DNA damage induced by exposure to topoisomerase poisons and a failure of DNA replication to progress efficiently in the presence of abortive topoisomerase lesions. Taken together, RECQL1 is the fourth member of the RecQ family of helicases to be associated with a human genome instability disorder.

Keywords: Cell Biology; DNA repair; Genetic diseases; Genetic instability; Genetics.


Figures
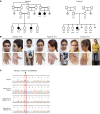
Figure 1
Figure 1. Genealogy of patients with biallelic mutations of RECQL.
(A) Pedigree of the 2 families with identified mutations of RECQL. Patients III-2 and III-4 from family A and patient III-4 from family B are homozygous for the RECQL c.1375G>T (NM_032941.2) mutation. Parents and unaffected siblings from both families were either heterozygous or WT. Where samples were available, the genotypes are shown (G/G, WT; G/T, heterozygote; T/T, homozygote). Patients II-3 and II-4 from family A were reported to have a clinical phenotype similar to that of patients III-2 and III-4. The black arrow indicates probands from whom cell lines were generated: patient III-2 from family A (RECQL1-P1-1) and patient III-4 from family B (RECQL1-P2). The small triangle indicates a pregnancy not carried to term. (B) Photographs of the affected patients from both families showing distinctive facial characteristics and slender, elongated thumbs. (C) Sequencing chromatograms showing the presence of the homozygous c.1375G>T RECQL mutation in cDNA derived from the affected patients III-2 (family A) and III-4 (family B) and that the mother from family A (II-2) is heterozygous for the c.1375G>T RECQL mutation. The WT RECQL sequence across the position of the mutation is shown.
Figure 2
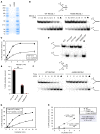
Figure 2. The p.A459S mutation compromises RECQL1 helicase activity.
(A) SDS polyacrylamide gel stained with Coomassie showing recombinant human WT RECQL1 and RECQL1-A459S (500 ng each). mwt, molecular weight. (B) The specified RECQL1 concentrations were tested for unwinding a radiolabeled 19 bp forked duplex DNA substrate (0.5 nM) in 15 minutes. Representative gels are shown. The asterisk indicates a 5′ radiolabel on the 19 bp forked duplex DNA substrate. The black triangle indicates the heat-denatured DNA substrate control used as a marker for duplex unwinding. (C) Quantitation of DNA unwinding from 3 independent experiments, with the SEM shown. AUC: WT (mean ± SEM: 578.3 ± 8.01); A459S (mean ± SEM: 254.3 ± 18.63). WT versus A459S AUC: P < 0.0001, by unpaired t test. (D) Representative gels showing analysis of helicase activity catalyzed by RECQL1 (2.5 nM) on a 19 bp forked DNA substrate in the presence or absence of 5 mM ATP. N.E., no enzyme. (E) Quantitation of DNA unwinding from 3 independent experiments, with the SEM shown. ###P < 0.001, by unpaired t test.(F) Kinetics analyses of unwinding by WT RECQL1 or RECQL1-A459S. Representative gel images show analysis of reaction mixtures containing 1.3 nM WT RECQL1 or RECQL1-A459S helicase incubated with a 19 bp forked duplex DNA substrate for the indicated durations. (G) Quantitation of DNA unwinding from 3 independent experiments, with the SEM shown. (H) Quantitation of DNA unwinding showing a linear trendline and slope of unwinding from 3 independent experiments. The SEM is shown. AUC: WT (mean ± SEM: 830.3 ± 11.35); A459S (mean ± SEM: 316.1 ± 10.3). WT versus A459S AUC: P < 0.0001, by unpaired t test.
Figure 3
Figure 3. The p.A459S mutation compromises the ability of RECQL1 to remodel reversed replication forks but not its ability to catalyze SSA.
(A) Depiction of the reversed and replication fork substrates used in this experiment. The black dot and “X” in the figure represent an isocytosine base and mismatched bases, respectively. These were added to minimize spontaneous conversion of the reversed fork into a replication fork. The asterisk indicates the 5′ end of the oligonucleotide that was radiolabeled with 32P. (B) WT or A459S RECQL1 (20 nM) was incubated with 2 nM radiolabeled reversed fork substrate at 37°C for the indicated durations. A radiolabeled replication fork (2 nM, black triangle) was included as a marker. A representative gel is shown. (C) Quantitation of DNA unwinding from 3 independent experiments, with the SEM shown. AUC: WT (mean ± SEM: 709.5 ± 35.23); A459S (mean ± SEM: 174.4 ± 23.91). WT versus A459S AUC: P < 0.0002, by unpaired t test. (D and E) RECQL1 strand annealing activity was assessed by the formation of a 19 bp forked duplex DNA molecule from 2 partially complementary single-stranded oligonucleotides as a function of increasing RECQL1 concentration. (D) Two partially complementary oligonucleotides (1 radiolabeled at the 5′ end and the other unlabeled; 0.5 nM of each was incubated with the indicated concentrations of RECQL1 for 15 minutes at 37°C in the absence of ATP). A 19 bp forked duplex was loaded as a marker. Representative gel images are shown. (E) Quantitation of strand annealing activity from 3 independent experiments, with the SEM shown.
Figure 4
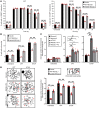
Figure 4. Complementation of RECQL1-P1-1 fibroblasts with WT RECQL1 restores normal repair of DNA damage induced by CPT or ETOP.
(A) Quantification of 53BP1 foci in complemented patient RECQL1-P1-1 fibroblasts before and after treatment with 100 nM CPT (1 h) or 1 μM ETOP (30 min). 53BP1 foci in untreated cells and cells 24 hours after DNA damage induction were quantified in the G1 phase only (mitosin negative) to assess the amount of replication damage induced by CPT or ETOP that had transited into the following cell cycle. 53BP1 foci in cells 1 to 12 hours after DNA damage induction were quantified in the S/G2 phase only (mitosin positive) to monitor the kinetics of repair in damaged S/G2-phase cells. The mean of 3 independent experiments is shown with the SEM. A minimum of 300 cells were counted per time point. ###P < 0.001, by 2-way ANOVA with Tukey’s multiple-comparison test. (B) Micronuclei were quantified from cells described in A, before and 24 hours after exposure to CPT or ETOP. The mean of 3 independent experiments is shown with the SEM. A minimum of 500 cells were counted per time point. ##P < 0.01 and ###P < 0.001, by 2-way ANOVA with Tukey’s multiple-comparison test. (C and D) Quantification of chromosome aberrations in (C) 2 normal LCLs, 2 RECQL-mutant LCLs, and an ATLD LCL and (D) complemented patient RECQL1-P1-1 fibroblasts before and 24 hours after chronic exposure to low-dose CPT (5 nM) or ETOP (50 nM). Chromosome aberrations include chromatid/chromosome gaps and breaks, chromatid/chromosome fragments, and chromosome radials and exchanges. Representative images of each type of aberration are shown. Data show the mean ± SEM of 3 independent experiments. A minimum of 50 metaphases were counted per cell line in each experiment. #P < 0.05, ##P < 0.01, and ###P < 0.001, by 2-way ANOVA with Tukey’s multiple-comparison test (C and D).
Figure 5
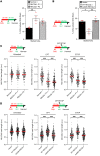
Figure 5. Cells from a patient with RECON syndrome display a reduced efficiency of replication in the presence of TOP1/2 inhibitors.
(A) LCLs and (B) complemented RECQL1-P1-1 patient fibroblasts were sequentially labeled with CldU (red) and IdU (green) as shown. Stalled forks (red-only tracks) were quantified. The mean of 4 independent experiments is shown. A minimum of 200 forks were counted per condition. #P < 0.05 and ##P < 0.01, by 1-way ANOVA with Tukey’s multiple-comparison test. (C) LCLs and (D) complemented fibroblasts were sequentially labeled with CldU and IdU (with or without 50 nM CPT or ETOP) as shown. The length of the CldU and IdU tracks of dual-labeled DNA fibers (>150 per condition) was measured, and the ratio of IdU/CldU track length was calculated, which represents the efficiency of replication in the presence or absence of CPT or ETOP. The median of 3 independent experiments is shown (red line). ###P < 0.001, by Kruskal-Wallis test with Dunn’s multiple comparison.
Figure 6
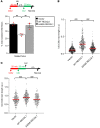
Figure 6. Cells from a patient with RECON syndrome exhibit reduced replication fork restart and increased replication fork degradation following exposure to HU.
(A). Complemented RECQL1-P1-1 patient fibroblasts were labeled with CldU and IdU following exposure to 2 mM HU as shown. Stalled forks were quantified. The mean of 3 independent experiments is shown. A minimum of 200 forks were counted per condition. ##P < 0.001, by 1-way ANOVA with Tukey’s multiple-comparison test. (B) Cells from A were labeled with CldU and IdU as shown in A. The IdU/CldU ratio was calculated for a minimum of 100 forks per condition from 3 independent repeats. The IdU/CldU ratio represents the efficiency of replication in the absence HU and the efficiency of replication fork restart following removal of HU. (C) Cells from A were labeled with CldU and IdU and then exposed to 4 mM HU as shown. The IdU/CldU ratio was calculated for a minimum of 100 forks per condition from 3 independent experiments. An IdU/CldU ratio of less than 1 indicates replication fork degradation. ###P < 0.0001, by Kruskal-Wallis test with Dunn’s multiple comparison (B and C).
Figure 7
Figure 7. Structural modeling of the RECQL1 p.A459S mutation.
(A) Overall structure of the RECQL1 monomer shown in a ribbons illustration, with the individual domains colored according to Supplemental Figure 1A. The gray sphere represents the Zn2+ ion within the ZBD, and the ADP is shown as sticks. (B) A459 forms part of an extended hydrophobic cluster involving W466 and M458 from the ZBD, M395 and Y359 from the helicase-C domain, and F281 from the helicase linker (cyan). (C) Two conformations of F281 within the helicase linker observed in the ADP-bound structure suggest a molecular basis for the dynamic coupling of structural perturbations in the ZBD to ATPase/helicase activity. The P-loop is highlighted in light pink. Conformation “b” of F281 stacks against the P144 pyrrolidine ring, while conformation “a” packs against A459. The figure was produced using PyMOL (https://pymol.org/2/) and coordinates from PDB accessions 2V1X and 2WWY (37, 47).

References

    1. Chu WK, Hickson ID. RecQ helicases: multifunctional genome caretakers. Nat Rev Cancer. 2009;9(9):644–654. doi: 10.1038/nrc2682. - DOI - PubMed
    1. Croteau DL, et al. Human RecQ helicases in DNA repair, recombination, and replication. Annu Rev Biochem. 2014;83:519–552. doi: 10.1146/annurev-biochem-060713-035428. - DOI - PMC - PubMed
    1. Oshima J, et al. Werner syndrome: clinical features, pathogenesis and potential therapeutic interventions. Ageing Res Rev. 2017;33:105–114. doi: 10.1016/j.arr.2016.03.002. - DOI - PMC - PubMed
    1. Cunniff C, et al. Bloom’s syndrome: clinical spectrum, molecular pathogenesis, and cancer predisposition. Mol Syndromol. 2017;8(1):4–23. doi: 10.1159/000452082. - DOI - PMC - PubMed
    1. Chan KL, Hickson ID. New insights into the formation and resolution of ultra-fine anaphase bridges. Semin Cell Dev Biol. 2011;22(8):906–912. doi: 10.1016/j.semcdb.2011.07.001. - DOI - PubMed

Publication types