. 2022 May 24;145(4):1338-1353.
doi: 10.1093/brain/awac010.

Post-stroke outcomes predicted from multivariate lesion-behaviour and lesion network mapping

Affiliations

Post-stroke outcomes predicted from multivariate lesion-behaviour and lesion network mapping

Mark Bowren et al. Brain. .

Abstract

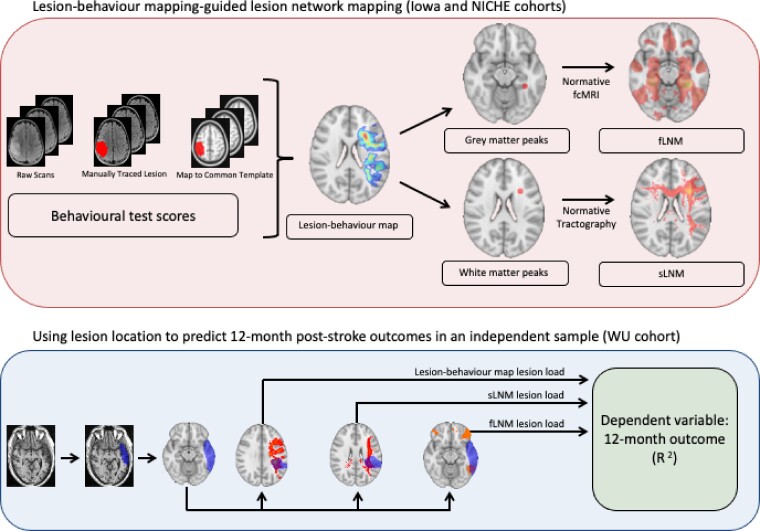
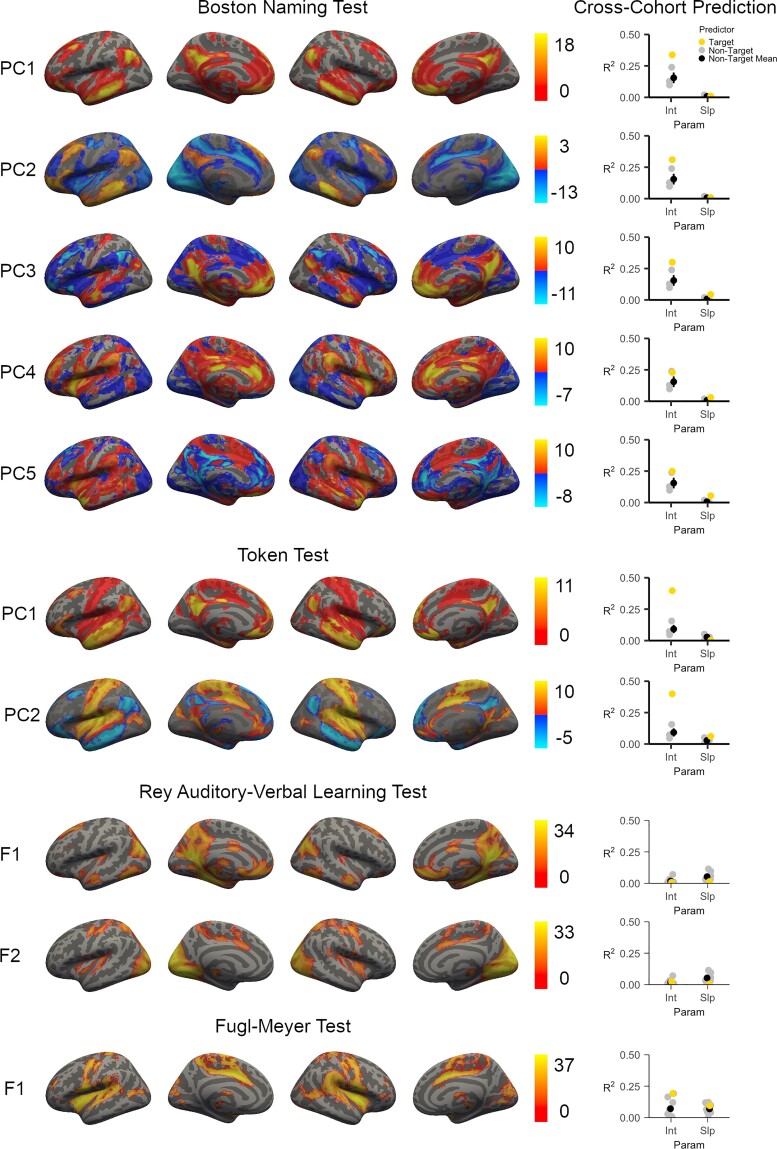
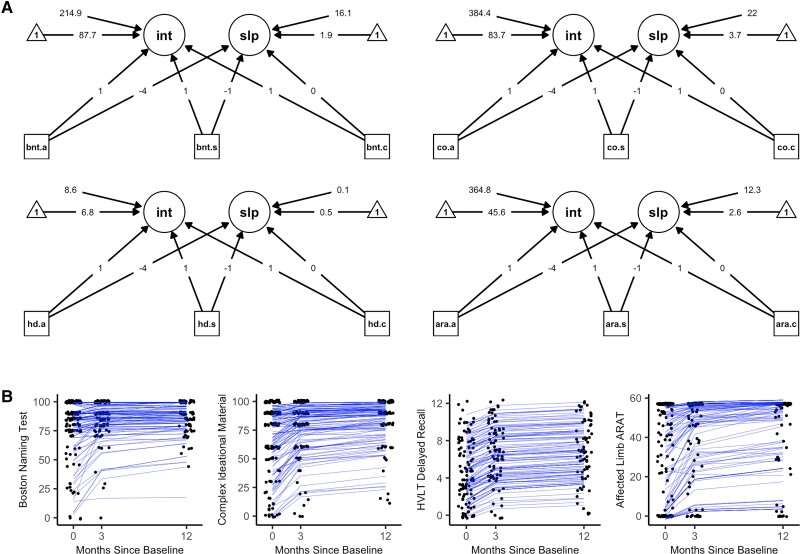
Clinicians and scientists alike have long sought to predict the course and severity of chronic post-stroke cognitive and motor outcomes, as the ability to do so would inform treatment and rehabilitation strategies. However, it remains difficult to make accurate predictions about chronic post-stroke outcomes due, in large part, to high inter-individual variability in recovery and a reliance on clinical heuristics rather than empirical methods. The neuroanatomical location of a stroke is a key variable associated with long-term outcomes, and because lesion location can be derived from routinely collected clinical neuroimaging data there is an opportunity to use this information to make empirically based predictions about post-stroke deficits. For example, lesion location can be compared to statistically weighted multivariate lesion-behaviour maps of neuroanatomical regions that, when damaged, are associated with specific deficits based on aggregated outcome data from large cohorts. Here, our goal was to evaluate whether we can leverage lesion-behaviour maps based on data from two large cohorts of individuals with focal brain lesions to make predictions of 12-month cognitive and motor outcomes in an independent sample of stroke patients. Further, we evaluated whether we could augment these predictions by estimating the structural and functional networks disrupted in association with each lesion-behaviour map through the use of structural and functional lesion network mapping, which use normative structural and functional connectivity data from neurologically healthy individuals to elucidate lesion-associated networks. We derived these brain network maps using the anatomical regions with the strongest association with impairment for each cognitive and motor outcome based on lesion-behaviour map results. These peak regional findings became the 'seeds' to generate networks, an approach that offers potentially greater precision compared to previously used single-lesion approaches. Next, in an independent sample, we quantified the overlap of each lesion location with the lesion-behaviour maps and structural and functional lesion network mapping and evaluated how much variance each could explain in 12-month behavioural outcomes using a latent growth curve statistical model. We found that each lesion-deficit mapping modality was able to predict a statistically significant amount of variance in cognitive and motor outcomes. Both structural and functional lesion network maps were able to predict variance in 12-month outcomes beyond lesion-behaviour mapping. Functional lesion network mapping performed best for the prediction of language deficits, and structural lesion network mapping performed best for the prediction of motor deficits. Altogether, these results support the notion that lesion location and lesion network mapping can be combined to improve the prediction of post-stroke deficits at 12-months.

Keywords: brain networks; functional connectivity; lesion network mapping; lesion-behaviour mapping; stroke.


Figures

Figure 1
Figure 1
Schematic of approach. Multivariate LBMs were generated from sparse canonical correlation analysis based on lesion locations (i.e. voxel lesion status) and behavioural measurements. Data from the Iowa and NICHE cohorts were used to generate LBMs for cognitive and motor functions, respectively. These statistically-weighted maps were used to identify seed regions-of-interest for structural and functional lesion network mapping (LNM), which explore the structural and functional brain networks associated with regional peaks in the white and grey matter from each LBM, respectively. Then, for each patient in the WU cohort, we summed the voxel intensities from the LBM and structural and functional LNM results that also appeared in the patient's lesion mask to generate lesion load scores. The 12-month post-stroke outcome for each domain in the WU cohort was predicted from the lesion load scores. We examined the separate and combined effects of these predictors.
Figure 2
Figure 2
LBM results and LBM-LL predictions of recovery trajectories. LBM-LL scores were calculated for each LBM and used to predict the intercept (which represents performance at 12 months post-stroke) of the recovery trajectories of the cognitive and motor functions measured in the WU cohort. Predictions were based on the LBMs of the Boston Naming Test (A), the Token Test (B), the delayed recall of the Rey Auditory-Verbal Learning Test (C), and the Action Research Arm Test (D). For each LBM, the ‘target test’ was the test in the WU cohort that measured the function on which the LBM was based, and the non-target tests were all other tests. For example, the target test for the LBM of the Token Test was the WU cohort's Complex Ideational Material, as both tests measure receptive language abilities. In each panel, we graphically depicted the variance accounted for (i.e. intercept R2 within the model) by the target map to the average variance accounted for across the non-target maps. Error bars for the mean non-target predictions represent the standard error of the mean.
Figure 3
Figure 3
Structural lesion network mapping. White matter seeds were derived from the LBMs and submitted as seed regions-of-interest in a deterministic fiber tractography analysis. Each LBM was associated with three or more seeds. The results were calculated for each seed and then submitted to a PCA. The seeds associated with the map of the Boston Naming Test identified the white matter tracts between the left frontal, parietal, and temporal cortices as critical for expressive language and naming. The seeds associated with the map of the Token Test identified tracts between the left frontal, parietal, and temporal cortices as being critical for receptive language. The seeds associated with the map of the Rey Auditory-Verbal Learning Test Delayed Recall identified tracts within the left inferior temporal cortex and the left frontal lobe as being critical for anterograde verbal memory. The seeds associated with the map of the Fugl-Meyer Test identified tracts descending from the bilateral primary motor cortices as being critical for upper extremity motor function. Colour scales for the principal component maps indicate the corresponding principal component score at each voxel. For each map, we also depict the amount of variance that can be predicted (R2) in the WU cohort's corresponding behavioural test's latent growth curve intercept. We also present the average variance explained in each WU cohort test when predicted from the non-target functional LNM maps (i.e. the principal component structural LNM maps from the other behavioural domains). Error bars represent standard error. ARAT = Action Research Arm Test; BNT = Boston Naming Test; CIM = Complex Ideational Material Test; HVLT = Delayed Recall from the Hopkins Verbal Learning Test; Int = Intercept for the WU Cohort Latent Growth Curve Model; Param = Type of WU Cohort Latent Growth Curve Parameter; Slp = Slope for the WU Cohort Latent Growth Curve Model.
Figure 4
Figure 4
Functional lesion network mapping. Grey matter seeds were derived from the LBMs of each domain and submitted as seed regions-of-interest for lesion network mapping analyses. Results based on the LBM of the Boston Naming Test and the Token Test were reduced using PCA, which describes major axes of variation across the individual functional lesion network maps. Principal component maps are ordered in terms of the amount of variance they captured across the individual functional lesion networks maps (F). Principal components with positive and negative voxels indicate that the distinction between the positive and negative voxels captures a distinction present across the maps. Five principal components were identified for the functional networks linked to performance on the Boston Naming Test, with most results converging on a fronto-parieto-temporal network (PC1). Two principal components were linked to the Token Test, and these seeds also converged primarily on a fronto-parieto-temporal network (PC1). Results based on the delayed recall trial from the Rey Auditory Verbal Learning Test identified only two networks: a lateral occipital-precuneate network, and a network spanning primary and secondary visual cortices. The results based on the Fugl-Meyer Test were linked to a single rolandic-insular-opercular functional network. Colour scales for the PC maps indicate the principal component score at each voxel; otherwise, colour scales represent the Z-value associated with the statistical test of functional connectivity at each voxel. The ability of each map to predict variance (R2) in the corresponding behavioural test’s latent growth curve intercept (Int) for the WU cohort is presented alongside each map. We also present the average variance explained in each corresponding WU cohort test when predicted from the non-target functional LNM maps (i.e. the functional LNM maps and/or PC functional LNM maps from the other behavioural domains). Error bars represent standard error. Int = Intercept for the WU Cohort Latent Growth Curve Model; Param = Type of WU Cohort Latent Growth Curve Parameter; Slp = Slope for the WU Cohort Latent Growth Curve Model.
Figure 5
Figure 5
Latent growth curve models. (A) The path diagrams for the latent growth curve models. (B) A depiction of the individual-level latent growth curves using jittered data-points and blue subject-specific growth curves (i.e. model-based recovery trajectories), each with their own intercept at 12-months post-baseline and their own slope of recovery that vary around the mean of the latent intercept (int) and slope (slp) variables. Missing data due to participant attrition at the 3- and 12-month measurements were imputed using Full Information Maximum Likelihood. Arrow from observed variables (squares) to latent variables (circles) represent loadings specified from the Latent Growth Curve analyses. Loadings onto the slope were determined through comparisons of model fit to the data for linear and quadratic modeled change over time. Loadings onto the intercept were all set to one, as is standard in Latent Growth Curve analyses. Arrows from triangles represent the mean of the latent variables. Arrows from free floating numbers to the latent variables represent the variance of the latent variables. Model fit to the observed data is presented in Supplementary Table 2. .a = Acute Measurement; ara = Action Research Arm Test; bnt = Boston Naming Test; .c = Chronic Measurement; co = Complex Ideational Material Test; hd = Hopkins Verbal Learning Test Delayed Recall Trial; int = Lateng Growth Curve Intercept (12-month time point); .s = Subacute Measurement; slp = Latent Growth Curve Slope.

Comment in

References

    1. Lai S-M, Studenski S, Duncan PW, Perera S. Persisting consequences of stroke measured by the stroke impact scale. Stroke. 2002;33(7):1840–1844. - PubMed
    1. Gottesman RF, Hillis AE. Predictors and assessment of cognitive dysfunction resulting from ischaemic stroke. Lancet Neurol. 2010;9(9):895–905. - PMC - PubMed
    1. Dawes RM, Faust D, Meehl PE. Clinical versus actuarial judgment. Science. 1989;243(4899):1668–1674. - PubMed
    1. Counsell C, Dennis M, McDowall M. Predicting functional outcome in acute stroke: comparison of a simple six variable model with other predictive systems and informal clinical prediction. J Neurol Neurosurg Psychiatry. 2004;75(3):401–405. - PMC - PubMed
    1. Forkel SJ, Thiebaut de Schotten M, Dell’Acqua F, et al. Anatomical predictors of aphasia recovery: a tractography study of bilateral perisylvian language networks. Brain. 2014;137(Pt 7):2027–2039. - PubMed

Publication types