Observational Study
. 2022 Feb 17;185(4):603-613.e15.
doi: 10.1016/j.cell.2021.12.026. Epub 2021 Dec 23.

SARS-CoV-2 mRNA vaccination elicits a robust and persistent T follicular helper cell response in humans

Collaborators, Affiliations
Observational Study

SARS-CoV-2 mRNA vaccination elicits a robust and persistent T follicular helper cell response in humans

Philip A Mudd et al. Cell. .

Abstract

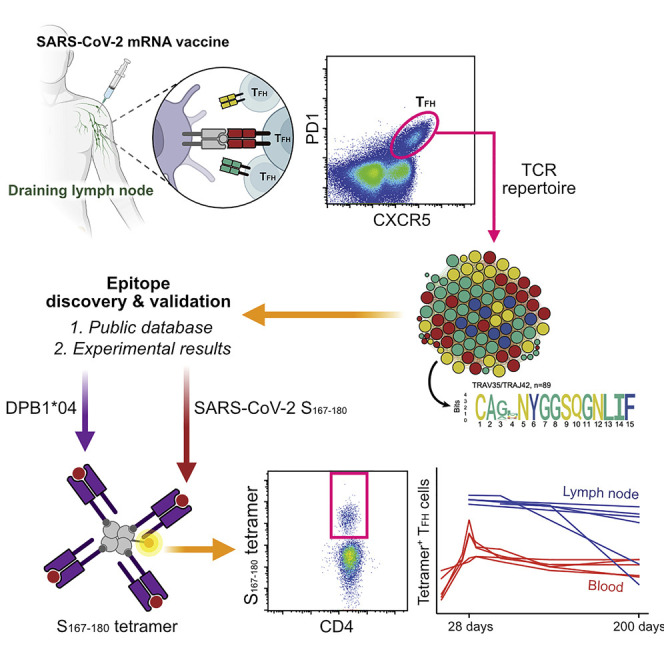
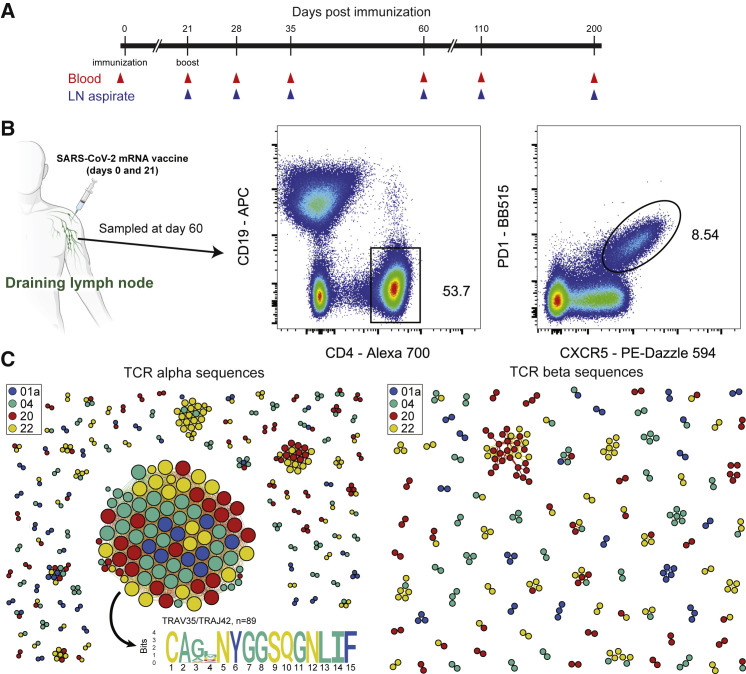
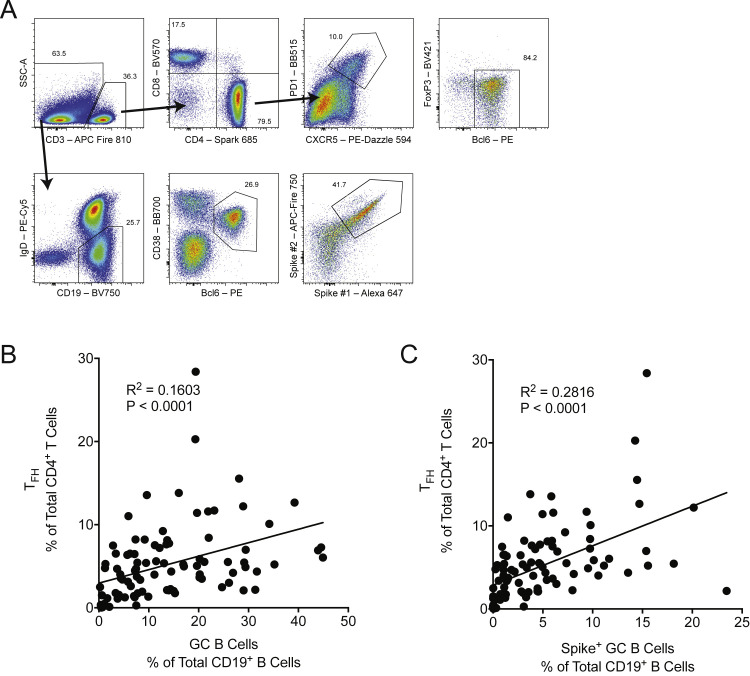
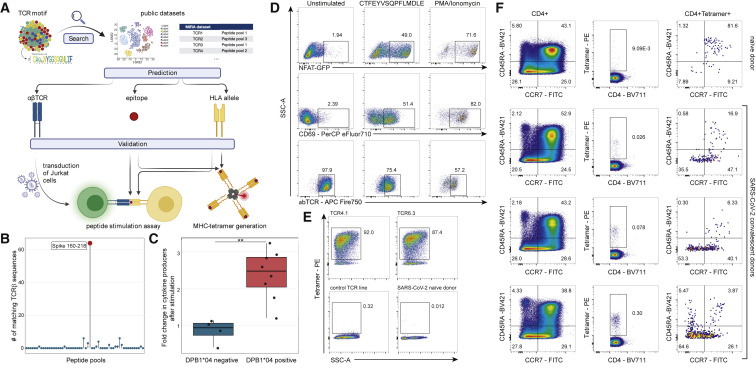
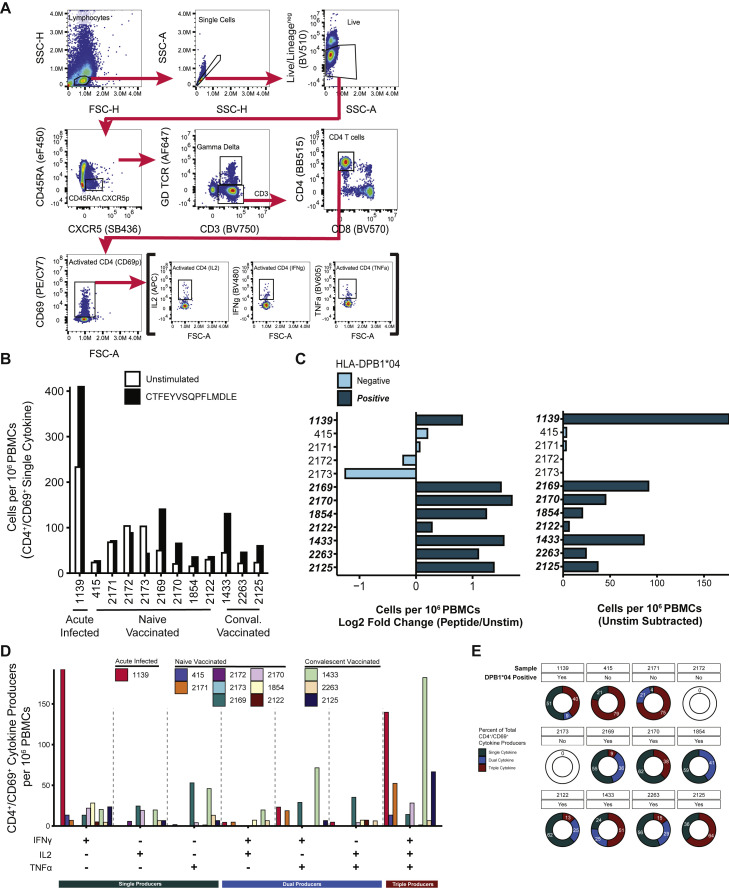
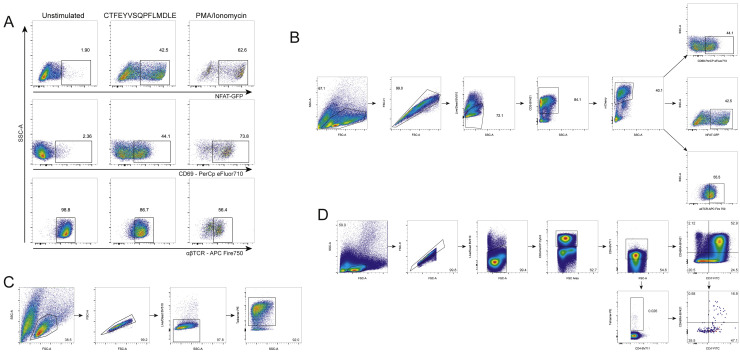
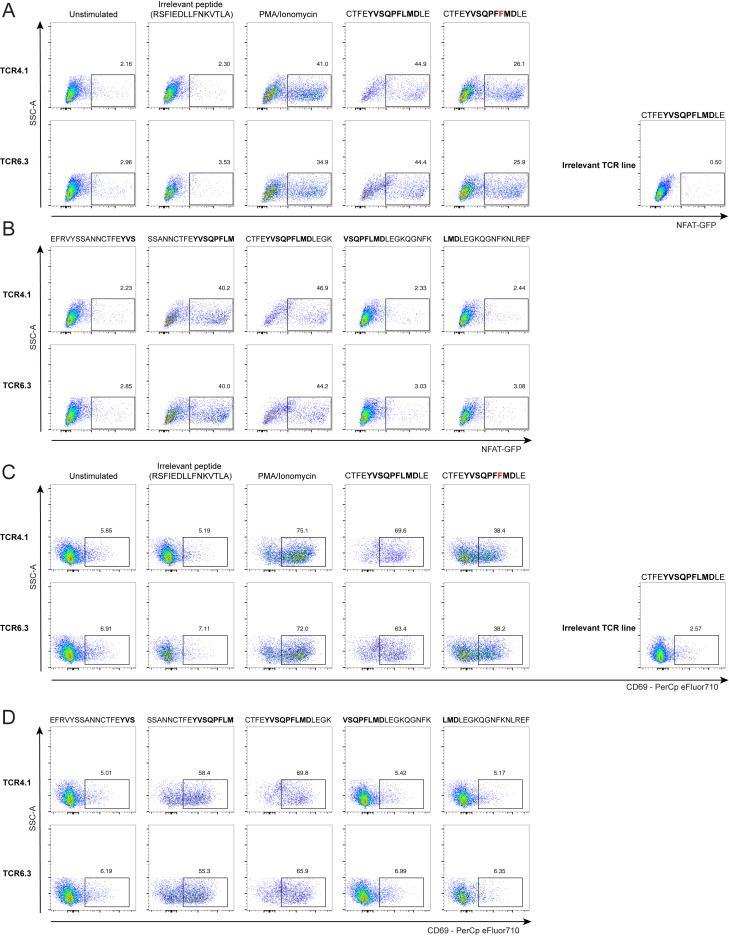
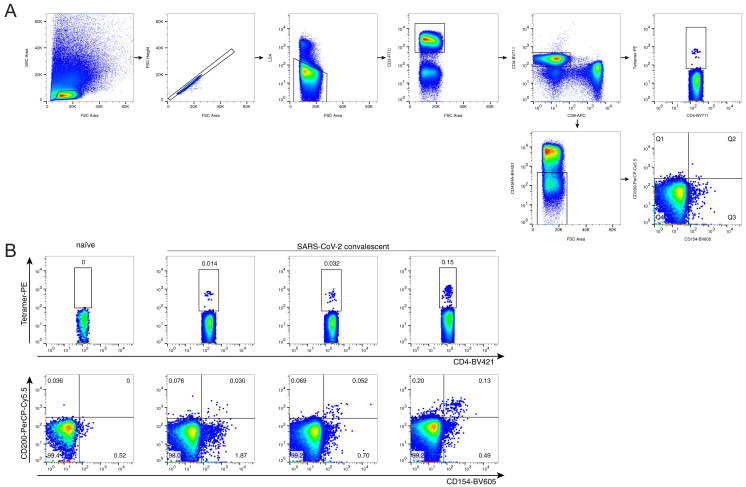
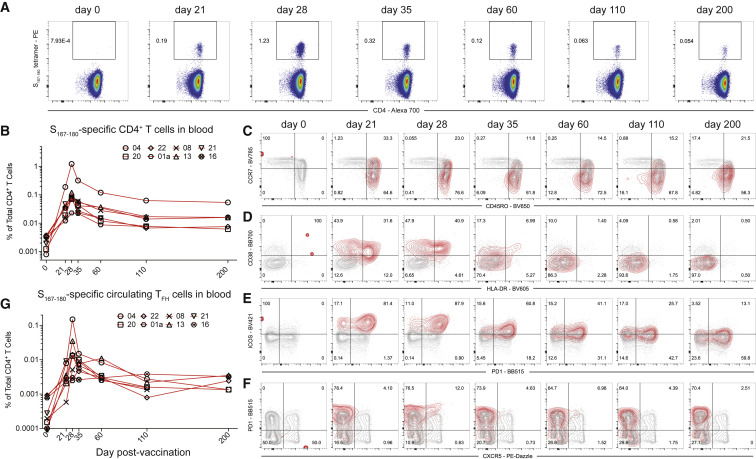
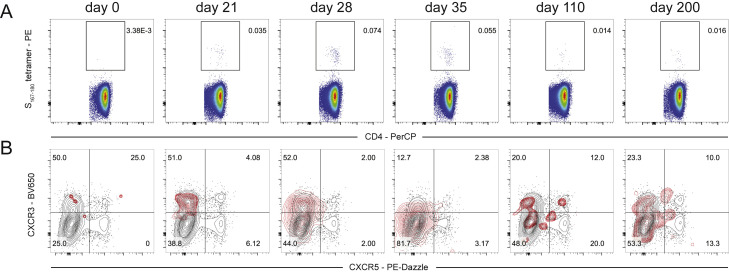
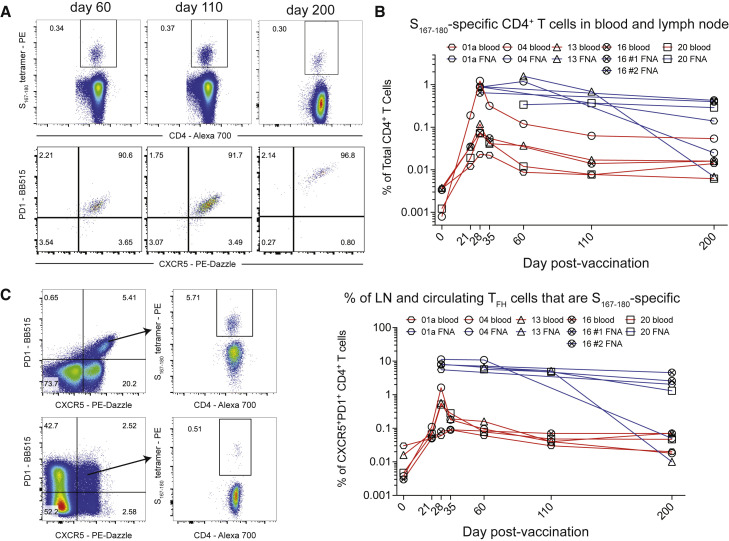
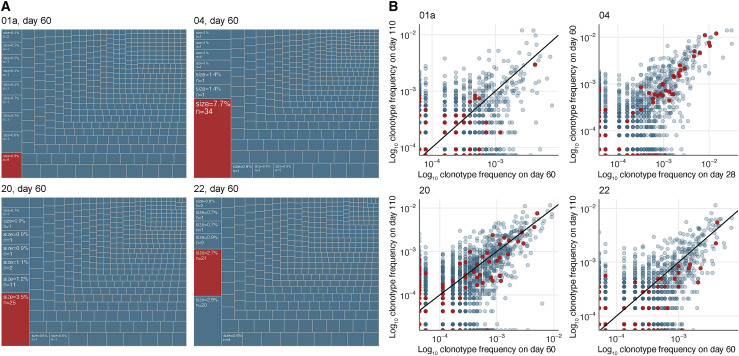
SARS-CoV-2 mRNA vaccines induce robust anti-spike (S) antibody and CD4+ T cell responses. It is not yet clear whether vaccine-induced follicular helper CD4+ T (TFH) cell responses contribute to this outstanding immunogenicity. Using fine-needle aspiration of draining axillary lymph nodes from individuals who received the BNT162b2 mRNA vaccine, we evaluated the T cell receptor sequences and phenotype of lymph node TFH. Mining of the responding TFH T cell receptor repertoire revealed a strikingly immunodominant HLA-DPB104-restricted response to S167-180 in individuals with this allele, which is among the most common HLA alleles in humans. Paired blood and lymph node specimens show that while circulating S-specific TFH cells peak one week after the second immunization, S-specific TFH persist at nearly constant frequencies for at least six months. Collectively, our results underscore the key role that robust TFH cell responses play in establishing long-term immunity by this efficacious human vaccine.

Keywords: CD4(+) T cell; COVID-19; SARS-CoV-2; T follicular helper cell; TCR repertoire; human immunology; lymph node; mRNA vaccination.


Conflict of interest statement

Declaration of interests The Ellebedy laboratory received funding under sponsored research agreements that are unrelated to the data presented in the current study from Emergent BioSolutions and from AbbVie. A.H.E. has received consulting payments from Mubadala Investment Company, InBios International, and Fimbrion Therapeutics and is the founder of ImmuneBio Consulting. P.G.T. has consulted and/or received honoraria and travel support from Illumina, Johnson and Johnson, and 10X Genomics. P.G.T. serves on the Scientific Advisory Board of Immunoscape and Cytoagents. The authors have applied for patents covering some aspects of these studies.

Figures

None
Graphical abstract
Figure 1
Figure 1
T cell receptor sequences from sorted human lymph node TFH cells following mRNA vaccination (A) Study timeline. Day 0 blood samples were obtained prior to the first dose of the vaccine and day 21 samples were taken prior to the second dose of the vaccine. (B) Sorting strategy for TFH cells from LN aspiration samples obtained on day 60. (C) Similarity network of the 500 most abundant TCRα sequences (left) and TCRβ sequences (right) from the lymph node TCR repertoire obtained from sorted TFH cells of 4 individual donors (01a, 04, 20, and 22) 60 days after mRNA vaccination. Each vertex corresponds to an individual TCR clonotype, which are connected to adjacent data points if they have identical VJ-segments and less than 2 mismatches in the CDR3 amino acid sequence. The size of the vertex corresponds to the vertex degree (number of neighbors).
Figure S1
Figure S1
Human lymph node TFH population frequency correlates with the GC B cell population frequency, related to Figure 1; Tables 1 and S1 (A) Gating strategy for the lymph node TFH (CD3+CD4+CXCR5+PD1+Bcl-6+FoxP3-) and GC B cell (CD19+IgDlowBcl-6+CD38int) populations. Spike+ GC B cells are gated on cells that stain positive for two individual SARS-CoV-2 spike-protein probes. (B) The TFH population measured as the frequency of total lymph node CD4+ T cells were compared with the total frequency of lymph node GC B cells using linear regression. (C) Total TFH population frequency compared with the total frequency of spike-specific GC B cells. n = 95 individual lymph node samples obtained from all 15 study subjects between and including study days 21 and 200.
Figure 2
Figure 2
S167–180 epitope discovery and HLA class II tetramer validation (A) Response identification process. The identified TCRα motif of interest was used to query large public scRNA-seq datasets (Bacher et al., 2020; Meckiff et al., 2020) to identify potential partner TCRβ chains and then matched to the large MIRA dataset that used TCRβ sequencing (Nolan et al., 2020) to predict HLA-restriction and cognate epitopes. To validate our prediction, we generated a T cell line expressing the putative αβTCR and we generated HLA class II tetramers. (B) Identification of peptide pool for the motif TCRs using the MIRA dataset. TCRβ chains from paired αβTCRs with CDR3α motif (CA[G/A/V]XNYGGSQGNLIF) were searched in the MIRA dataset allowing for up to one mismatch in CDR3 amino acid sequence. The y axis shows the number of TCRβ chains from Bacher et al. matching to TCRβ from different MIRA SARS-CoV-2 peptide pools. Largest hit (red dot) corresponded to the peptide pool spanning amino acid positions 160–218 from S protein. (C) Average fold change in CD4+/CD69+ T cells (producing IL2, TNFα, or IFNγ) per 106 cells following CTFEYVSQPFLMDLE peptide stimulation of DPB104-positive and -negative SJTRC PBMCs. PBMCs collected during SARS-CoV-2 convalescence or post-vaccination with BNT162b2 were used for intracellular cytokine staining assay. Average fold changes were compared using a Mann-Whitney U test; p = 0.004. Gating strategy is shown in Figure S2. (D) Jurkat cell line expressing the predicted TCR after stimulation with the predicted epitope. Left column: negative control; middle column: TCR4.1 cell line co-cultured with PBMCs from healthy DPB104:01-positive donor pulsed with CTFEYVSQPFLMDLE peptide (S167–180); right column: positive control. Top row: NFAT-GFP reporter expression. Middle row: CD69 surface expression. Bottom row: downregulation of the TCR on cell surface. (E) S167–180 tetramer staining identifies epitope-specific T cells with high specificity. Top row: staining of TCR4.1 and TCR6.3 Jurkat cell lines. Bottom left: staining of Jurkat cell line expressing TCR with other known specificity; bottom right: staining of PBMCs from SARS-CoV-2-naive individual. (F) S167–180 tetramer+ cells have predominantly effector memory phenotype in SARS-CoV-2-convalescent patients. Each row represents an individual donor. Left column: CCR7 and CD45RA distribution in bulk CD3+CD4+ cells. Middle column: S167–180 tetramer staining of CD3+CD4+ cells. Right column: memory/naive phenotypes of CD3+CD4+S167–180 tetramer+ cells. Gating strategies for (D), (E), and (F) are shown in Figure S3.
Figure S2
Figure S2
Intracellular cytokine staining of PBMCs stimulated with S166–180 peptide, related to Figure 2C (A) Gating strategy employed to resolve CD4+/CD69+ T cells producing IL2, TNFα, or IFNγ. Activated CD4+ T cells were defined as live/B cell lineage (CD19+)neg/TFH lineage (CD45RA-/CXCR5+)neg/γδ TCRneg/ CD3+/CD4+/CD69+ and Boolean gated on IL2+, TNFα+, or IFNγ+ single-positive lymphocytes. (B) The number of CD4+/CD69+ T cells producing IL2, TNFα, or IFNγ per 106 PBMCs following CTFEYVSQPFLMDLE peptide (black) or media (white) stimulation. (C) CD4+/CD69+ T cells producing IL2, TNFα, or IFNγ per 106 PBMCs from DPB104:01/02-positive (dark teal bars; bold-italicized Sample ID) and -negative (light blue bars) participants presented as the Log2 fold change of peptide-stimulated over unstimulated (left) and after background subtraction of unstimulated (right). (D) The number of CD4+/CD69+ T cells (unstimulated portion subtracted) producing combinations of IL2, TNFα, and/or IFNγ per 106 PBMCs. (E) Percentage of single, dual, and triple cytokine-producing CD4+/CD69+ T cells among total cytokine-producing CD4+/CD69+ T cells. Values calculated from cells per 106 PBMCs after background (unstimulated) subtraction. Differential Boolean gating on IFNγ, IL2, and TNFα was used to distinguish cytokine-producers; values in (D; color-coded bars at bottom) comprise the percentages in (E).
Figure S3
Figure S3
S167–180 epitope discovery and validation, related to Figure 2 (A) Jurkat cell line expressing the predicted TCR after stimulation with the predicted epitope. Left column: negative control; middle column: TCR6.3 cell line co-cultured with PBMCs from healthy DPB104:01-positive donor pulsed with CTFEYVSQPFLMDLE peptide (S166–180); right column: positive control. Top row: NFAT-GFP reporter expression. Middle row: CD69 surface expression. Bottom row: downregulation of the TCR on cell surface. (B) Gating strategy for (A), Figures 2D and S4. (C) Gating strategy for Figure 2E. (D) Gating strategy for Figure 2F.
Figure S4
Figure S4
Peptide stimulation of Jurkat cell lines expressing the predicted S167–180 specific TCRs, related to Figure 2 (A and B) NFAT-GFP reporter expression. (C and D) CD69 surface expression. Incubation without peptide (unstimulated) and with irrelevant SARS-CoV-2 derived DPB104-restricted peptide (RSFIEDLLFNKVTLA described in Dykema et al. 2021 and Loyal et al. 2021) as well as stimulation of line expressing irrelevant TCR (specific to NQKLIANQF epitope from the spike protein of SARS-CoV-2, described in (Minervina et al., 2021b) with CTFEYVSQPFLMDLE peptide were used as negative controls.
Figure S5
Figure S5
Frequency of S167–180 tetramer+ cells in comparison to the frequency of total spike AIM+ cells, related to Figure 2 (A) Gating strategy. Tetramer-positive cells were gated as cell-sized single live CD3+CD4+tetramer+, AIM+ cells were defined as cell-sized single live CD3+CD4+CD45RA-CD154+CD200+. (B). S167–180 tetramer+ cells (top row) and AIM+ (bottom row) for SARS-CoV-2 naive donor (left column) and SARS-CoV-2 convalescent donors.
Figure 3
Figure 3
S167–180 response in peripheral blood following BNT162b2 vaccination (A) Representative flow cytometry plots of S167–180 tetramer staining following vaccination of subject 04. Frequency displayed is the percent of live CD3+CD4+ T cells in the blood that are tetramer positive. (B) The frequency of S167–180 tetramer+ cells in the blood over time in 8 of the study subjects with available PBMC from most time points. (C–F) Surface phenotype of circulating S167–180 tetramer+ cells over time. Representative flow cytometry overlay plots from subject 04 showing total CD4+ T cell (gray contours) and tetramer-positive (red contours) populations. (C) The majority of S167–180 tetramer+ cells retain an “effector memory” (CD45RO+CCR7-) surface phenotype following vaccination. (D) A subset of S167–180 tetramer+ cells undertake an “activated” surface phenotype (HLA-DR+CD38+) in the 2 weeks following vaccination. (E) ICOS and PD-1 are upregulated on the majority of S167–180 tetramer+ cells prior to and 7 days following boost vaccination. (F) A small subset of S167–180 tetramer+ cells undertake a “circulating TFH” surface phenotype (CXCR5+PD1+) following boost vaccination, but the majority of circulating S167–180 tetramer+ cells do not exhibit this phenotype. (G) S167–180 tetramer+CXCR5+PD1+ cells as a percentage of total live CD3+CD4+ T cells over time.
Figure S6
Figure S6
S167–180-specific CD4+ T cell response in peripheral blood of subject 16 following BNT162b2 vaccination is principally biased toward CXCR3 and not CXCR5 expression, related to Figure 3 (A) S167–180+ CD4+ T cell responses over time in subject #16. (B) CXCR3 and CXCR5 surface expression on tetramer-positive cells (red) and total CD4+ T cells (black) are visualized with overlaid contour plots. Provided frequencies are the frequency of S167–180-tetramer-positive cells in the indicated quadrant.
Figure 4
Figure 4
S167–180 response in the draining lymph node following BNT162b2 vaccination (A) Representative flow cytometry plots of subject 20 demonstrating the frequency of S167–180 tetramer+ cells expressed as a percentage of total CD4+ T cells in the lymph node FNA sample (top row). The bottom row demonstrates CXCR5 and PD1 surface expression on the gated S167–180 tetramer+ cells from the row above. (B) The percentage of total CD4+ T cells that are S167–180 tetramer+ in blood (red lines) and FNA (blue lines) in matched samples taken at the same time points from subjects with available sample. (C) The percentage of CXCR5+PD1+ T cells that are S167–180 tetramer+ over time in both the blood (red lines) and FNA (blue lines).
Figure 5
Figure 5
The S167–180 response composes a large fraction of the TFH repertoire and maintains a consistent frequency over time (A) Abundance of the S167–180-specific clones (red boxes) in the lymph node TFH repertoires of 4 donors on day 60 after mRNA vaccination. Listed frequency is the frequency of the examined clonal group (defined as a cluster from Figure 1B) out of the total clonal sequences in the sorted TFH sample. The S167–180 response is the largest TFH response in 3 of the 4 examined HLA-DPB104+ subjects lymph nodes. (B) Clonotype frequencies of sequenced sorted CXCR5+PD1+ TFH repertoires from lymph nodes sampled at two separate time points. Each dot corresponds to an individual TCRα clonotype. Frequencies are shown in log scale. Red dots correspond to S167–180-specific clones based on the known α-chain motif.

References

    1. Al Kaabi N., Zhang Y., Xia S., Yang Y., Al Qahtani M.M., Abdulrazzaq N., Al Nusair M., Hassany M., Jawad J.S., Abdalla J., et al. Effect of 2 inactivated SARS-CoV-2 vaccines on symptomatic COVID-19 infection in adults: A randomized clinical trial. JAMA. 2021;326:35–45. - PMC - PubMed
    1. Anderson E.J., Rouphael N.G., Widge A.T., Jackson L.A., Roberts P.C., Makhene M., Chappell J.D., Denison M.R., Stevens L.J., Pruijssers A.J., et al. Safety and immunogenicity of SARS-CoV-2 mRNA-1273 vaccine in older adults. N. Engl. J. Med. 2020;383:2427–2438. - PMC - PubMed
    1. Bacher P., Rosati E., Esser D., Martini G.R., Saggau C., Schiminsky E., Dargvainiene J., Schröder I., Wieters I., Khodamoradi Y., et al. Low-avidity CD4+ T cell responses to SARS-CoV-2 in unexposed individuals and humans with severe COVID-19. Immunity. 2020;53:1258–1271. e5. - PMC - PubMed
    1. Baden L.R., El Sahly H.M., Essink B., Kotloff K., Frey S., Novak R., Diemert D., Spector S.A., Rouphael N., Creech C.B., et al. Efficacy and safety of the mRNA-1273 SARS-CoV-2 vaccine. N. Engl. J. Med. 2021;384:403–416. - PMC - PubMed
    1. Bolotin D.A., Poslavsky S., Mitrophanov I., Shugay M., Mamedov I.Z., Putintseva E.V., Chudakov D.M. MiXCR: software for comprehensive adaptive immunity profiling. Nat. Methods. 2015;12:380–381. - PubMed

Publication types

MeSH terms