. 2022 Jan 20;185(2):266-282.e15.
doi: 10.1016/j.cell.2021.12.011. Epub 2022 Jan 12.

Parallel analysis of transcription, integration, and sequence of single HIV-1 proviruses

Affiliations

Parallel analysis of transcription, integration, and sequence of single HIV-1 proviruses

Kevin B Einkauf et al. Cell. .

Abstract

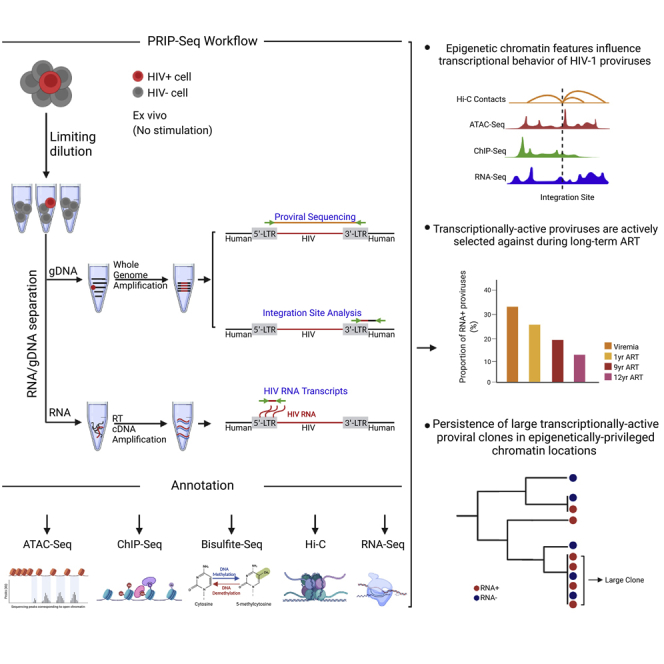
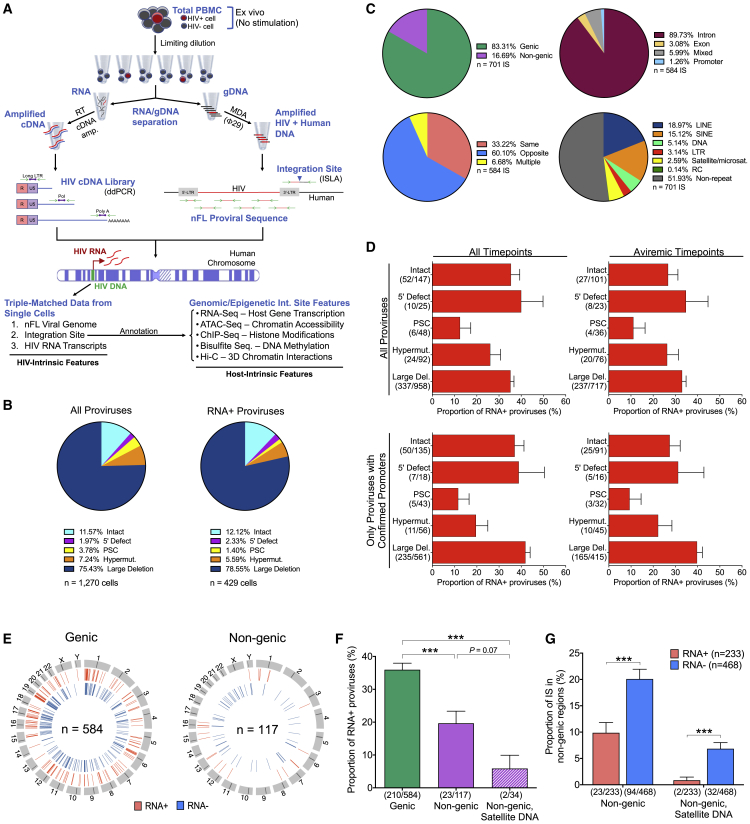
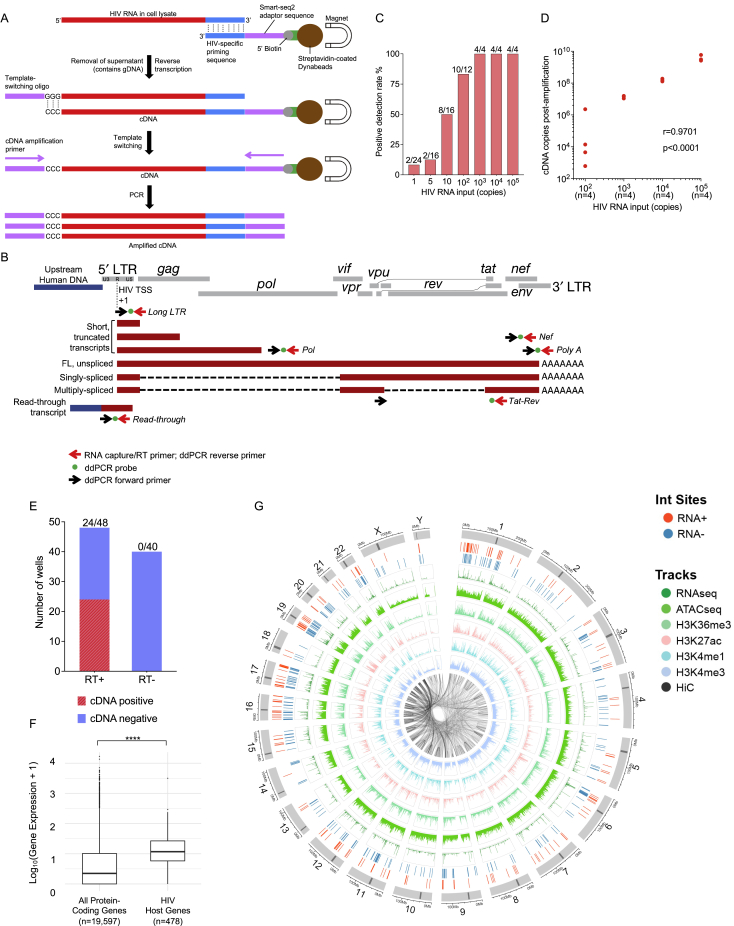
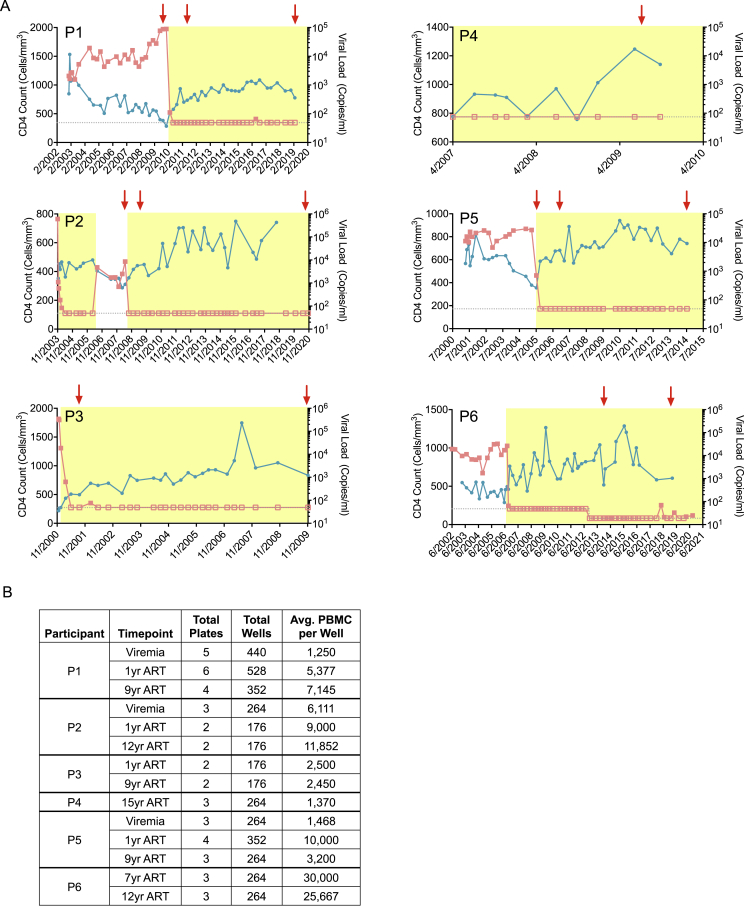
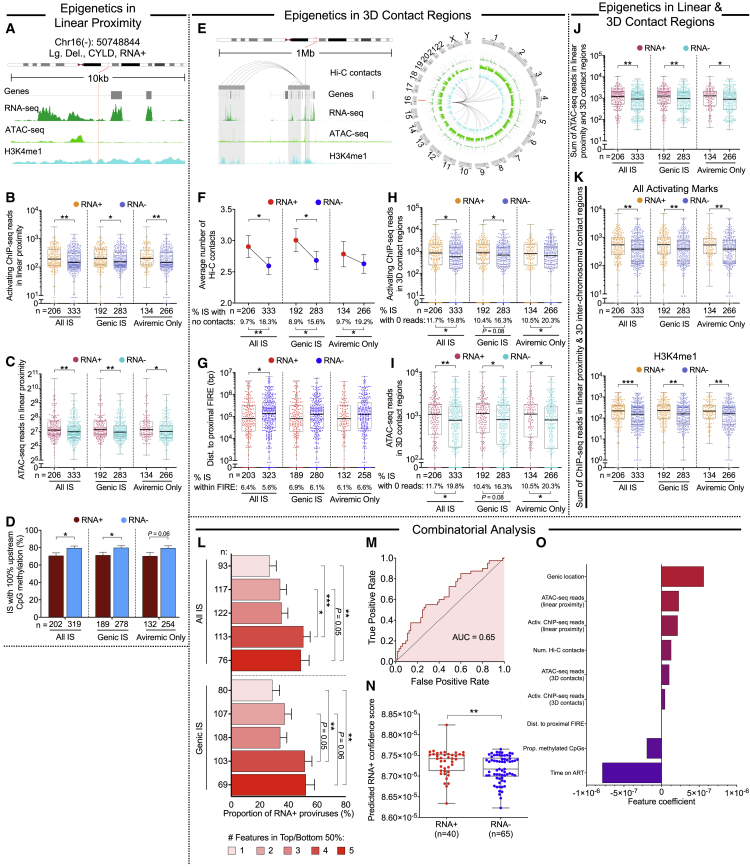
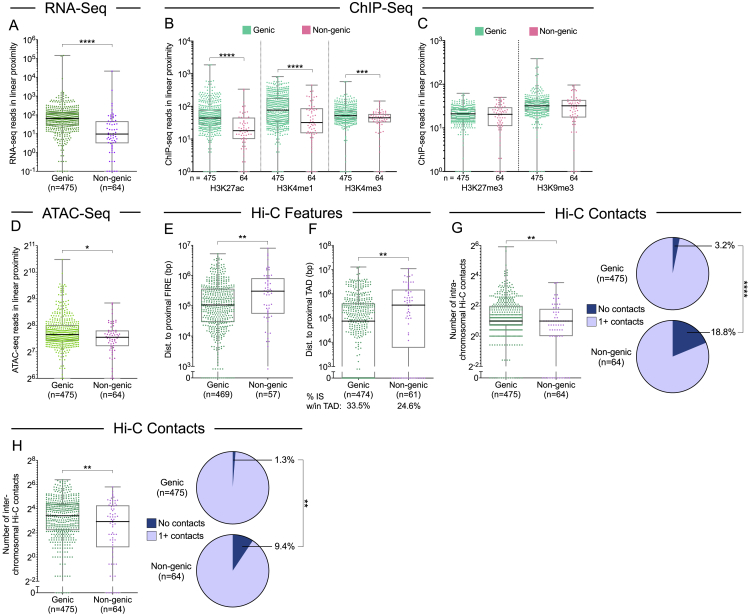
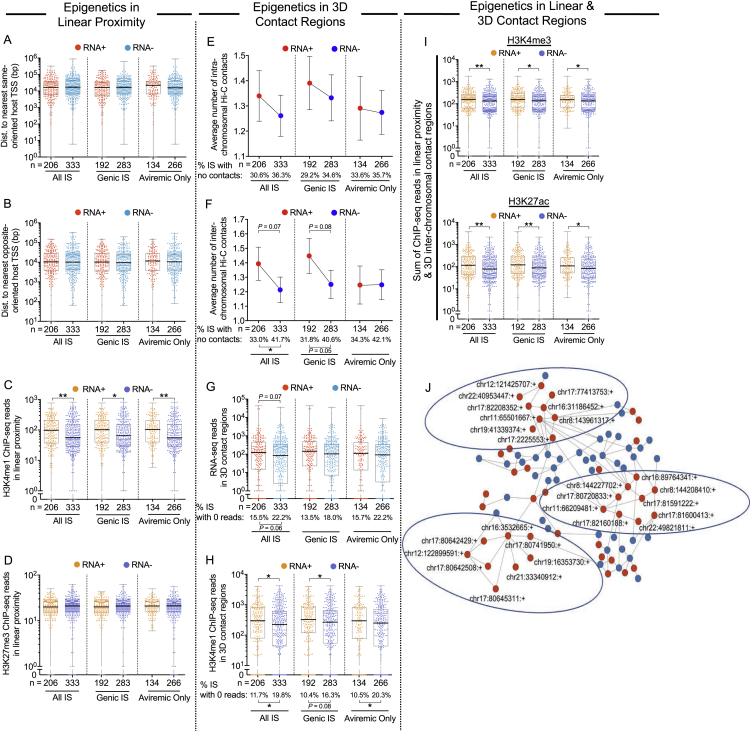
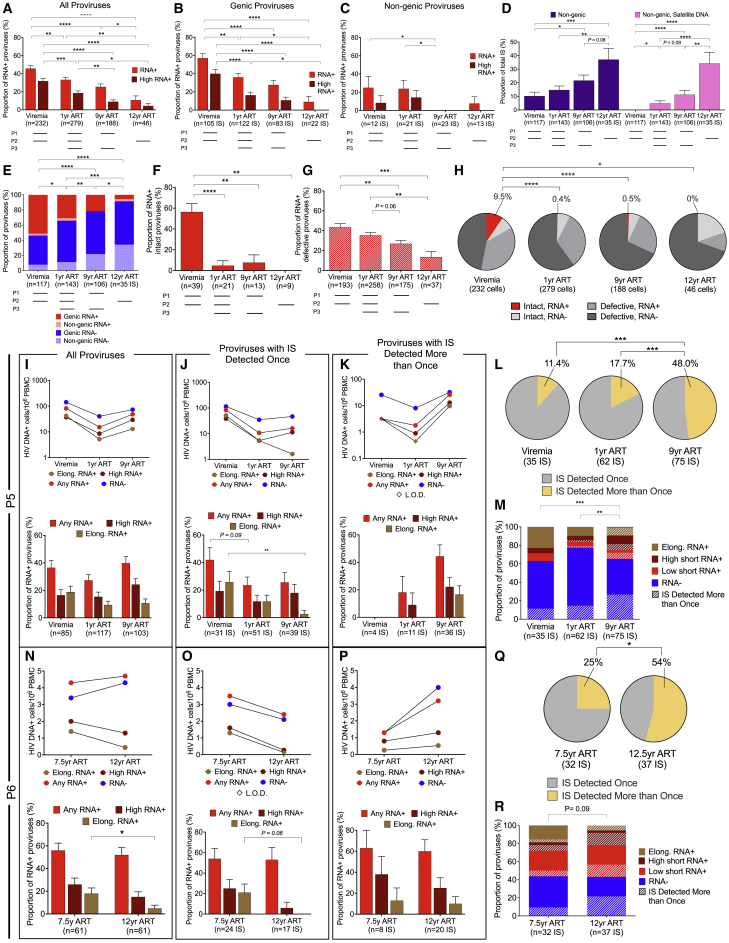
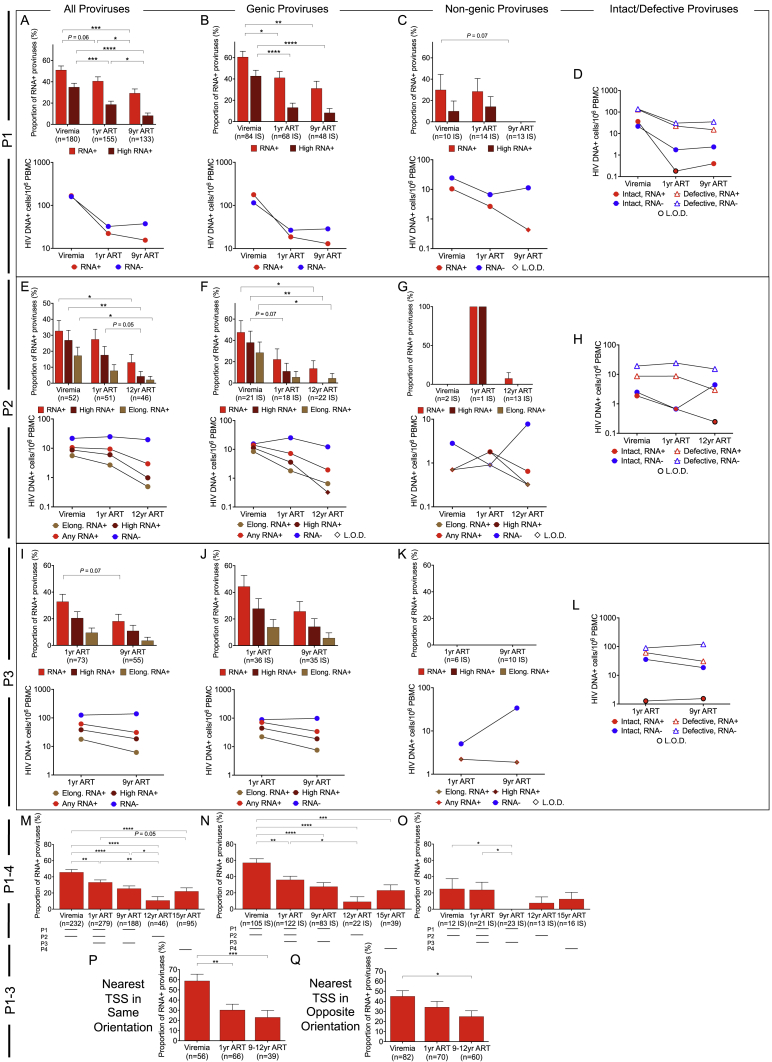
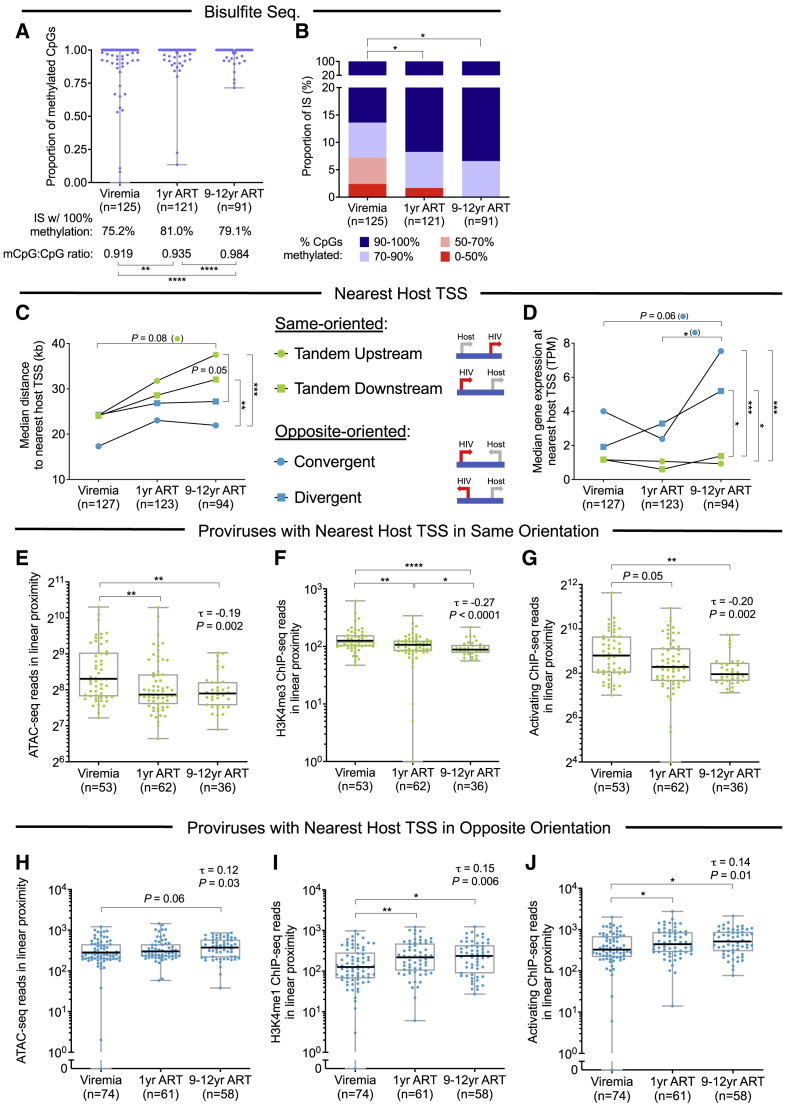
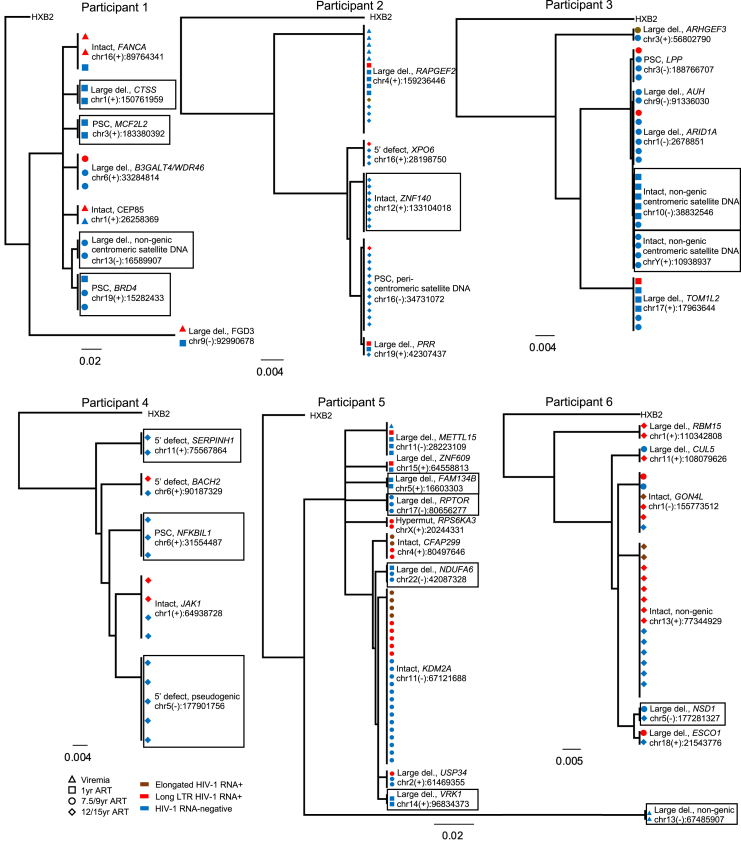
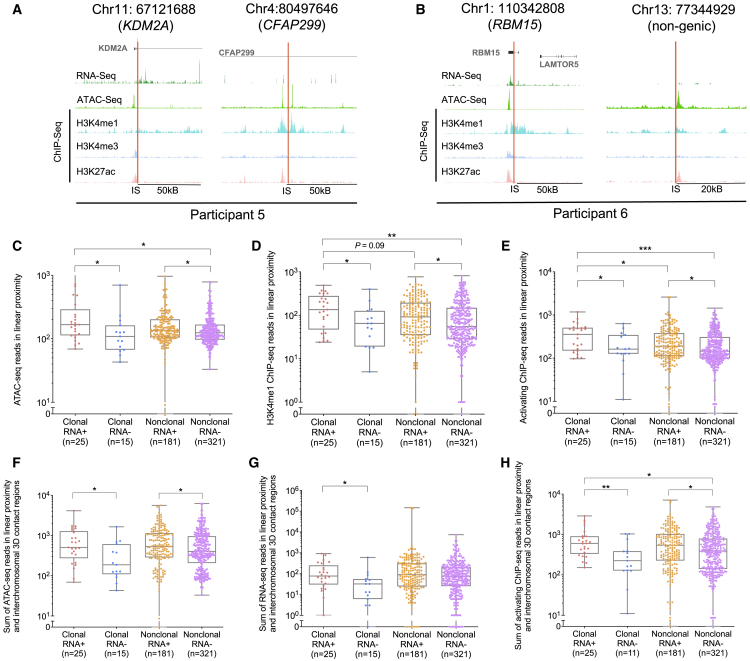
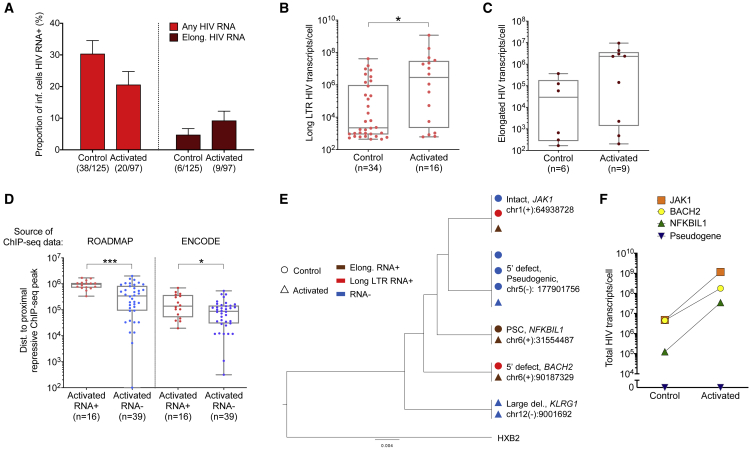
HIV-1-infected cells that persist despite antiretroviral therapy (ART) are frequently considered "transcriptionally silent," but active viral gene expression may occur in some cells, challenging the concept of viral latency. Applying an assay for profiling the transcriptional activity and the chromosomal locations of individual proviruses, we describe a global genomic and epigenetic map of transcriptionally active and silent proviral species and evaluate their longitudinal evolution in persons receiving suppressive ART. Using genome-wide epigenetic reference data, we show that proviral transcriptional activity is associated with activating epigenetic chromatin features in linear proximity of integration sites and in their inter- and intrachromosomal contact regions. Transcriptionally active proviruses were actively selected against during prolonged ART; however, this pattern was violated by large clones of virally infected cells that may outcompete negative selection forces through elevated intrinsic proliferative activity. Our results suggest that transcriptionally active proviruses are dynamically evolving under selection pressure by host factors.

Keywords: HIV RNA transcription; HIV reservoir; antiretroviral treatment; chromosomal integration site; epigenetics; proviruses.


Conflict of interest statement

Declaration of interests The authors declare no competing interests.

Figures

None
Graphical abstract
Figure 1
Figure 1
Simultaneous analysis of HIV-1 DNA sequence, integration site, and transcriptional activity from individual infected cells (A) Schematic representation of the PRIP-seq assay design. (B) Proviral sequence classification in all analyzed HIV-1-infected cells and in long LTR RNA-expressing HIV-1-infected cells (PSC, premature stop codon). (C) Proportions of proviruses in genic versus nongenic positions, introns/exons/promoters (genic sites only), same or opposite orientation to host genes (genic sites only), and repetitive genomic elements. (D) Proportion of HIV-1 long LTR RNA-expressing proviruses among analyzed proviruses, stratified according to proviral sequence intactness/defects. Data are shown separately for all proviruses, all proviruses collected during aviremic time points, and for a subset of proviruses with experimentally confirmed intact core promoter regions. (E) Circos plots reflecting the chromosomal locations of transcriptionally active (RNA+) and silent (RNA−) proviruses in genic versus nongenic DNA. (F) Proportion of transcriptionally active proviruses among proviruses integrated in either genic, nongenic, or nongenic satellite DNA regions. (G) Contribution of proviruses in nongenic or nongenic satellite DNA to the total number of transcriptionally active (RNA+) or silent proviruses (RNA−) with detectable chromosomal IS. (E–G) HIV-1 long LTR RNA-expressing proviruses were considered “RNA+.” (∗∗∗p < 0.001, Fisher’s exact tests were used for all comparisons. Error bars represent standard errors of proportions ).
Figure S1
Figure S1
Technical evaluation of PRIP-seq assay, related to Figure 1 (A and B) Schematic representation of the experimental workflow for isolation, reverse transcription, and amplification of HIV-1 RNA/cDNA (A) and of the primer/probe binding sites for ddPCR-based detection of indicated HIV-1 cDNA products (B). (C and D) Known HIV-1 RNA copy numbers were serially diluted in 96-well plates and added to cell lysates of 10,000 PBMC from an HIV-1-uninfected person; afterward, a standard PRIP-seq assay was performed. (C) Proportion of wells with detectable HIV-1 cDNA at the indicated number of input HIV-1 RNA copies. (D) Correlation between input HIV-1 RNA copy numbers and numbers of postamplification HIV-1 cDNA copies detectable by the PRIP-seq assay; Spearman correlation coefficient is shown. (E) Evaluation of possible HIV-1 cDNA contamination by genomic HIV-1 DNA. PRIP-seq was applied to 48 wells, each containing 12,000 PBMC/well from an HIV-infected participant; 40 separate control wells were subjected to the same protocol, except for exclusion of reverse transcriptase from the workflow. Graph demonstrates number of wells with detectable HIV-1 cDNA in samples and controls. (F) Gene expression intensity (determined by RNA-seq) of all human protein-coding genes compared with host genes harboring proviral IS recovered by PRIP-seq in all study subjects. (∗∗∗∗ p < 0.0001, Mann-Whitney U test). (G) Circos plot indicating positioning of long LTR RNA-expressing proviruses (RNA+) and transcriptionally silent (RNA-) proviruses relative to genome-wide assessments of indicated transcriptional (RNA-seq), epigenetic (ATAC-seq and ChIP-seq) and three-dimensional chromatin contact (Hi-C) features. Data from all analyzed proviruses for which IS were available are shown.
Figure S2
Figure S2
Clinical characteristics of study participants, related to Figure 1 (A) Diagrams reflecting CD4+ T cell counts and HIV-1 plasma viral loads of the six study participants (P1–P6). Sampling time points are indicated by red arrows. ART exposure time is indicated by yellow shading. Horizontal dotted lines indicate limits of detection for viral load assays; empty squares indicate participant viral loads at/below the associated limit of detection. (B) Table summarizing number of cells, wells and plates analyzed by PRIP-seq for each participant at indicated PBMC sampling time points.
Figure 2
Figure 2
Epigenetic features in linear and three-dimensional contact regions of transcriptionally active proviruses (A) Genome browser snapshot of RNA-seq, ATAC-seq, and ChIP-seq reads in proximity of the indicated representative proviral integration site. (B and C) Dot plots showing ChIP-seq reads corresponding to activating histone features (H3K4me1, H3K4me3, and H3K27ac) (B) and ATAC-seq reads (C) in linear proximity (±5 kb) of RNA-positive or -negative proviruses. (D) Proportion of proviruses with 100% methylated cytosine residues within 2,500 bp upstream of the proviral 5′-LTR HIV-1 promoter. Proviruses with 0 CpGs in this region were excluded. (E) Genome browser snapshot and circos plot highlighting intra- and interchromosomal contact regions of the representative provirus indicated in (A). (F–I) Number of total (intra- and interchromosomal) contacts (F), chromosomal distances to FIREs (G), activating histone-specific ChIP-seq reads in 3D contact regions (H), and ATAC-seq reads in 3D contact regions (I) among HIV-1 RNA-positive or -negative proviruses. In (G), proviral sequences without FIRE annotation by FIREcaller (Crowley et al., 2021) were excluded from the analysis. (J) Sum of ATAC-seq reads in linear (±5 kb) and all 3D contact regions. (K) Sum of activating histone-specific (upper panel) and H3K4me1 (lower panel) ChIP-seq reads in linear (±5 kb) and interchromosomal 3D contact regions. (L) Transcriptional activity of proviruses stratified according to multiple integration site features. Proviruses were categorized based on the number of features within the upper 50th percentile for (B, C, and F) and within the lower 50th percentile for (D and G), relative to the indicated data distributions. (M) Receiver operating characteristic (ROC) curve for a logistic regression model trained to predict proviral transcriptional activity as evaluated on a holdout testing dataset. (N) Dot plot displaying model-predicted confidence scores of HIV-1 RNA expression in RNA-positive or -negative proviruses in the test dataset. (O) Coefficients of each feature in the logistic regression model after training. Positive coefficients are associated with proviral transcriptional activity and negative coefficients are associated with proviral transcriptional silence. (B–D and F–O) HIV-1 long LTR RNA-expressing proviruses were considered “RNA+”; clonal proviral sequences are counted once and shown as RNA+ when at least one member of a clonal cluster had detectable HIV-1 long LTR RNA; IS located in chromosomal regions in the ENCODE blacklist (Amemiya et al., 2019) were excluded. (F–K) Hi-C data at binning resolution of 10 kb are shown. (p < 0.05, ∗∗p < 0.01, ∗∗∗p < 0.001, Mann-Whitney U tests or Fisher’s exact tests were used for all comparisons. Error bars in bar diagrams D, F, and L represent SEM or SEP).
Figure S3
Figure S3
Chromatin features of HIV-1 proviruses integrated in non-genic DNA, related to Figures 1 and 2 (A–D) Sum of local RNA-seq reads (A), ChIP-seq reads corresponding to activating (B), inhibitory (C) histone modifications, and ATAC-seq reads (D) within 5 kb upstream or downstream of proviral IS in genic versus nongenic locations. (E and F) Chromosomal distances of proviruses in genic versus nongenic positions to frequently interacting regions (FIREs) (E) and to topologically associated domains (TADs) (F), determined at 10 kb binning resolution of Hi-C data. (G and H) Numbers of intrachromosomal (G) and interchromosomal (H) contact regions, determined by FiTHiC2-seq (Kaul et al., 2020) (p < 0.05, binning resolution of 20 kb), for proviruses in genic versus nongenic locations. Pie charts reflect proportions of proviruses with no detectable intra- or interchromosomal contacts. (A–H) Clones of proviruses are counted as single datapoints; IS located in chromosomal regions in the ENCODE blacklist (Amemiya et al., 2019) were excluded because of the reduced ability to map next-generation sequencing reads onto repetitive genomic DNA regions. (E and F) Proviral sequences without FIRE annotation by FIREcaller (Crowley et al., 2021) or without TAD annotation by Homer (version 4.10.3) were excluded from the respective analyses. (p < 0.05, ∗∗p < 0.01, ∗∗∗p < 0.001, ∗∗∗∗p < 0.0001; Mann-Whitney U tests or Fisher’s exact tests were used for all comparisons).
Figure S4
Figure S4
Additional distinguishing features of transcriptionally active HIV-1 proviruses, related to Figure 2 (A and B) Chromosomal distance between transcriptionally active (RNA+) and transcriptionally silent (RNA-) proviruses and the most proximal host transcriptional start site (TSS) in same (A) or opposite (B) orientation. (C and D) H3K4me1- (C) and H3K27me3-specific (D) ChIP-seq reads in linear proximity (±5 kb) to proviral IS. (E and F) Average numbers of intrachromosomal (E) and interchromosomal (F) proviral chromatin contacts; error bars indicate standard error of the mean. (G and H) RNA-seq reads (G) and H3K4me1-specific ChIP-seq reads (H) in all proviral 3D contact regions. (I) Sum of H3K4me3- (upper panel) and H3K27ac-specific (lower panel) ChIP-seq reads in linear proximity and interchromosomal proviral contact regions. (E–I) 3D contacts were determined by Hi-C at 10 kb binning resolution. (J) Network reflecting chromosomal interactions (p < 0.05, 20 kb binning resolution) between IS of transcriptionally active (red) and silent (blue) proviruses from all six study subjects. Circles suggest transcriptional interactomes between HIV-1 RNA+ proviruses. (A–J) HIV-1 long LTR RNA-expressing proviruses were considered “RNA+”; clonal sequences were counted once and were counted as RNA+ when at least one member of a clonal cluster had detectable expression of HIV-1 long LTR RNA. IS located in chromosomal regions in the ENCODE blacklist (Amemiya et al., 2019) were excluded. (p < 0.05, ∗∗p < 0.01, Mann-Whitney U tests or Fisher’s exact tests were used for all comparisons).
Figure 3
Figure 3
Longitudinal evolution of HIV-1 proviruses (A–C) Relative proportions of proviruses expressing any HIV-1 RNA or high-level (>10,000 postamplification copies) HIV-1 RNA at indicated time points for participants 1–3 (P1–P3). Data for all proviruses (A), proviruses integrated in genic locations (B), and proviruses in nongenic locations (C) are shown; (B) and (C) only include proviruses for which IS are available. (D) Proportion of proviruses integrated in nongenic and nongenic, satellite DNA in a combined longitudinal analysis of participants 1–3. (E) Relative contribution of RNA-positive or -negative proviruses in genic versus nongenic chromosomal locations to the total number of proviruses with known IS in P1–P3. (F and G) Proportions of intact (F) and defective (G) proviruses that were transcriptionally active in P1–P3 at indicated longitudinal time points. (H) Contribution of indicated proviruses to the total number of proviruses in participants 1–3. (A–G) Horizontal dashes indicate available time points from each participant; HIV-1 long LTR RNA-expressing proviruses were considered “RNA+.” (I–K and N–P) Frequencies and proportions of proviruses expressing any HIV-1 RNA, high-level (>10,000 postamplification copies) HIV-1 RNA, elongated HIV-1 RNA (containing pol, nef, spliced tat-rev, or poly-A sequences), or no HIV-1 RNA in study participants 5 (P5, I–K) and 6 (P6, N–P). Data for all proviruses (I and N), for proviruses with IS detected once (J and O), and for proviruses with IS detected more than once (K and P) are shown. (J, K, O, and P) Only include proviruses for which IS are available. (L and Q) Contribution of proviruses with IS detected once or multiple times to the total number of proviruses with known IS in participants 5 (L) and 6 (Q). In (M/R), proviruses are additionally stratified by HIV-1 RNA expression status. (p < 0.05, ∗∗p < 0.01, ∗∗∗p < 0.001, ∗∗∗∗p < 0.0001, Mann-Whitney U tests, Fisher’s exact tests, or G tests were used for all comparisons. Error bars in bar diagrams represent SEP).
Figure S5
Figure S5
Longitudinal changes in frequency of transcriptionally active and silent proviruses, related to Figure 3 (A–C, E–G, and I–K) Proportions and frequencies of proviruses expressing any HIV-1 RNA, high-level (>10,000 postamplification copies) HIV-1 RNA or elongated HIV-1 RNA (containing pol, nef, spliced tat-rev, or poly-A sequences) at indicated time points in participants 1–3 (P1–P3). Data for all proviruses (A, E, and I), proviruses integrated in genic locations (B, F, and J), and proviruses in nongenic locations (C, G, and K) are shown; (B, C, F, G, J, and K) only include proviruses for which IS are available. (D, H, and L) Frequencies of long LTR RNA-positive or -negative intact or defective proviruses at indicated time points in P1–P3. L.O.D., limit of detection. (M–O) Proportion of long LTR RNA-expressing HIV-1 proviruses in study participants 1–4. Data for all proviruses (M), proviruses in genic locations (N), and proviruses in nongenic locations (O) are shown. Horizontal dashes indicate available time points from each participant. (P and Q) Among proviruses detected once and positioned in either same (P) or opposite (Q) orientation to the nearest host TSS, proportion of proviruses expressing HIV-1 long LTR RNA; longitudinal data are pooled from study subjects 1–3 at indicated time points. (p < 0.05, ∗∗p < 0.01, ∗∗∗p < 0.001, ∗∗∗∗p < 0.0001, Fisher’s exact tests were used for all comparisons. Error bars in bar diagrams represent SEP).
Figure 4
Figure 4
Longitudinal evolution of proviral integration site features (A and B) Proportion of methylated CpG (mCpG) residues within 2,500 bp upstream of the HIV-1 5′-LTR promoter for IS. Proportions of IS with 100% upstream CpG methylation and the average ratio of methylated CpGs to total CpGs are also indicated. Proviruses with 0 CpGs within 2,500 bp upstream of the integration site were excluded. (C) Median distance between proviral IS and the most proximal host transcriptional start site (TSS) with indicated orientation to the proviral sequence. (D) Median RNA-seq-derived gene expression intensity at nearest host TSS with indicated directional orientation to proviral sequence. (E–G) Among proviruses in the same directional orientation as the nearest host TSS, plots indicate the longitudinal evolution of ATAC-seq reads (E) and H3K4me3-specific (F) and all activating (H3K4me1, H3K4me3, and H3K27ac) ChIP-seq reads (G) surrounding (±10 kb) proviral IS. (H–J) Among proviruses in opposite orientation to the nearest host TSS, plots indicate the longitudinal evolution of ATAC-seq reads (H), H3K4me1-specific (I), and all activating (H3K4me1, H3K4me3, and H3K27ac) ChIP-seq reads (J) surrounding (±10 kb) proviral IS. (E–J) Kendall’s rank correlation coefficients (τ) and corresponding p values are indicated in the upper right of each plot. (A–J) Longitudinal data from all proviruses in genic regions from study subjects 1, 2, and 5 are included; IS located in chromosomal regions in the ENCODE blacklist (Amemiya et al., 2019) were excluded; clonal IS are counted only once and assigned to the time point contributing the majority of clonal members or to the earliest time point in the case of a tie. (p < 0.05, ∗∗p < 0.01, ∗∗∗p < 0.001, ∗∗∗∗p < 0.0001, Mann-Whitney U tests, Fisher’s exact tests, or G tests were used for all comparisons).
Figure 5
Figure 5
Transcriptional behavior of clonal HIV-1 proviruses Phylogenetic trees of clonal HIV-1 proviruses from the six study participants. Each symbol reflects one single provirus. Proviral sequence calls and host genes harboring IS are indicated. Clones that are transcriptionally silent across all members are boxed. PSC, premature stop codon; large del, large deletion; hypermut, hypermutation.
Figure 6
Figure 6
Epigenetic features of transcriptionally active clonal HIV-1 proviruses (A and B) Genome browser snapshots reflecting the local chromatin environment surrounding the proviral IS of selected transcriptionally active clonal proviruses from study persons 5 (A) and 6 (B). (C–E) ATAC-seq (C), H3K4me1-specific ChIP-seq (D), and all activating (H3K4me1, H3K4me3, and H3K27ac) ChIP-seq (E) reads surrounding (±5 kb) the proviral IS of clonal proviruses and of proviruses detected once (here termed “nonclonal”). (F–H) Sum of ATAC-seq (F), RNA-seq (G), and all activating ChIP-seq (H) reads in linear proximity and 3D interchromosomal contact regions of clonal proviruses and proviruses detected once (“nonclonal”) using Hi-C data at 10 kb binning resolution. (C–H) HIV-1 Long LTR RNA-expressing proviruses were considered “RNA+”; HIV-1 Long-LTR RNA-negative proviruses are considered "RNA-". Clonal sequences were counted only once; clones were counted as transcriptionally active when at least one member of a clonal cluster had detectable expression of HIV-1 long LTR RNA. IS located in chromosomal regions in the ENCODE blacklist (Amemiya et al., 2019) were excluded. (p < 0.05, ∗∗p < 0.01, ∗∗∗p < 0.001, Mann-Whitney U tests were used for all comparisons).
Figure 7
Figure 7
Transcriptional activity of individual proviruses after in vitro stimulation (A) Proportion of proviruses producing any HIV-1 RNA or elongated HIV-1 RNA after 12 h of stimulation with PMA/ionomycin or control media. (B and C) Per-cell levels of HIV-1 long LTR (B) and elongated (C) transcripts from single HIV-1-infected cells after 12 h of stimulation with PMA/ionomycin or control media. Only proviruses with detectable HIV-1 RNA are included. (D) Chromosomal distance between proviral IS and nearest ChIP-seq peaks corresponding to repressive histone marks (H3K27me3 and H3K9me3) among viral RNA-positive or -negative proviruses stimulated with PMA/ionomycin. IS are annotated with ChIP-seq data from the ROADMAP project (resting primary CD4+ T cells, Kundaje et al., 2015) or from ENCODE (activated primary CD4+ T cells ). IS located in chromosomal regions in the ENCODE blacklist (Amemiya et al., 2019) were excluded. (E) Phylogenetic tree of clonal proviral species that were detected in stimulated and nonstimulated experimental conditions. (F) Per-cell levels of total HIV-1 transcripts detected in clonal HIV-1-infected cells analyzed in the presence or absence of stimulation with PMA/ionomycin. (p < 0.05, ∗∗∗p < 0.001, Mann-Whitney U tests were used for all comparisons. Error bars represent SEP).

Comment in

Similar articles

Cited by

References

    1. Aamer H.A., McClure J., Ko D., Maenza J., Collier A.C., Coombs R.W., Mullins J.I., Frenkel L.M. Cells producing residual viremia during antiretroviral treatment appear to contribute to rebound viremia following interruption of treatment. PLOS Pathog. 2020;16 - PMC - PubMed
    1. Achuthan V., Perreira J.M., Sowd G.A., Puray-Chavez M., McDougall W.M., Paulucci-Holthauzen A., Wu X., Fadel H.J., Poeschla E.M., Multani A.S., et al. Capsid-CPSF6 interaction licenses nuclear HIV-1 trafficking to sites of viral DNA integration. Cell Host Microbe. 2018;24:392–404. e8. - PMC - PubMed
    1. Agarwal N., Dancik G.M., Goodspeed A., Costello J.C., Owens C., Duex J.E., Theodorescu D. GON4L drives cancer growth through a YY1-androgen receptor-CD24 axis. Cancer Res. 2016;76:5175–5185. - PMC - PubMed
    1. Amemiya H.M., Kundaje A., Boyle A.P. The ENCODE blacklist: identification of problematic regions of the genome. Sci. Rep. 2019;9:9354. - PMC - PubMed
    1. Antar A.A., Jenike K.M., Jang S., Rigau D.N., Reeves D.B., Hoh R., Krone M.R., Keruly J.C., Moore R.D., Schiffer J.T., et al. Longitudinal study reveals HIV-1-infected CD4+ T cell dynamics during long-term antiretroviral therapy. J. Clin. Invest. 2020;130:3543–3559. - PMC - PubMed

Publication types

MeSH terms