. 2022 Jan 18;38(3):110271.
doi: 10.1016/j.celrep.2021.110271. Epub 2021 Dec 28.

Proteomic and metabolomic profiling of urine uncovers immune responses in patients with COVID-19

Affiliations

Proteomic and metabolomic profiling of urine uncovers immune responses in patients with COVID-19

Xiaojie Bi et al. Cell Rep. .

Abstract

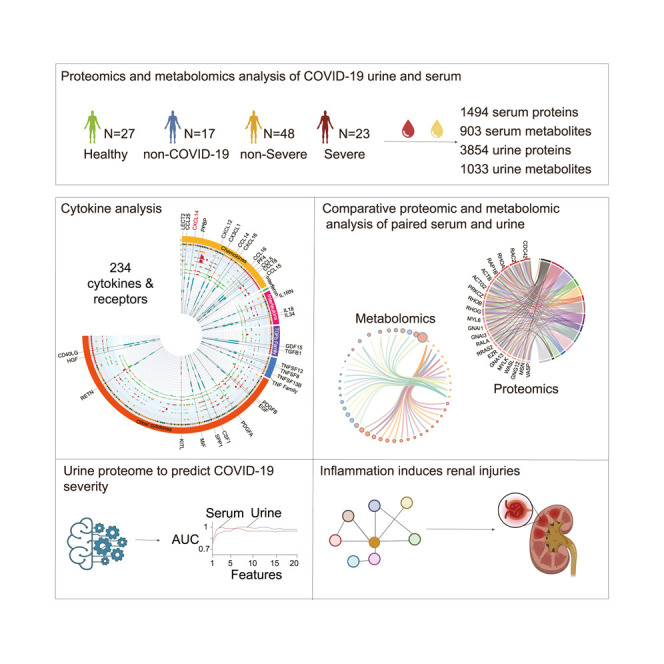
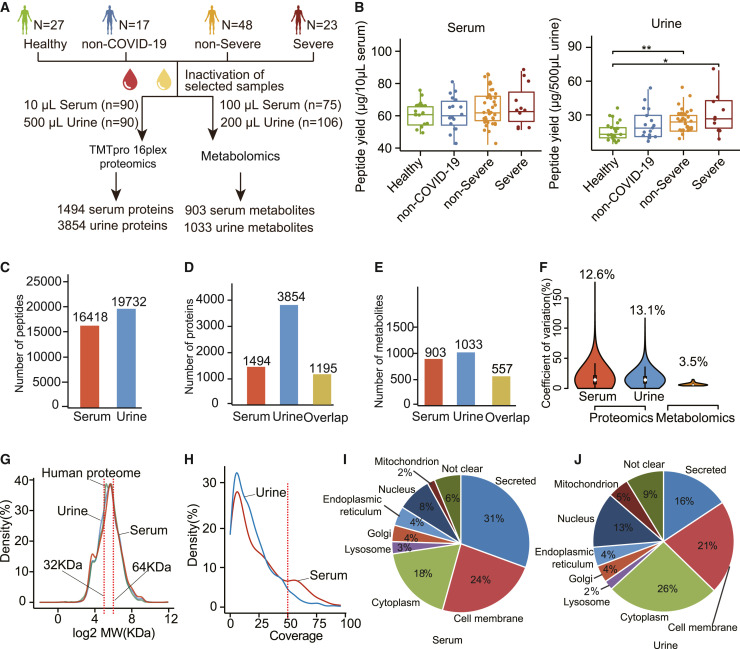
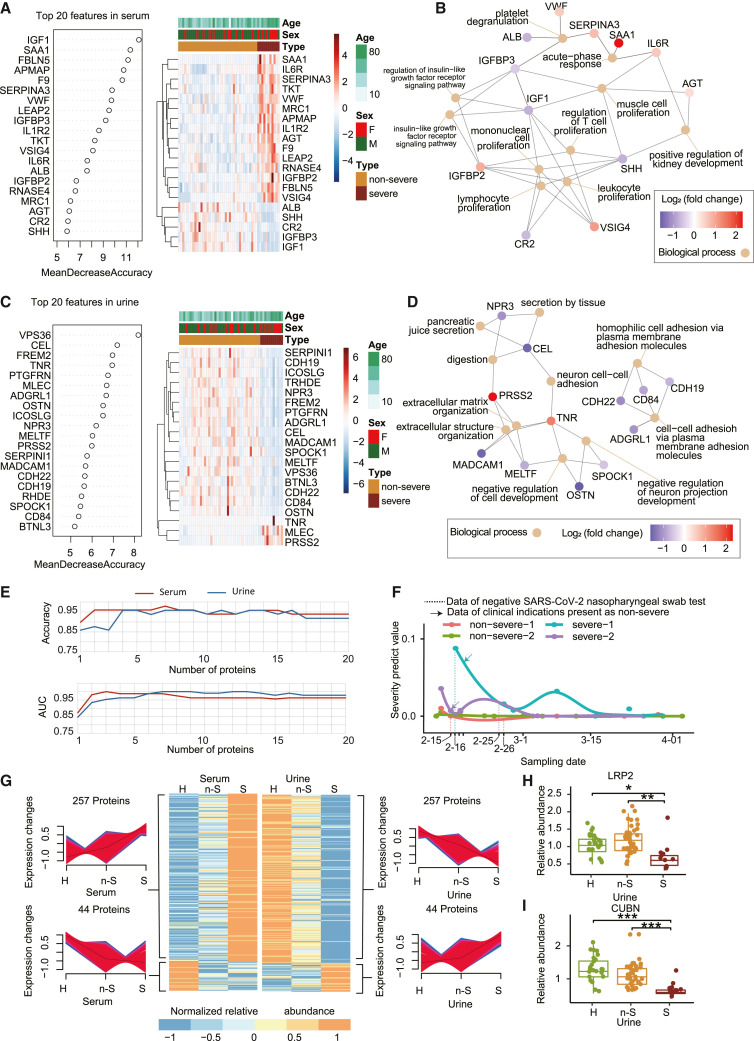
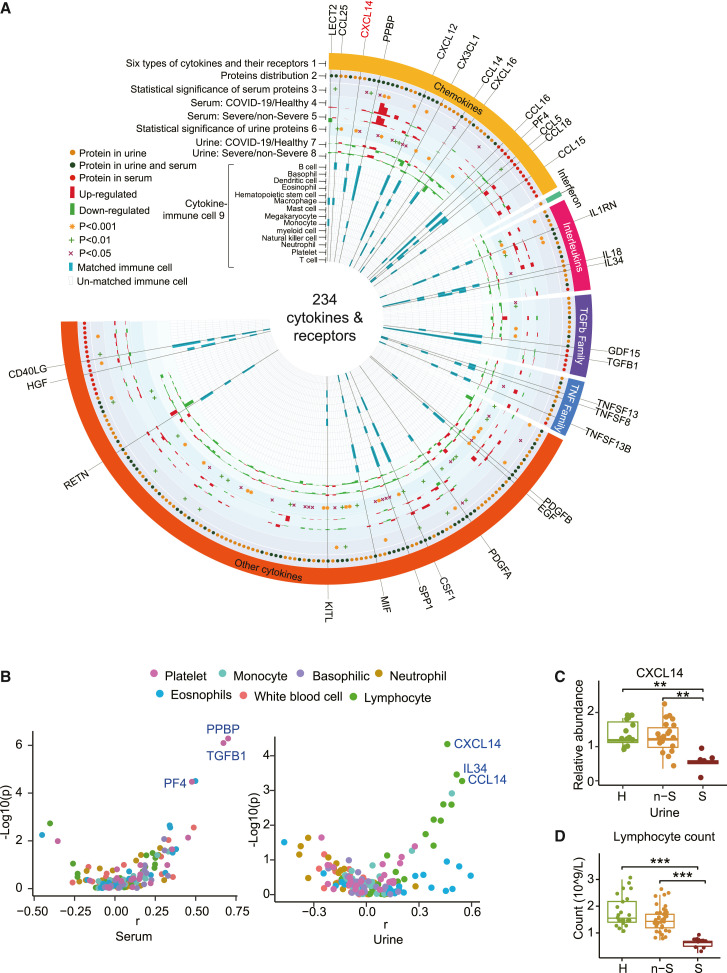
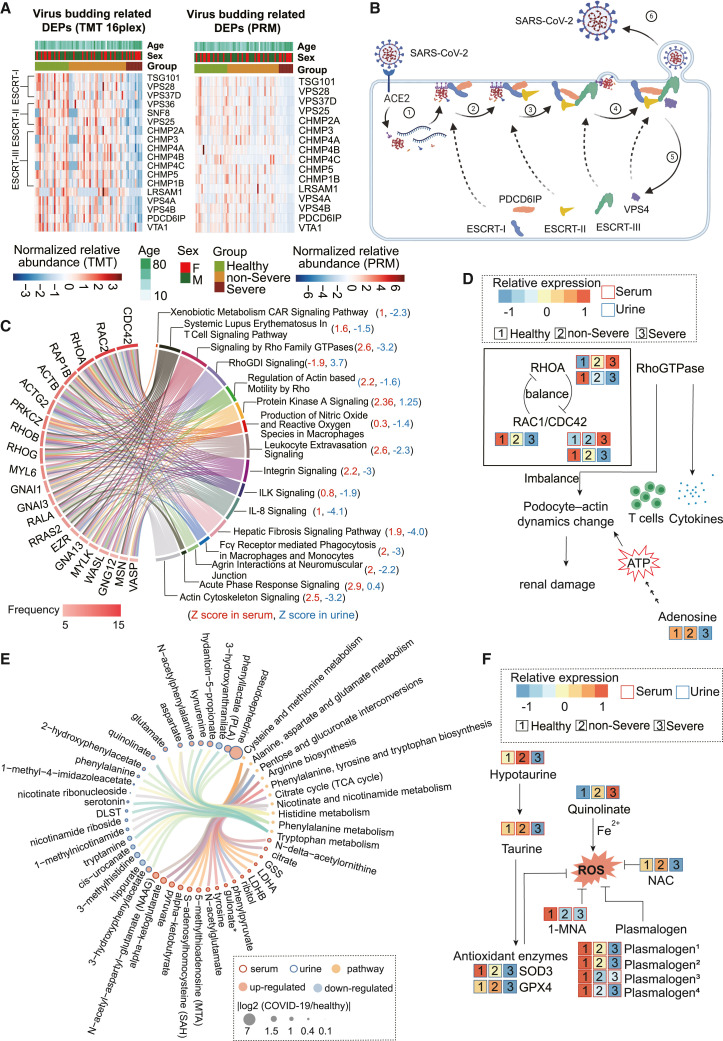
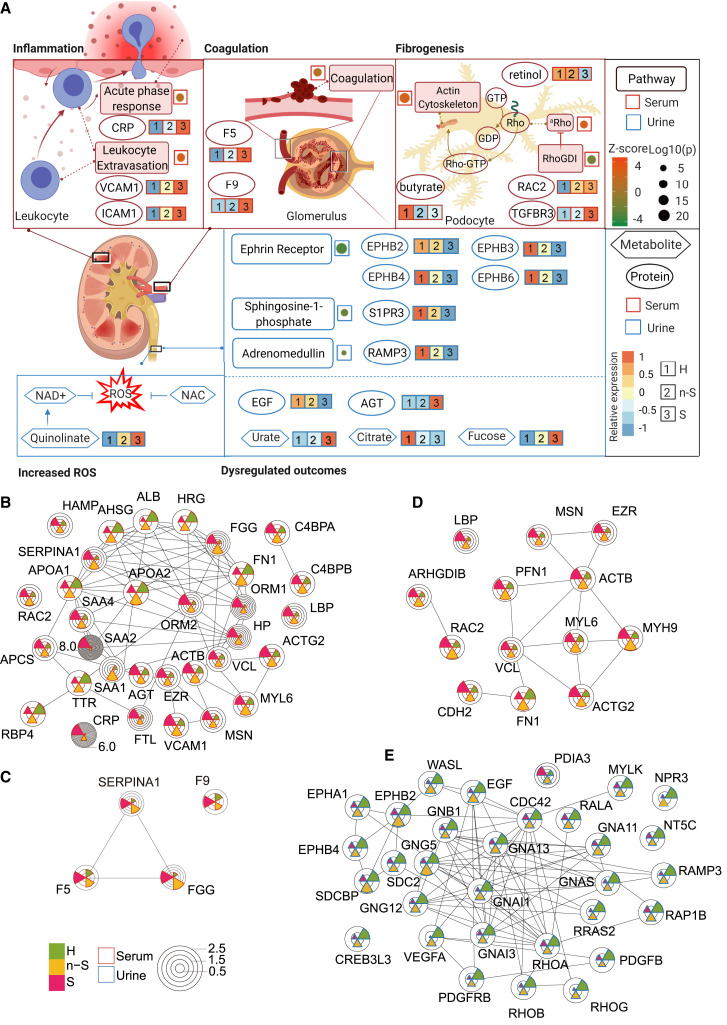
The utility of the urinary proteome in infectious diseases remains unclear. Here, we analyzed the proteome and metabolome of urine and serum samples from patients with COVID-19 and healthy controls. Our data show that urinary proteins effectively classify COVID-19 by severity. We detect 197 cytokines and their receptors in urine, but only 124 in serum using TMT-based proteomics. The decrease in urinary ESCRT complex proteins correlates with active SARS-CoV-2 replication. The downregulation of urinary CXCL14 in severe COVID-19 cases positively correlates with blood lymphocyte counts. Integrative multiomics analysis suggests that innate immune activation and inflammation triggered renal injuries in patients with COVID-19. COVID-19-associated modulation of the urinary proteome offers unique insights into the pathogenesis of this disease. This study demonstrates the added value of including the urinary proteome in a suite of multiomics analytes in evaluating the immune pathobiology and clinical course of COVID-19 and, potentially, other infectious diseases.

Keywords: COVID-19; CXCL14; ESCRT super-complex; metabolomics; proteomics; renal injury; serum; urine.


Conflict of interest statement

Declaration of interest The research group of T.G. is partly supported by Pressure Biosciences. T.G. and Y. Zhu are shareholders of Westlake Omics. W.L., X.Y., N.X., W.G., and X. Zhan are currently employees of Westlake Omics. S.Q., C.Z., and H.L. are employees of Calibra Lab at DIAN Diagnostics. The remaining authors declare no competing interests.

Figures

None
Graphical abstract
Figure 1
Figure 1
Overview of the serum and urine proteomics and metabolomics data (A) Study design. Four groups—healthy control (n = 27), non-COVID-19 control (n = 17), patients with non-severe COVID-19 (n = 48), and patients with severe COVID-19 (n = 23)—were included in this study. (B) Peptide yields of the 4 groups in serum and urine samples. (C–E) Number of characterized and overlapped peptides (C), proteins (D), and metabolites (E) in serum and urine. (F) Coefficients of variation (CVs) of the protein abundance from control samples by proteomics and metabolomics. (G) Molecular weight (MW) distributions of quantified proteins in the serum, the urine, and the entire human proteome. (H) Sequence coverage distribution of each quantified protein in serum and urine. (I and J) Subcellular localization composition of proteins identified in the (I) serum and (J) urine. p value between two groups were calculated by two-sided unpaired Student’s t test and adjusted by the Benjamini and Hochberg correction. Adjusted p values: p < 0.05; ∗∗p < 0.01; ∗∗∗p < 0.001. H, healthy; n-S, non-severe COVID-19; S, severe COVID-19. See also Figures 2, 3, S1, S2, and S6–S8.
Figure 2
Figure 2
Identification of severe and non-severe COVID-19 cases at the proteomics level (A and C) The top 20 feature proteins in serum (A) or urine (C) proteomics data selected by random forest analysis and ranked by the mean decrease in accuracy. (B and D) The biological process involved in the top 20 urine (B) or serum (D) proteins were annotated by Gene Ontology (GO) database and visualized by the clusterProfiler R package. (E) Line chart shows the accuracy and AUC values of the 20 serum or urine models. The features in each model were selected from top n (number of feature) important variables in the serum and urine data. (F) Severity prediction value of 4 patients with COVID-19 at different urine sampling times. (G) Heatmap shows 301 proteins identified in both serum and urine with opposite expression patterns in different patient groups. The 301 proteins are a union of 257 proteins that are upregulated in serum but downregulated in urine and 44 proteins that are downregulated in serum but upregulated in urine. The relative intensity values of proteins were Z score normalized. (H and I) The relative abundance of LRP2(H) and CUBN (I) in urine. The y axis means the protein expression ratio by TMT-based quantitative proteomics.
Figure 3
Figure 3
Cytokines characterized in the urine and serum (A) Circos plot integrating the relative expression and cytokine-immune cell relationship of 234 cytokines and their receptors. Track 1, the outermost layer, represents 234 cytokines and their receptors, which are grouped into six classes. Track 2 shows the cytokines detected from our urine and/or serum proteomics data, as indicated by different colored dots. Tracks 3 and 6, cytokines from the urine or serum, with a cutoff of p < 0.05 when comparing healthy donors and non-severe and severe cases using one-way ANOVA, were regarded as statistically significant. Tracks 4 and 7 represent serum or urine cytokine abundance distribution in COVID-19 (includes non-severe and severe) group and healthy group. Tracks 5 and 8 represent serum or urine cytokine abundance distribution in severe and non-severe groups. Track 9, the inner circle, shows the immune cells related to each cytokine inferred by immuneXpresso. (B) Spearman’s rank correlation coefficients between serum or urine cytokines and immune cells. (C) Expression pattern of CXCL14 in the urine. (D) Lymphocyte count in healthy donors and COVID-19 cases.
Figure 4
Figure 4
Dysregulated proteins and metabolites in the serum and urine of patients with COVID-19 (A) Virus budding-related DEPs uniquely regulated in the urine were identified by untargeted TMT 16plex proteomics and confirmed by PRM. (B) Schematic diagram of the virus budding process. (C) The top 21 regulated proteins are ranked by the frequency with which they are enrolled in the overlapped 16 out of 20 pathways between the serum and the urine by ingenuity pathway analysis (IPA). (D) Schematic diagram of the dynamic balance of Rho GTPases. The imbalance affects the functional integrity of glomerular podocytes and results in renal damage. (E) DEPs and differentially expressed microRNAs (DEMs) were involved in the 10 KEGG pathways. (F) Schematic diagram of metabolites participating in the oxidative stress in COVID-19.
Figure 5
Figure 5
The hypothetic model of immune dysregulation and increased ROS that induces renal injuries in patients with severe COVID-19 (A) Pathways are displayed in square boxes, proteins are displayed in circles, while metabolites are displayed in hexagons. The Z score of the activity of a pathway is displayed as dots beside the respective pathway in a red (for serum) or blue (for urine) box, with its size representing the log10(p value) of each pathway and its color representing the Z score value. Relative protein or metabolite expression is labeled beside the respective molecule. aRho, regulation of actin-based motility by Rho. (B) Serum DEPs involved in the acute phase response and leukocyte extravasation signaling. (C) Serum DEPs involved in the coagulation system. (D) Serum DEPs involved in the actin cytoskeleton and Rho signaling. (E) Urine DEPs involved in the ephrin receptor signaling, sphingosine-1-phosphate signaling, and adrenomedullin signaling. The relative expression values of proteins are shown in the pie chart.

References

    1. Adachi J., Kumar C., Zhang Y., Olsen J.V., Mann M. The human urinary proteome contains more than 1500 proteins, including a large proportion of membrane proteins. Genome Biol. 2006;7:R80. doi: 10.1186/gb-2006-7-9-R80. - DOI - PMC - PubMed
    1. Adell M.A., Teis D. Assembly and disassembly of the ESCRT-III membrane scission complex. FEBS Lett. 2011;585:3191–3196. doi: 10.1016/j.febslet.2011.09.001. - DOI - PMC - PubMed
    1. Barratt J., Topham P. Urine proteomics: the present and future of measuring urinary protein components in disease. CMAJ. 2007;177:361–368. doi: 10.1503/cmaj.061590. - DOI - PMC - PubMed
    1. Biedroń R., Ciszek M., Tokarczyk M., Bobek M., Kurnyta M., Słominska E.M., Smoleński R.T., Marcinkiewicz J. 1-Methylnicotinamide and nicotinamide: two related anti-inflammatory agents that differentially affect the functions of activated macrophages. Arch. Immunol. Ther. Exp. (Warsz) 2008;56:127–134. doi: 10.1007/s00005-008-0009-2. - DOI - PMC - PubMed
    1. Block F., Schwarz M. Expression of GFAP in the striatum and its projection areas in response to striatal quinolinic acid lesion in rats. Neuroreport. 1994;5:2237–2240. - PubMed

Publication types

MeSH terms