. 2022 Apr:50:102229.
doi: 10.1016/j.redox.2022.102229. Epub 2022 Jan 8.

Cognitive enhancement and neuroprotective effects of OABL, a sesquiterpene lactone in 5xFAD Alzheimer's disease mice model

Affiliations

Cognitive enhancement and neuroprotective effects of OABL, a sesquiterpene lactone in 5xFAD Alzheimer's disease mice model

Jiang-Jiang Tang et al. Redox Biol. 2022 Apr.

Abstract

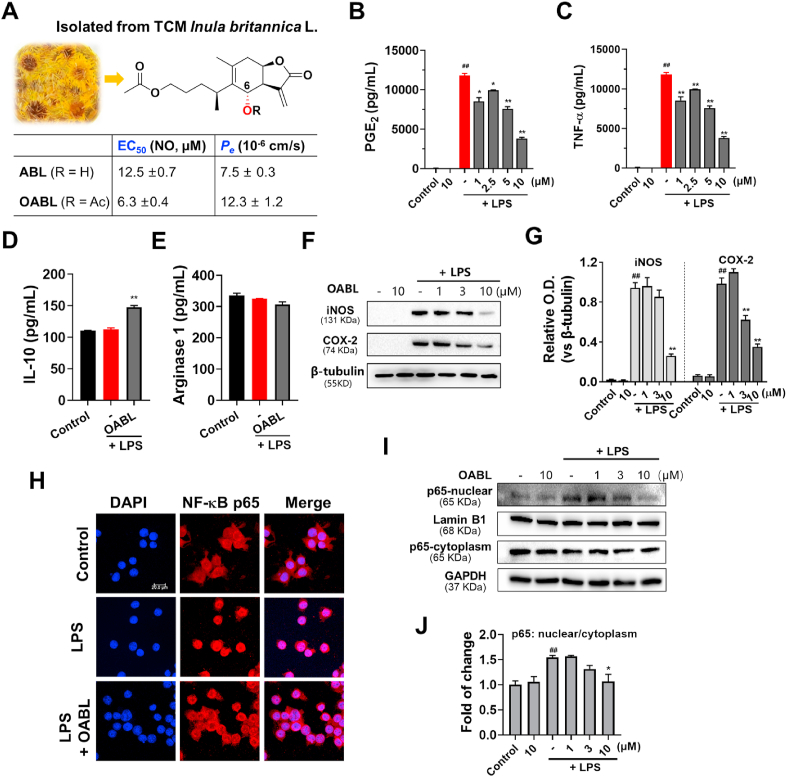
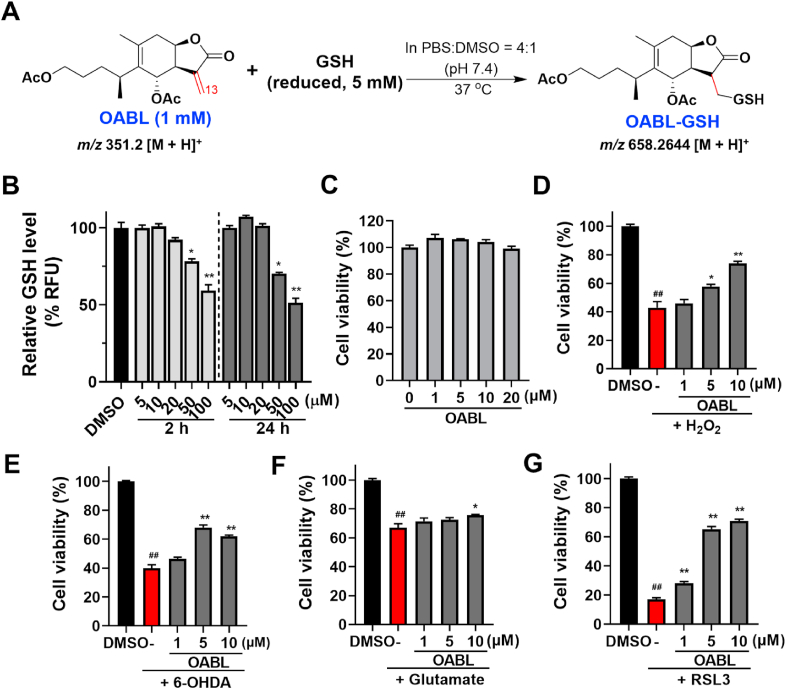
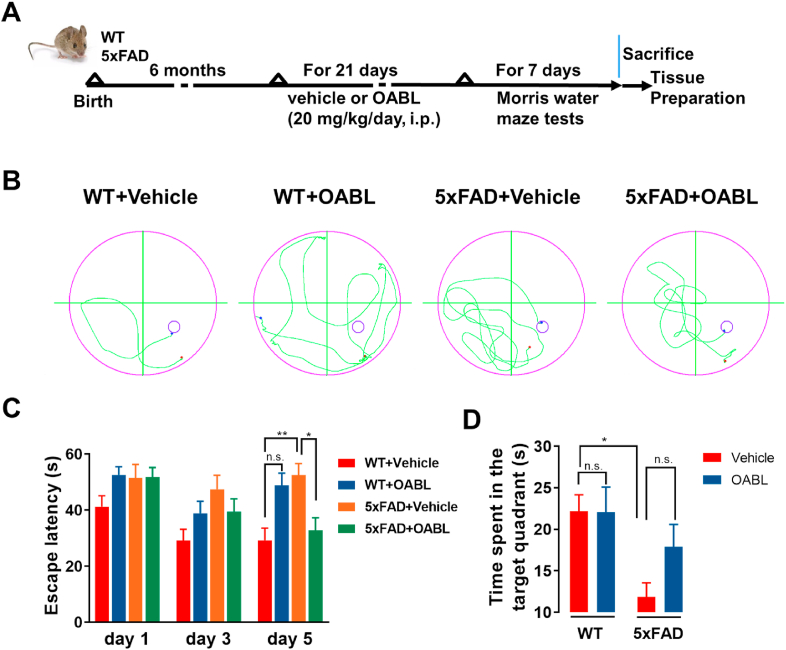
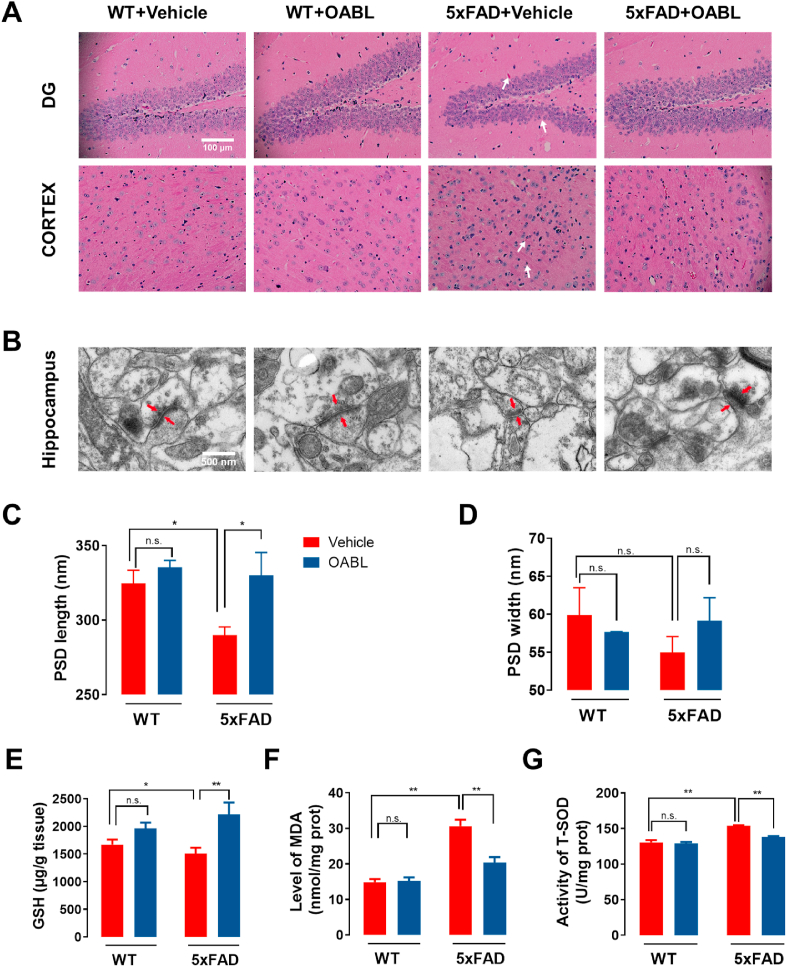
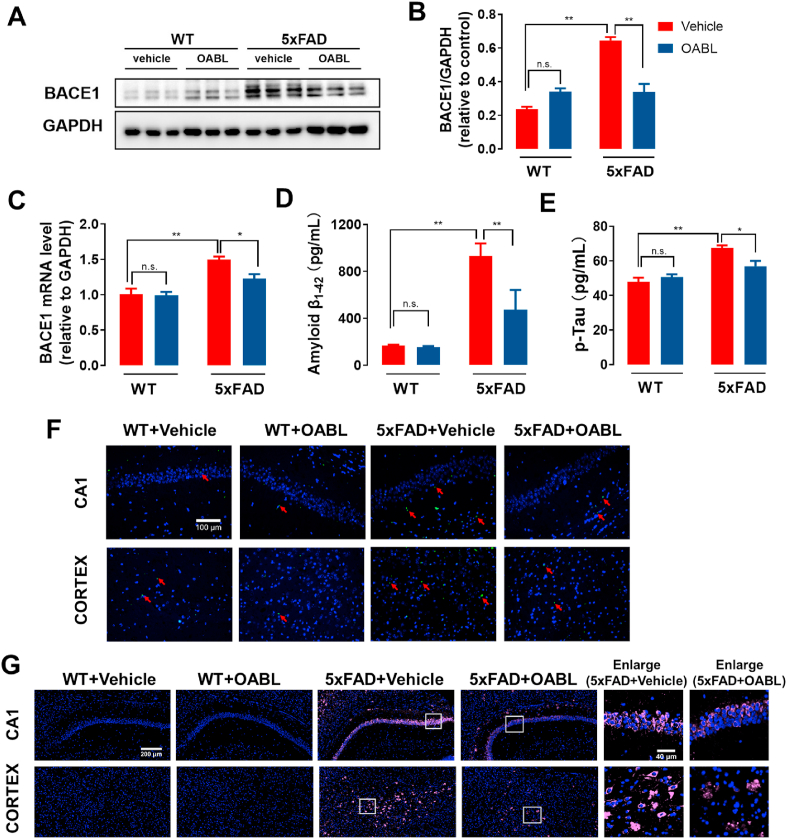
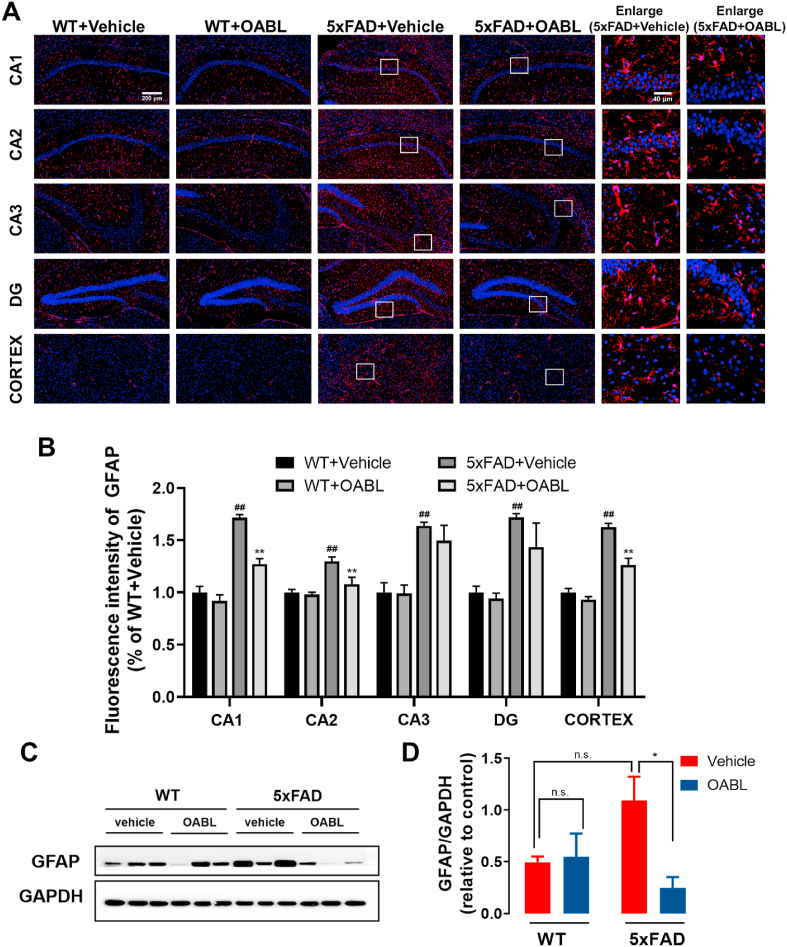
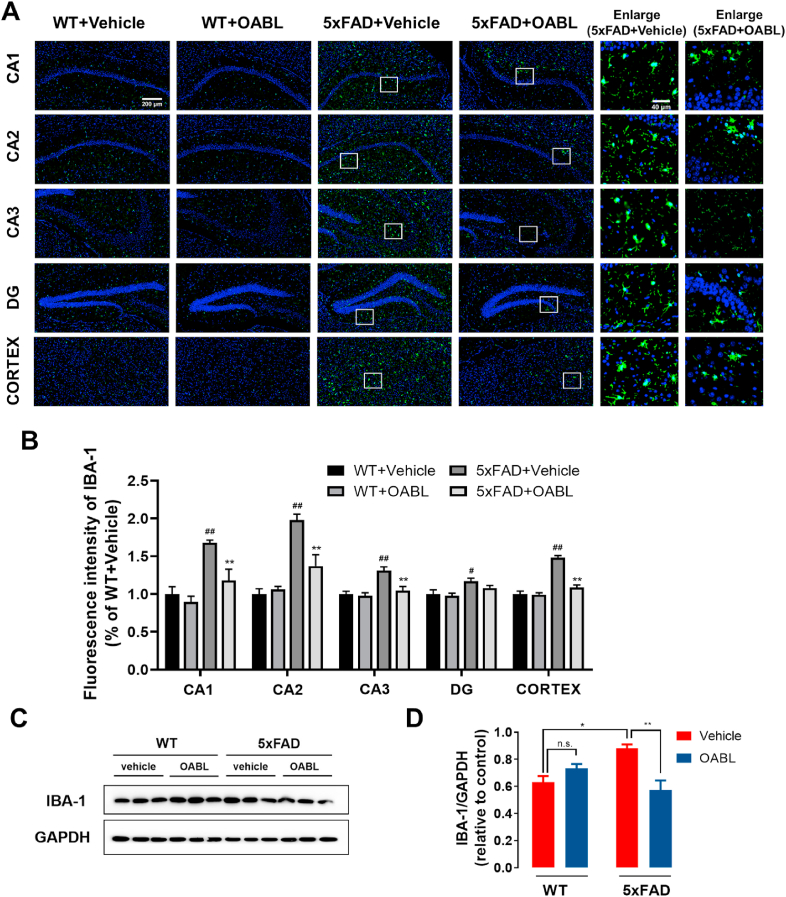
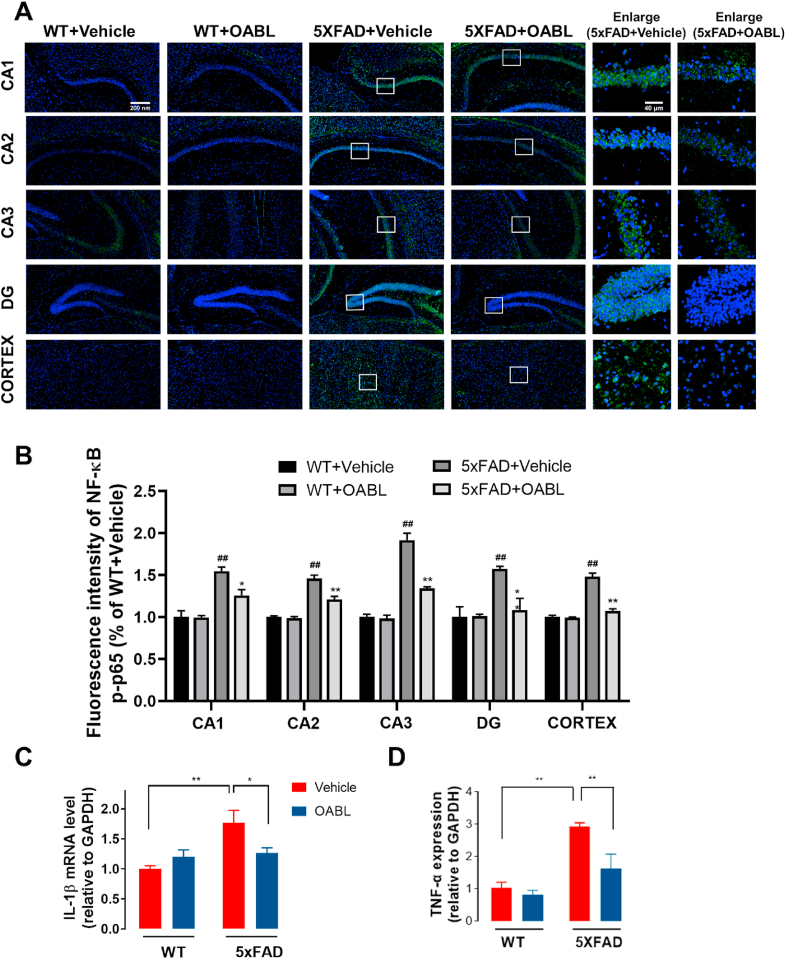
Alzheimer's disease (AD) is a neurodegenerative disease in which oxidative stress and neuroinflammation were demonstrated to be associated with neuronal loss and cognitive deficits. However, there are still no specific treatments that can prevent the progression of AD. In this study, a screening of anti-inflammatory hits from 4207 natural compounds of two different molecular libraries indicated 1,6-O,O-diacetylbritannilactone (OABL), a 1,10-seco-eudesmane sesquiterpene lactone isolated from the herb Inula britannica L., exhibited strong anti-inflammatory activity in vitro as well as favorable BBB penetration property. OABL reduced LPS-induced neuroinflammation in BV-2 microglial cells as assessed by effects on the levels of inflammatory mediators including NO, PGE2, TNF-α, iNOS, and COX-2, as well as the translocation of NF-κB. Besides, OABL also exhibited pronounced neuroprotective effects against oxytosis and ferroptosis in the rat pheochromocytoma PC12 cell line. For in vivo research, OABL (20 mg/kg B.W., i.p.) for 21 d attenuated the impairments in cognitive function observed in 6-month-old 5xFAD mice, as assessed with the Morris water maze test. OABL restored neuronal damage and postsynaptic density protein 95 (PSD95) expression in the hippocampus. OABL also significantly reduced the accumulation of amyloid plaques, the Aβ expression, the phosphorylation of Tau protein, and the expression of BACE1 in AD mice brain. In addition, OABL attenuated the overactivation of microglia and astrocytes by suppressing the expressions of inflammatory cytokines, and increased glutathione (GSH) and reduced malondialdehyde (MDA) and super oxide dismutase (SOD) levels in the 5xFAD mice brain. In conclusion, these results highlight the beneficial effects of the natural product OABL as a novel treatment with potential application for drug discovery in AD due to its pharmacological profile.

Keywords: 1,6-O,O-Diacetylbritannilactone (OABL); 5xFAD mice; Alzheimer's disease; Microglia; Neuroinflammation; Neuroprotection.


Conflict of interest statement

The authors declare that they have no known competing financial interests or personal relationships that could have appeared to influence the work reported in this paper.

Figures

Fig. 1
Fig. 1
The preventive effects of OABL on neuroinflammatory responses in LPS-stimulated BV-2 microglial cells (A) Chemical structures of natural products ABL and OABL, and their EC50 against NO production in LPS-stimulated BV-2 microglial cells and blood-brain barrier permeability (Pe); inhibition effects of OABL on PGE2 production (B) and TNF-α (C) in LPS-stimulated BV-2 cells; (D) effect of OABL at 10 μM on IL-10 production; (E) Arginase 1 (Arg-1) effect of OABL at 10 μM. The TNF-α, PGE2, IL-10 and Arg-1 levels in culture supernatant were determined by ELISA kit (R&D); (F) representative images of iNOS and COX-2 protein expression changes of OABL-treated BV-2 cells; (G) densitometric analyses of the iNOS and COX-2; (H) representative images of NF-κB p65 translocation of OABL at 10 μM. Immunofluorescence staining in both nucleus and cytoplasm by some colocalization of receptors (p65, red, Alexa Fluor 647) with nuclei (DAPI, blue) detected the distribution of NF-κB p65. Images were captured by confocal fluorescence microscope with 40 × objective, and the scale bar is 20 μm; (I) representative images of NF-κB p65 in the nucleus and cytoplasm in OABL-treated BV-2 cells; (J) densitometric analyses of the NF-κB p65 nuclear/cytoplasm. For these experiments, BV-2 cells were stimulated with or without 1 μg/mL LPS and treated with increasing concentrations of OABL for 24 h. The statistical analysis was performed by student's t-test, and all values are the mean ± SEM of three independent experiments. (##) p < 0.01 significantly different from the DMSO group; (*) p < 0.05 and (**) p < 0.01, vs. the LPS-treated control group. (For interpretation of the references to color in this figure legend, the reader is referred to the Web version of this article.)
Fig. 2
Fig. 2
The preventive effects of OABL on oxidative stress-induced PC12 neuronal death (A) Reaction of OABL and GSH in PBS. OABL (1 mM) and GSH (5 mM) were incubated in a solution of PBS: DMSO = 4: 1 at 37 °C for 2 h, and the reaction progress was monitored by HPLC-MS (see Fig. S2 in Supplementary data); (B) detection of GSH in live cells. PC12 cells were treated by various concentrations of OABL for 2 h or 24 h. The GSH level was measured according to a cellular GSH detection assay kit (#13859, CST) with the fluorescent intensity at an excitation wavelength of 380 nm and an emission wavelength of 460 nm using a SpectraMax M5 plate reader; (C) neurotoxic effect of OABL against PC12 cells. Cells were incubated with vehicle and OABL (1, 5, 10, and 20 μM) for 24 h; (DG) oxidative damage was induced by H2O2, 6-OHDA, oxytosis was induced by glutamate, and ferroptosis was induced with RSL3 in PC12 cells. PC12 cells were incubated with vehicle (0.1%, DMSO) and OABL (1, 5, and 10 μM) for 24 h, and then exposed to various inducers for 24 h. The cell viability was assessed by MTT assay; inhibition effects of OABL (D) in 0.6 mM H2O2-induced PC12 cells; (E) in 1.0 mM 6-OHDA-induced PC12 cells; (F) in 100 mM glutamate-induced PC12 cells; (G) in 10 μM RSL3-induced PC12 cells. The statistical analysis was performed via student's t-test, and the data are presented as the means ± SEM from three or five independent experiments, each with 4–6 duplicates. (##) p < 0.01 as compared to control (DMSO); (*) p < 0.05 and (**) p < 0.01 vs. the inducers-treated group.
Fig. 3
Fig. 3
OABL attenuated cognitive impairments in 5xFAD transgenic AD mice (A) Experimental workflow of animal treatments (n = 8); (B) representative tracks of the test during the probe trial on day 5; (C) the escape latency of different groups on day 1, day 3, and day 5; (D) the time spent in target quadrant on day 6. The statistical analysis was performed via two-way ANOVA with Newman-Keuls multiple comparisons test, and the data are presented as the means ± SEM with significance different from each other (n = 6–8), (*) p < 0.05, (**) p < 0.01. n.s.: not significant.
Fig. 4
Fig. 4
OABL alleviated neuronal damage and oxidative stress in 5xFAD mice brain (A) Representative images of H&E staining in DG region of hippocampus and cortex among experimental groups. The clear features of shrinkage of nuclei and shrinking neurons (white arrows) were improved in the 5xFAD+OABL group, compared with the 5xFAD+Vehicle group; (B) typical electron micrograph of synaptosomal sections from the hippocampus. The PSD is displayed with red arrows. Electron micrograph analyses were performed on 12 slices from 3 animals per group; (C, D) quantification of width and length of PSD based on electron micrography analyses by ImageJ software; (EG) the levels of GSH, MDA and T-SOD in cortex (n = 7). GSH was determined by DTNB assay, MDA was determined by homogenizing the cortex in PBS with EDTA and then TBA test, and T-SOD was measured by hydroxylamine method. The statistical analysis was performed via two-way ANOVA with Newman-Keuls multiple comparisons test, and the data are presented as the means ± SEM with significance different from each other, (*) p < 0.05, (**) p < 0.01. n.s.: not significant. (For interpretation of the references to color in this figure legend, the reader is referred to the Web version of this article.)
Fig. 5
Fig. 5
OABL reduced the Aβ accumulation and the expression of p-Tau protein in 5xFAD mice brain (A) Representative Western blots of BACE1 protein in the cortex of mice brain in different groups; (B) relative optical density (O.D.) of the BACE1 protein (n = 6); (C) the mRNA level of BACE1 in the cortex of mice brain by qRT-PCR (n = 6); (D) the level of Aβ1-42 in the hippocampus of different groups (n = 8–10) measured by ELISA kit (R&D); (E) the level of p-Tau protein in the cortex of mice brain (n = 5–7) measured by ELISA kit (MLBio); (F) representative thioflavin S staining images for detection of Aβ accumulation and immunostaining of Aβ1−42 in the hippocampus and cortex. Red arrows represent Aβ1-42-positive amyloid plaques; (G) representative immunofluorescence images for detection of Aβ1-42 (pink, Alexa Fluor® Plus 647) in the hippocampus and cortex. Nuclei was stained in blue (DAPI), and fluorescence intensity of Aβ1-42 was analyzed in Supplementary data (Fig. S6C). The statistical analysis was performed via two-way ANOVA with Newman-Keuls multiple comparisons test, and the data are presented as the means ± SEM with significance different from each other, (*) p < 0.05, (**) p < 0.01. n.s.: not significant. (For interpretation of the references to color in this figure legend, the reader is referred to the Web version of this article.)
Fig. 6
Fig. 6
OABL suppressed the astrogliosis in 5xFAD mice brain (A) Representative immunofluorescence images for detection of GFAP (red, CY3) in the hippocampus and cortex of different groups. Nuclei were stained in blue (DAPI); (B) quantification of positive area based on immunofluorescence staining sections by ImageJ software. Sections statistical analysis of fluorescence intensity of GFAP protein was conducted on 12 slices from 3 animals per group, (##) p < 0.01; (C) representative Western blots of GFAP protein in the cortex of mice brain; (D) relative optical density of GFAP protein (n = 6). The statistical analysis was performed via two-way ANOVA with Newman-Keuls multiple comparisons test, and the data are presented as the means ± SEM with significance different from each other, (*) p < 0.05, (**) p < 0.01. n.s.: not significant. (For interpretation of the references to color in this figure legend, the reader is referred to the Web version of this article.)
Fig. 7
Fig. 7
OABL suppressed the over-activation of microglia in 5xFAD mice brain (A) Representative immunofluorescence images for detection of Iba-1 (green, FITC) in the hippocampus and cortex of different groups. Nuclei was stained in blue (DAPI); (B) quantification of positive area based on immunofluorescence staining sections by ImageJ software. Sections statistical analysis of fluorescence intensity of Iba-1 protein was conducted on 12 slices from 3 animals per group, (##) p < 0.01; (C) representative Western blots of Iba-1 protein in the cortex of mice brain; (D) relative optical density of Iba-1 protein (n = 6). The statistical analysis was performed via two-way ANOVA with Newman-Keuls multiple comparisons test, and the data are presented as the means ± SEM with significance different from each other, (*) p < 0.05, (**) p < 0.01. n.s.: not significant. (For interpretation of the references to color in this figure legend, the reader is referred to the Web version of this article.)
Fig. 8
Fig. 8
OABL reduced the activation of the NF-κB transcriptional pathway in 5xFAD mice brain (A) Representative immunofluorescence images for detection of NF-κB p-p65 (green, FITC) in the hippocampus and cortex. Nuclei were stained in blue (DAPI); (B) quantification of positive area based on immunofluorescence staining sections by ImageJ software. Sections statistical analysis of fluorescence intensity of NF-κB p-p65 was conducted on 12 slices from 3 animals per group, (##) p < 0.01; (C, D) the mRNA levels of IL-1β and TNF-α in the cortex of mice brain of different groups measured by qRT-PCR (n = 4). The statistical analysis was performed via two-way ANOVA with Newman-Keuls multiple comparisons test, and the data are presented as the means ± SEM with significance different from each other, (*) p < 0.05, (**) p < 0.01. (For interpretation of the references to color in this figure legend, the reader is referred to the Web version of this article.)

References

    1. Lubeek S.F.K., van der Geer E.R., van Gelder M.M.H.J., van de Kerkhof P.C.M., Gerritsen M.J.P. Improving dermatological Care for elderly people living in permanent healthcare institutions: suggestions from Dutch dermatologists. Acta Derm. Venereol. 2016;96:253–254. - PubMed
    1. Elmaleh D.R., Farlow M.R., Conti P.S., Tompkins R.G., Kundakovic L., Tanzi R.E. Developing effective Alzheimer's disease therapies: clinical experience and future directions. J. Alzheimers Dis. 2019;71:715–732. - PMC - PubMed
    1. van der Kant R., Goldstein L.S.B., Ossenkoppele R. Amyloid-beta-independent regulators of tau pathology in Alzheimer disease. Nat. Rev. Neurosci. 2020;21:21–35. - PubMed
    1. Tolar M., Abushakra S., Hey J.A., Porsteinsson A., Sabbagh M. Aducanumab, gantenerumab, BAN2401, and ALZ-801-the first wave of amyloid-targeting drugs for Alzheimer's disease with potential for near term approval. Alzheimer's Res. Ther. 2020;12:95. - PMC - PubMed
    1. Hung S.Y., Fu W.M. Drug candidates in clinical trials for Alzheimer's disease. J. Biomed. Sci. 2017;24:47. - PMC - PubMed

Publication types